Contents
What is almond butter
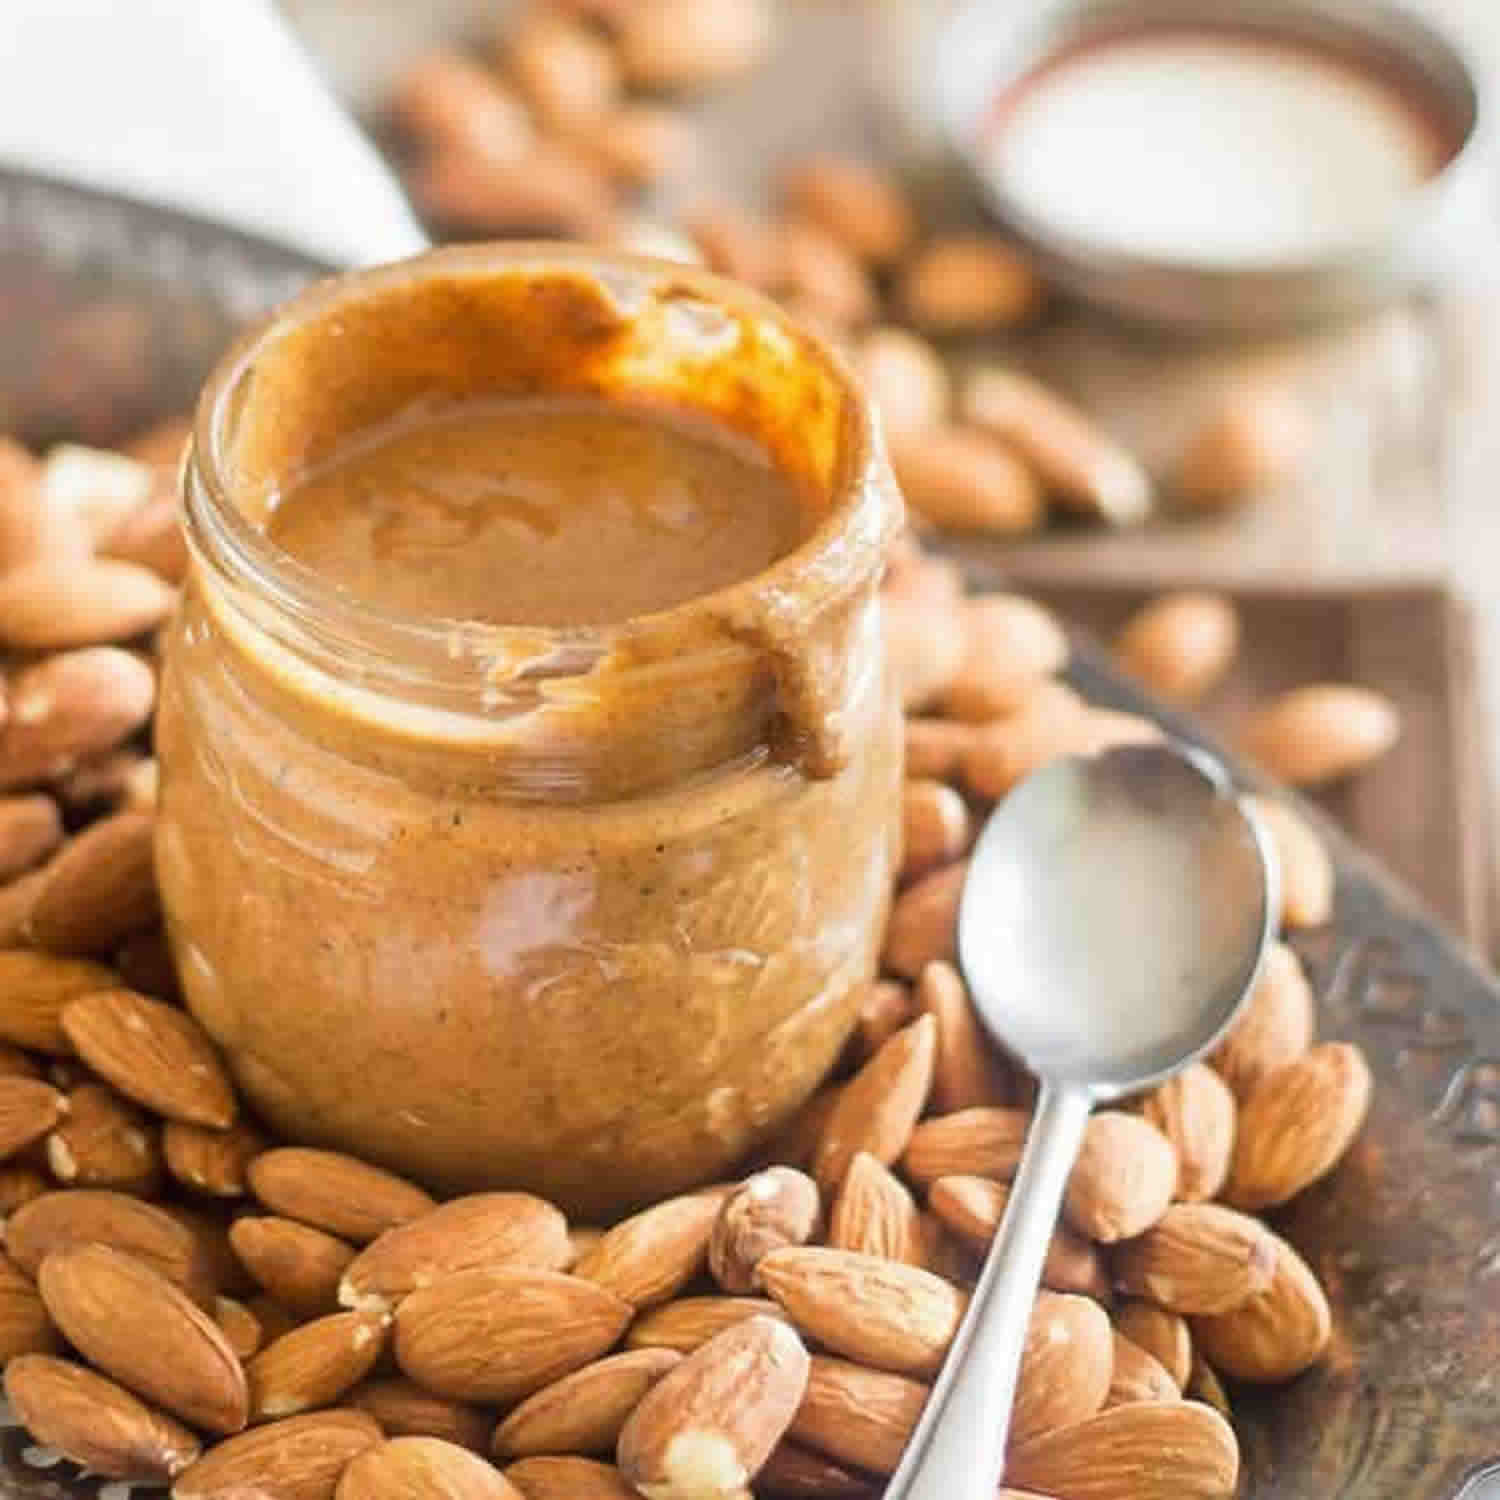
Almond butter is a food paste made from almonds. Almond butter may be crunchy or smooth, and is generally “stir” (susceptible to oil separation) or “no-stir” (emulsified). Almond butter may be either raw or roasted, describing the almonds themselves prior to grinding. It is recommended that almond butter be refrigerated once opened to prevent spoilage and oil separation. Generally, nut/seed butters contain generous amounts of phytochemicals that may be protective against colon, prostate, and breast cancer 1. According to Jiang et al. 2, the relative risk of developing diabetes was reduced 27 % in those who ate nuts five or more times per week compared with those who rarely or never ate nuts. Nutritional property of some of the nut/seed butter is presented in Table 6. Raw nuts have primarily 1 of the 2 unsaturated types (except coconut and palm kernels), thus leads healthful source of fatty acids for the production of lower cholesterol level foods. At present different plant based butters/spreads are available in the market. For example peanut butter, almond butter, cashew butter, pumpkin seed butter, pistachio butter, soy butter, sunflower and sesame butter. The term plant based (Nut/Seed) butter refers to a product that contains at least 90 % nut/seed ingredients whereas, the spread refers to a spreadable product having at least 40 % nut ingredients which can be added in various forms, e.g. as nuts, a paste and/or a slurry 3.
The dairy butter is a water-in-oil emulsion, i.e. >80 % fat with tiny water droplets, perhaps some solids-not-fat and with/without salt 4 (see Table 5 below). However, animal foods such as butter are rich in saturated fat. Butter with and without salt contains 55 ± 2 g/100 g of saturated fat and 222 ± 2 mg/100 g cholesterol 5.
Due to the mounting health concerns regarding the consumption of dairy butter because of its high saturated fat content has raised the need to search for an alternative plant based butters viz., nut butters and seed butters. Nuts and seeds are nutrient dense foods and have been a regular constituent of mankind’s diet since pre-agricultural times 6. Nuts and seeds are generally consumed as snack food in roasted form as they are of good taste, handy and easy to eat. But, recently with the advent of new technologies, myriad varieties of nut and seed based snacks and processed products have arrived in the market out of which the form of butter gained more popularity.
Evidence suggests that nut consumption, including peanuts, protects against not only coronary heart disease (coronary artery disease) but also against diabetes and the coronary heart disease (coronary artery disease) associated with diabetes, and other metabolic syndrome diseases, notably gallstone disease 7. In one of the largest studies to date about the health benefits of nuts, researchers analyzed data from more than 210,000 health professionals over as many as 32 years. They found that, compared with those who never or almost never ate nuts, people who ate one ounce of nuts five or more times per week had a 14% lower risk of cardiovascular disease and a 20% lower risk of coronary heart disease during the study period. Both walnuts and peanuts were linked with lower disease risk, the study found. No heart benefits were associated with eating peanut butter—which could be because people tend to pair peanut butter with unhealthy foods or because peanut butter is often mixed with salt and sweeteners, possibly canceling out the positive health benefits of the peanuts, according to an editorial accompanying the study.
The form of butter is one of the healthy way of integrating nuts and seeds into your regular diet. Nut and seed butters are generally prepared by roasting, grinding and refrigerated to consume it when it is still fresh. During this process it is imperative to retain the nutritional properties of these nuts and seeds in order to reap the benefits of the fresh nuts and seeds in the form of butter as well. Proper care is needed to minimize the conversion of healthful components in to unhealthy components during processing and further storage. Roasting temperature, temperatures during grinding and storage are the vital factors to be considered in order to have healthy and nutritious plant based butters.
The type of nuts you choose to eat probably doesn’t matter much. Most nuts appear to be generally healthy, though some may have more heart-healthy nutrients than others. For example, walnuts contain high amounts of omega-3 fatty acids.
Almonds, macadamia nuts, hazelnuts and pecans are other nuts that appear to be quite heart healthy. And peanuts — which are technically not a nut, but a legume, like beans — seem to be relatively healthy.
Keep in mind, you could end up canceling out the heart-healthy benefits of nuts if they’re covered with chocolate, sugar or salt.
What’s in nuts that might make them heart healthy?
Besides being packed with protein, most nuts contain at least some of these heart-healthy substances:
- Unsaturated fats. It’s not entirely clear why, but it’s thought that the “good” fats in nuts — both monounsaturated and polyunsaturated fats — lower bad cholesterol levels.
- Omega-3 fatty acids. Omega-3 fatty acids are found in many kinds of fish, but many nuts are also rich in omega-3 fatty acids. Omega-3s are a healthy form of fatty acids that seem to help your heart by, among other things, preventing dangerous heart rhythms that can lead to heart attacks.
- Fiber. All nuts contain fiber, which helps lower your cholesterol. Fiber makes you feel full, so you eat less. Fiber is also thought to play a role in preventing type 2 diabetes.
- Vitamin E. Vitamin E may help stop the development of plaques in your arteries, which can narrow them. Plaque development in your arteries can lead to chest pain, coronary artery disease or a heart attack.
- Plant sterols. Some nuts contain plant sterols, a substance that can help lower your cholesterol. Plant sterols are often added to products like margarine and orange juice for additional health benefits, but sterols occur naturally in nuts.
- L-arginine. Nuts are also a source of l-arginine, which is a substance that may help improve the health of your artery walls by making them more flexible and less prone to blood clots that can block blood flow.
Figure 1. Almond butter
Almond butter nutrition
Almond butter is high in monounsaturated fats, calcium, potassium, iron and manganese. Almond butter is considered a good source of riboflavin, phosphorus, and copper and an excellent source of vitamin E, magnesium, and fiber. Almond butter also provides dietary protein.
Almond butter is an alternative to peanut butter for those with peanut allergies or who dislike the taste of peanuts. Almond butter contains significantly more fiber, calcium, potassium, iron, and manganese than peanut butter and about half the saturated fat, although a slightly higher total fat content. Almonds are not legumes whereas peanuts are, so almond butter can be consumed by those looking to avoid legumes.
Plain raw almond butter calories without added salt is about 614 calories per 100 gram.
Carbs in almond butter is 18.82 gram per 100 gram.
Table 1. Almond butter (plain without added salt) nutrition facts
| Nutrient | Unit | Value per 100 g | |||||
| Approximates | |||||||
| Water | g | 1.64 | |||||
| Energy | kcal | 614 | |||||
| Energy | kJ | 2568 | |||||
| Protein | g | 20.96 | |||||
| Total lipid (fat) | g | 55.5 | |||||
| Ash | g | 3.09 | |||||
| Carbohydrate, by difference | g | 18.82 | |||||
| Fiber, total dietary | g | 10.3 | |||||
| Sugars, total | g | 4.43 | |||||
| Sucrose | g | 4.34 | |||||
| Glucose (dextrose) | g | 0.02 | |||||
| Fructose | g | 0 | |||||
| Lactose | g | 0 | |||||
| Maltose | g | 0.07 | |||||
| Starch | g | 0.08 | |||||
| Minerals | |||||||
| Calcium, Ca | mg | 347 | |||||
| Iron, Fe | mg | 3.49 | |||||
| Magnesium, Mg | mg | 279 | |||||
| Phosphorus, P | mg | 508 | |||||
| Potassium, K | mg | 748 | |||||
| Sodium, Na | mg | 7 | |||||
| Zinc, Zn | mg | 3.29 | |||||
| Copper, Cu | mg | 0.934 | |||||
| Manganese, Mn | mg | 2.131 | |||||
| Selenium, Se | µg | 2.4 | |||||
| Vitamins | |||||||
| Vitamin C, total ascorbic acid | mg | 0 | |||||
| Thiamin | mg | 0.041 | |||||
| Riboflavin | mg | 0.939 | |||||
| Niacin | mg | 3.155 | |||||
| Pantothenic acid | mg | 0.318 | |||||
| Vitamin B-6 | mg | 0.103 | |||||
| Folate, total | µg | 53 | |||||
| Folic acid | µg | 0 | |||||
| Folate, food | µg | 53 | |||||
| Folate, DFE | µg | 53 | |||||
| Choline, total | mg | 52.1 | |||||
| Vitamin B-12 | µg | 0 | |||||
| Vitamin A, RAE | µg | 0 | |||||
| Retinol | µg | 0 | |||||
| Carotene, beta | µg | 1 | |||||
| Carotene, alpha | µg | 0 | |||||
| Cryptoxanthin, beta | µg | 0 | |||||
| Vitamin A, IU | IU | 1 | |||||
| Lycopene | µg | 0 | |||||
| Lutein + zeaxanthin | µg | 1 | |||||
| Vitamin E (alpha-tocopherol) | mg | 24.21 | |||||
| Tocopherol, beta | mg | 0.53 | |||||
| Tocopherol, gamma | mg | 1.01 | |||||
| Tocopherol, delta | mg | 0 | |||||
| Vitamin D (D2 + D3) | µg | 0 | |||||
| Vitamin D | IU | 0 | |||||
| Vitamin K (phylloquinone) | µg | 0 | |||||
| Lipids | |||||||
| Fatty acids, total saturated | g | 4.152 | |||||
| 8:0 | g | 0 | |||||
| 10:0 | g | 0 | |||||
| 12:0 | g | 0 | |||||
| 14:0 | g | 0.007 | |||||
| 15:0 | g | 0 | |||||
| 16:0 | g | 3.192 | |||||
| 17:0 | g | 0.007 | |||||
| 18:0 | g | 0.938 | |||||
| 20:0 | g | 0.007 | |||||
| 22:0 | g | 0 | |||||
| Fatty acids, total monounsaturated | g | 32.445 | |||||
| 14:1 | g | 0 | |||||
| 15:1 | g | 0 | |||||
| 16:1 undifferentiated | g | 0.248 | |||||
| 17:1 | g | 0.035 | |||||
| 18:1 undifferentiated | g | 32.143 | |||||
| 20:1 | g | 0.019 | |||||
| Fatty acids, total polyunsaturated | g | 13.613 | |||||
| 18:2 undifferentiated | g | 13.605 | |||||
| 18:3 undifferentiated | g | 0.007 | |||||
| 20:2 n-6 c,c | g | 0 | |||||
| 20:3 undifferentiated | g | 0 | |||||
| 20:4 undifferentiated | g | 0 | |||||
| Cholesterol | mg | 0 | |||||
| Phytosterols | mg | 139 | |||||
| Stigmasterol | mg | 3 | |||||
| Campesterol | mg | 6 | |||||
| Beta-sitosterol | mg | 131 | |||||
| Amino Acids | |||||||
| Tryptophan | g | 0.159 | |||||
| Threonine | g | 0.555 | |||||
| Isoleucine | g | 0.813 | |||||
| Leucine | g | 1.483 | |||||
| Lysine | g | 0.612 | |||||
| Methionine | g | 0.122 | |||||
| Cystine | g | 0.242 | |||||
| Phenylalanine | g | 1.149 | |||||
| Tyrosine | g | 0.595 | |||||
| Valine | g | 0.937 | |||||
| Arginine | g | 2.382 | |||||
| Histidine | g | 0.55 | |||||
| Alanine | g | 0.99 | |||||
| Aspartic acid | g | 2.397 | |||||
| Glutamic acid | g | 5.912 | |||||
| Glycine | g | 1.472 | |||||
| Proline | g | 0.915 | |||||
| Serine | g | 0.926 | |||||
| Other | |||||||
| Alcohol, ethyl | g | 0 | |||||
Table 2. Organic almond butter (raw) nutrition facts
| Nutrient | Unit | Value per 100 g | ||||
| Approximates | ||||||
| Energy | kcal | 562 | ||||
| Protein | g | 21.88 | ||||
| Total lipid (fat) | g | 50 | ||||
| Carbohydrate, by difference | g | 18.75 | ||||
| Fiber, total dietary | g | 12.5 | ||||
| Sugars, total | g | 6.25 | ||||
| Minerals | ||||||
| Calcium, Ca | mg | 250 | ||||
| Iron, Fe | mg | 4.5 | ||||
| Sodium, Na | mg | 0 | ||||
| Vitamins | ||||||
| Vitamin C, total ascorbic acid | mg | 0 | ||||
| Vitamin A, IU | IU | 0 | ||||
| Lipids | ||||||
| Fatty acids, total saturated | g | 3.12 | ||||
| Fatty acids, total trans | g | 0 | ||||
| Cholesterol | mg | 0 | ||||
Table 3. Organic almond butter (raw and crunchy) nutrition facts
| Nutrient | Unit | Value per 100 g | ||||
| Approximates | ||||||
| Energy | kcal | 562 | ||||
| Protein | g | 21.88 | ||||
| Total lipid (fat) | g | 50 | ||||
| Carbohydrate, by difference | g | 18.75 | ||||
| Fiber, total dietary | g | 12.5 | ||||
| Sugars, total | g | 6.25 | ||||
| Minerals | ||||||
| Calcium, Ca | mg | 250 | ||||
| Iron, Fe | mg | 4.5 | ||||
| Sodium, Na | mg | 0 | ||||
| Vitamins | ||||||
| Vitamin C, total ascorbic acid | mg | 0 | ||||
| Vitamin A, IU | IU | 0 | ||||
| Lipids | ||||||
| Fatty acids, total saturated | g | 3.12 | ||||
| Fatty acids, total trans | g | 0 | ||||
| Cholesterol | mg | 0 | ||||
Table 4. Organic almond butter (dry roasted unblanched) nutrition facts
| Nutrient | Unit | Value per 100 g | ||||
| Approximates | ||||||
| Energy | kcal | 633 | ||||
| Protein | g | 16.67 | ||||
| Total lipid (fat) | g | 60 | ||||
| Carbohydrate, by difference | g | 20 | ||||
| Fiber, total dietary | g | 3.3 | ||||
| Sugars, total | g | 6.67 | ||||
| Minerals | ||||||
| Calcium, Ca | mg | 267 | ||||
| Iron, Fe | mg | 3.6 | ||||
| Potassium, K | mg | 767 | ||||
| Sodium, Na | mg | 0 | ||||
| Vitamins | ||||||
| Vitamin C, total ascorbic acid | mg | 0 | ||||
| Folate, total | µg | 53 | ||||
| Vitamin A, IU | IU | 0 | ||||
| Lipids | ||||||
| Fatty acids, total saturated | g | 5 | ||||
| Fatty acids, total monounsaturated | g | 33.33 | ||||
| Fatty acids, total polyunsaturated | g | 13.33 | ||||
| Fatty acids, total trans | g | 0 | ||||
| Cholesterol | mg | 0 | ||||
Table 5. Butter (plain without added salt) nutrition facts
| Nutrient | Unit | Value per 100 g | |||||
| Approximates | |||||||
| Water | g | 16.17 | |||||
| Energy | kcal | 717 | |||||
| Energy | kJ | 2999 | |||||
| Protein | g | 0.85 | |||||
| Total lipid (fat) | g | 81.11 | |||||
| Ash | g | 0.09 | |||||
| Carbohydrate, by difference | g | 0.06 | |||||
| Fiber, total dietary | g | 0 | |||||
| Sugars, total | g | 0.06 | |||||
| Minerals | |||||||
| Calcium, Ca | mg | 24 | |||||
| Iron, Fe | mg | 0.02 | |||||
| Magnesium, Mg | mg | 2 | |||||
| Phosphorus, P | mg | 24 | |||||
| Potassium, K | mg | 24 | |||||
| Sodium, Na | mg | 11 | |||||
| Zinc, Zn | mg | 0.09 | |||||
| Copper, Cu | mg | 0.016 | |||||
| Manganese, Mn | mg | 0.004 | |||||
| Selenium, Se | µg | 1 | |||||
| Fluoride, F | µg | 2.8 | |||||
| Vitamins | |||||||
| Vitamin C, total ascorbic acid | mg | 0 | |||||
| Thiamin | mg | 0.005 | |||||
| Riboflavin | mg | 0.034 | |||||
| Niacin | mg | 0.042 | |||||
| Pantothenic acid | mg | 0.11 | |||||
| Vitamin B-6 | mg | 0.003 | |||||
| Folate, total | µg | 3 | |||||
| Folic acid | µg | 0 | |||||
| Folate, food | µg | 3 | |||||
| Folate, DFE | µg | 3 | |||||
| Choline, total | mg | 18.8 | |||||
| Vitamin B-12 | µg | 0.17 | |||||
| Vitamin B-12, added | µg | 0 | |||||
| Vitamin A, RAE | µg | 684 | |||||
| Retinol | µg | 671 | |||||
| Carotene, beta | µg | 158 | |||||
| Carotene, alpha | µg | 0 | |||||
| Cryptoxanthin, beta | µg | 0 | |||||
| Vitamin A, IU | IU | 2499 | |||||
| Lycopene | µg | 0 | |||||
| Lutein + zeaxanthin | µg | 0 | |||||
| Vitamin E (alpha-tocopherol) | mg | 2.32 | |||||
| Vitamin E, added | mg | 0 | |||||
| Tocopherol, beta | mg | 0 | |||||
| Tocopherol, gamma | mg | 0 | |||||
| Tocopherol, delta | mg | 0 | |||||
| Vitamin D (D2 + D3) | µg | 0 | |||||
| Vitamin D2 (ergocalciferol) | µg | 0 | |||||
| Vitamin D3 (cholecalciferol) | µg | 0 | |||||
| Vitamin D | IU | 0 | |||||
| Vitamin K (phylloquinone) | µg | 7 | |||||
| Lipids | |||||||
| Fatty acids, total saturated | g | 50.489 | |||||
| 4:0 | g | 3.226 | |||||
| 6:0 | g | 2.007 | |||||
| 8:0 | g | 1.19 | |||||
| 10:0 | g | 2.529 | |||||
| 12:0 | g | 2.587 | |||||
| 14:0 | g | 7.436 | |||||
| 16:0 | g | 21.697 | |||||
| 17:0 | g | 0.56 | |||||
| 18:0 | g | 9.999 | |||||
| 20:0 | g | 0.138 | |||||
| Fatty acids, total monounsaturated | g | 23.43 | |||||
| 16:1 undifferentiated | g | 1.82 | |||||
| 16:1 c | g | 0.961 | |||||
| 18:1 undifferentiated | g | 20.4 | |||||
| 18:1 c | g | 16.978 | |||||
| 18:1 t | g | 2.982 | |||||
| 20:1 | g | 0.1 | |||||
| 22:1 undifferentiated | g | 0 | |||||
| Fatty acids, total polyunsaturated | g | 3.01 | |||||
| 18:2 undifferentiated | g | 1.83 | |||||
| 18:2 n-6 c,c | g | 2.166 | |||||
| 18:2 CLAs | g | 0.267 | |||||
| 18:2 i | g | 0.296 | |||||
| 18:3 undifferentiated | g | 1.18 | |||||
| 18:3 n-3 c,c,c (ALA) | g | 0.315 | |||||
| 18:4 | g | 0 | |||||
| 20:4 undifferentiated | g | 0 | |||||
| 20:5 n-3 (EPA) | g | 0 | |||||
| 22:5 n-3 (DPA) | g | 0 | |||||
| 22:6 n-3 (DHA) | g | 0 | |||||
| Cholesterol | mg | 215 | |||||
| Stigmasterol | mg | 0 | |||||
| Campesterol | mg | 0 | |||||
| Beta-sitosterol | mg | 4 | |||||
| Amino Acids | |||||||
| Tryptophan | g | 0.012 | |||||
| Threonine | g | 0.038 | |||||
| Isoleucine | g | 0.051 | |||||
| Leucine | g | 0.083 | |||||
| Lysine | g | 0.067 | |||||
| Methionine | g | 0.021 | |||||
| Cystine | g | 0.008 | |||||
| Phenylalanine | g | 0.041 | |||||
| Tyrosine | g | 0.041 | |||||
| Valine | g | 0.057 | |||||
| Arginine | g | 0.031 | |||||
| Histidine | g | 0.023 | |||||
| Alanine | g | 0.029 | |||||
| Aspartic acid | g | 0.064 | |||||
| Glutamic acid | g | 0.178 | |||||
| Glycine | g | 0.018 | |||||
| Proline | g | 0.082 | |||||
| Serine | g | 0.046 | |||||
| Other | |||||||
| Alcohol, ethyl | g | 0 | |||||
| Caffeine | mg | 0 | |||||
| Theobromine | mg | 0 | |||||
Table 6. Nutritional property of nut and seed butter (1 Tbsp)
| Product | Calorie | Protein | Fat | Calcium | Zinc |
|---|---|---|---|---|---|
| (g) | (g) | (mg) | (mg) | ||
| Almond butter | 101 | 2.4 | 9.5 | 43 | 0.5 |
| Cashew butter | 93 | 2.8 | 8.0 | 7 | 0.8 |
| Hazelnut butter | 94 | 2.0 | 9.5 | – | – |
| Sunflower butter | 80 | 3.0 | 7.0 | – | – |
| Sesame butter | 89 | 2.6 | 8.0 | 64 | 0.7 |
| Peanut butter | |||||
| natural | 94 | 3.8 | 8.0 | 7 | 0.4 |
| reduced fat | 95 | 4.0 | 6.0 | – | 0.4 |
| Soy butter | |||||
| sweetened | 85 | 4.0 | 5.5 | 50 | – |
| unsweetened | 80 | 4.0 | 6.5 | 30 | – |
| Soy-peanut butter | 50 | 2.0 | 1.2 | 40 | – |
| sweetened | |||||
Note: 1Tbsp = 14.19 g
Almond butter vs peanut butter
Almond butter has significantly more fiber, calcium, and potassium than sunflower seed or peanut butter 10. Spiller et al. 11 compared the lipid-altering effect of roasted salted almonds and roasted almond butter with that of raw almonds, as part of a plant-based diet (Table 10). High-density lipoprotein “good” cholesterol (HDL) did not significantly change with raw or roasted almonds but slightly increased with almond butter. HDL cholesterol is the good cholesterol that cruises the bloodstream and high levels HDL reduces the risk for heart disease.
The findings of this study 12found that consumption of nuts and peanut butter was inversely associated with risk of type 2 diabetes, independent of known risk factors for type 2 diabetes, including age, obesity, family history of diabetes, physical activity, smoking, and dietary factors. Peanut butter (Arachis hypogaea) is creamy, composed of peanut paste and stabilizer. It may also contain sweetener, salt, emulsifier and other ingredients. Peanut butter is prepared by roasting, blanching, grinding and tempering. The formulation of a typical peanut butter is shown in Table 7. Good quality nuts and seed pods are sorted out and destoned before shelling. Shelled nuts are graded to ensure the sound or bold or even size nuts. Roasting is a dry heat treatment, carried out not so much for dehydration but for flavor, color and texture development 13. Roasting involves a number of physico-chemical changes including dehydration and chemical reactions. However, the development of flavor and aroma depends upon the temperature and time of roasting beside the type of nuts and techniques applied 14. Generally, for peanut butter, roasting is done at around 160 °C for 40–60 min depending upon the seed size and moisture contents 15. Roasting reduces water contents to around 1 % followed by the release of oil from the cytoplasm of the cells which increases the shelf life of peanuts and helps in developing flavor for peanut butter. Ogunsanwo et al. 16 reported that the peanut butter prepared by roasting at 160 °C for 30 min was found comparable with the commercial samples. Blanching of peanuts is done to remove the skin of the peanut. There are several blanching methods including dry, water, spin, and air impact. Dry blanching is used primarily in peanut butter production, as it removes the kernel hearts which affect peanut butter flavor. After removing the outer skin during blanching, nuts are ground into paste. Peanut butter is usually made by two stage grinding operations. First grinding reduces the nuts to a medium size and the second milling uses a very high-speed grinder cum mixer that has a combination of cutting-shearing and attrition action and reduces to a fine (less than 0.025 cm) smooth texture. Due to this several passes the paste is subjected to excessively high temperature, an elaborative cooling methods need to be utilized to retain desired flavors in the nut butter. Connick 17 states that accomplishing the grinding steps in the presence of solid carbon dioxide inhibits the dissolving, occlusion, and adsorption of free oxygen into the peanut butter and there by increases the shelf life as well as improves the flavor. Woodroof 18 classified peanut butters into three types based on the texture viz., Smooth (even texture with no perceptible grainy peanut particles), Regular (definitely grainy texture with with perceptible peanut particles not more than 1/16 in. in diameter and Chunky (partially fine and partially grainy particles with substantial amounts larger than 1/16 in. in diameter). Crippen et al. 19 reported that increased grind size (fine, medium and course), decreased the sensory smoothness, spreadability, adhesiveness and preference ratings. According to Dzurik et al. 20 the high pressure homogenization after initial grinding produces a paste of smooth, glossy, melts more rapidly in the mouth than conventional peanut butter. During grinding, the ingredients like salt, sugar, stabilizers and emulsifiers are added. Addition of salt (< 1.2 %) increased the ease of swallowing, as well as consumer preference of texture. Before grinding of nut/seeds, carbohydrates, protein and other non-fat components will be in a continuous phase. Fat cells entrapped in non-fat components will be in a discontinuous phase. After grinding into paste, fat cells ruptured and become continuous and non-fat constituents form a discontinuous phase. Once the paste is formed, continuous phase (fat/ oil) will separate from the nonfat particles. Without stabilizers, paste settles at the bottom and forms a hard layer while the oil remains on top 21. Thus, stabilizers in plant based butter prevent gravitational separation of less dense oil from solid particles during storage at ambient temperatures 22. Galvez et al. 23 reported that the peanut butter without stabilizer exhibited > 2 % oil separation after 12 weeks of storage. During conditioning to prevent oil separation, mixture is immediately chilled and the hydrogenated oil forms finely divided and sufficient amount of hard fat crystals. The amount and nature of the crystals determines the stability of the product. The rate of cooling determines the size of the crystals 24. Woodroof 25 has discussed the important considerations on type and amount of stabilizer with respect to the desired consistency and mouth feel of peanut butter, oil content and particle size. The temperature of paste during the addition of stabilizer should be more than the melting point of stabilizer to produce a more homogenized product. Thus, the recommended temperature for blending of stabilizers is 60–74 °C. Totlani and Chinnan 26 reported that the addition of 1–2 % stabilizer was found to be adequate for peanut butter stored for 3 months at 35 °C. Aryana et al. 27 and Gills and Resurreccion 28 reported that the use of blended hydrogenated rapeseed and cottonseed oils as stabilizer in peanut butter was superior to palm oil. Addition of emulsifier in the peanut butter negates stickiness so that it will not stick to the roof of the mouth. Suitable emulsifiers include lecithin and fatty mono- and diglycerides, for example, soybean mono- and diglycerides 29. Different emulsifiers affirmed as GRAS are shown in Table 8. Furthermore, for improved stability, the peanut butter should be packed at the proper temperature and it should be tempered for a minimum of 24 h before shipping. This tempering allows time for additional crystal growth and formation of a good crystalline network 24.
Table 7. Formulation of a typical peanut butter
| Component | Percentage |
|---|---|
| Peanut paste (~1 % moisture) | 90 |
| Hydrogenated vegetable oil | 1–5 |
| Sweetener | 1–6 |
| Salt | 1–1.5 |
| Emulsifier | 0.5–1.5 |
Table 8. Some food emulsifiers affirmed as GRAS
| Emulsifier | US FDA (21CFR) | EEC (E No.) |
|---|---|---|
| Diacetyl tartaric esters of monoglycerides (DATEM) | 184.1101 | E472e |
| Lecithin | 184.1400 | E322 |
| Mono-and diglycerides | 184.1505 | E471 |
| Monosodium phosphate derivatives of mono and diglycerides | 184.1521 | – |
Table 9. Peanut butter (raw) nutrition facts
| Nutrient | Unit | Value per 100 g | |||||
| Approximates | |||||||
| Water | g | 6.5 | |||||
| Energy | kcal | 567 | |||||
| Energy | kJ | 2374 | |||||
| Protein | g | 25.8 | |||||
| Total lipid (fat) | g | 49.24 | |||||
| Ash | g | 2.33 | |||||
| Carbohydrate, by difference | g | 16.13 | |||||
| Fiber, total dietary | g | 8.5 | |||||
| Sugars, total | g | 4.72 | |||||
| Minerals | |||||||
| Calcium, Ca | mg | 92 | |||||
| Iron, Fe | mg | 4.58 | |||||
| Magnesium, Mg | mg | 168 | |||||
| Phosphorus, P | mg | 376 | |||||
| Potassium, K | mg | 705 | |||||
| Sodium, Na | mg | 18 | |||||
| Zinc, Zn | mg | 3.27 | |||||
| Copper, Cu | mg | 1.144 | |||||
| Manganese, Mn | mg | 1.934 | |||||
| Selenium, Se | µg | 7.2 | |||||
| Vitamins | |||||||
| Vitamin C, total ascorbic acid | mg | 0 | |||||
| Thiamin | mg | 0.64 | |||||
| Riboflavin | mg | 0.135 | |||||
| Niacin | mg | 12.066 | |||||
| Pantothenic acid | mg | 1.767 | |||||
| Vitamin B-6 | mg | 0.348 | |||||
| Folate, total | µg | 240 | |||||
| Folic acid | µg | 0 | |||||
| Folate, food | µg | 240 | |||||
| Folate, DFE | µg | 240 | |||||
| Choline, total | mg | 52.5 | |||||
| Betaine | mg | 0.6 | |||||
| Vitamin B-12 | µg | 0 | |||||
| Vitamin B-12, added | µg | 0 | |||||
| Vitamin A, RAE | µg | 0 | |||||
| Retinol | µg | 0 | |||||
| Carotene, beta | µg | 0 | |||||
| Carotene, alpha | µg | 0 | |||||
| Cryptoxanthin, beta | µg | 0 | |||||
| Vitamin A, IU | IU | 0 | |||||
| Lycopene | µg | 0 | |||||
| Lutein + zeaxanthin | µg | 0 | |||||
| Vitamin E (alpha-tocopherol) | mg | 8.33 | |||||
| Vitamin E, added | mg | 0 | |||||
| Vitamin D (D2 + D3) | µg | 0 | |||||
| Vitamin D | IU | 0 | |||||
| Vitamin K (phylloquinone) | µg | 0 | |||||
| Lipids | |||||||
| Fatty acids, total saturated | g | 6.279 | |||||
| 04:00:00 | g | 0 | |||||
| 06:00:00 | g | 0 | |||||
| 08:00:00 | g | 0 | |||||
| 10:00:00 | g | 0 | |||||
| 12:00:00 | g | 0 | |||||
| 14:00:00 | g | 0.025 | |||||
| 16:00:00 | g | 5.154 | |||||
| 18:00:00 | g | 1.1 | |||||
| Fatty acids, total monounsaturated | g | 24.426 | |||||
| 16:1 undifferentiated | g | 0.009 | |||||
| 18:1 undifferentiated | g | 23.756 | |||||
| 20:01:00 | g | 0.661 | |||||
| 22:1 undifferentiated | g | 0 | |||||
| Fatty acids, total polyunsaturated | g | 15.558 | |||||
| 18:2 undifferentiated | g | 15.555 | |||||
| 18:3 undifferentiated | g | 0.003 | |||||
| 18:04:00 | g | 0 | |||||
| 20:4 undifferentiated | g | 0 | |||||
| 20:5 n-3 (EPA) | g | 0 | |||||
| 22:5 n-3 (DPA) | g | 0 | |||||
| 22:6 n-3 (DHA) | g | 0 | |||||
| Fatty acids, total trans | g | 0 | |||||
| Cholesterol | mg | 0 | |||||
| Amino Acids | |||||||
| Tryptophan | g | 0.25 | |||||
| Threonine | g | 0.883 | |||||
| Isoleucine | g | 0.907 | |||||
| Leucine | g | 1.672 | |||||
| Lysine | g | 0.926 | |||||
| Methionine | g | 0.317 | |||||
| Cystine | g | 0.331 | |||||
| Phenylalanine | g | 1.377 | |||||
| Tyrosine | g | 1.049 | |||||
| Valine | g | 1.082 | |||||
| Arginine | g | 3.085 | |||||
| Histidine | g | 0.652 | |||||
| Alanine | g | 1.025 | |||||
| Aspartic acid | g | 3.146 | |||||
| Glutamic acid | g | 5.39 | |||||
| Glycine | g | 1.554 | |||||
| Proline | g | 1.138 | |||||
| Serine | g | 1.271 | |||||
| Other | |||||||
| Alcohol, ethyl | g | 0 | |||||
| Caffeine | mg | 0 | |||||
| Theobromine | mg | 0 | |||||
| Isoflavones | |||||||
| Daidzein | mg | 0.02 | |||||
| Genistein | mg | 0.24 | |||||
| Total isoflavones | mg | 0.26 | |||||
| Biochanin A | mg | 0.01 | |||||
| Formononetin | mg | 0 | |||||
| Coumestrol | mg | 0 | |||||
| Proanthocyanidin | |||||||
| Proanthocyanidin dimers | mg | 33.2 | |||||
| Proanthocyanidin trimers | mg | 48.8 | |||||
| Proanthocyanidin 4-6mers | mg | 48.1 | |||||
| Proanthocyanidin 7-10mers | mg | 0 | |||||
| Proanthocyanidin polymers (>10mers) | mg | 0 | |||||
Is almond butter good for you?
The answer to that question is yes. Almond consumption has been shown to reduce LDL “bad” cholesterol (LDL-C) concentrations and increase HDL “good” cholesterol (HDL-C) concentrations in hyperlipidaemic individuals 32. Although almonds contain a variety of constituents that may exert cardioprotective effects through various mechanisms 33, their ability to improve blood lipid profiles and reduce coronary heart disease risk may primarily be related to their healthy fatty acid profile, which is low in saturated fats and high in monounsaturated fats (MUFA) 34, particularly oleic acid 35. Epidemiological studies suggest that diets with a high proportion of monounsaturated fatty acid (MUFA) in the form of oleic acid, such as the Mediterranean diet, reduce coronary heart disease risk 36. However, the effect of almond consumption on the serum fatty acid profile and its association with coronary heart disease risk have not been investigated.
Almond butter benefits
The results of this study 37 indicate that almond consumption favourably alters the serum fatty acid profile by increasing the proportions of oleic acid and total monounsaturated fatty acid (MUFA) and decreasing those of saturated fatty acid. These changes in the fatty acid profile are correlated with improvements in blood lipoproteins and with a decreased 10-year coronary heart disease risk. The mechanism by which almonds modify coronary heart disease risk is unclear, it has been proposed that almonds may exert an effect exogenously and endogenously. It has been proposed that dietary incorporation of almonds exogenously reduces serum cholesterol concentrations by replacing saturated fats with monounsaturated fats in the diet. In a randomized, controlled, parallel study, the saturated fats concentrations of thirty-eight hypercholesterolemic adults who consumed 100 g of raw almonds daily over a 4-week period were found to be lower 38. Furthermore, increasing monounsaturated fatty acid (MUFA) intake has been reported to be associated with an increase in HDL “good” cholesterol concentrations, as demonstrated by a randomized, controlled trial of twenty-four hypercholesterolaemic adults 39. The improvement in blood lipid profiles has generally been associated with a reduced risk of coronary heart disease. It has also been proposed that almonds may act endogenously to exert a cardioprotective effect. Dietary fatty acid are rapidly incorporated into lipoprotein lipids. Enrichment of lipoprotein particles with monounsaturated fatty acid (MUFA) at the expense of polyunsaturated fatty acid (PUFA) may enhance their resistance to oxidative stress as there are few double bonds to react with, thus potentiating the anti-atherogenic effect 40. Moreover, there may be other bioactive components in almonds that further reduce coronary heart disease risk. In addition to unsaturated fatty acids, almonds are a good source of vitamin E, fiber and phytochemicals (phenols, flavonoids, proanthocyanidins and phytosterols), arginine, Cu and Mg, which may beneficially influence coronary artery disease risk 41. Many of these nutrients may act synergistically to produce the observed favourable outcomes, although further studies are required to prove this postulation 42. Further analysis of LDL particle size may provide a better understanding of potential mechanisms by which almonds and other foods rich in monounsaturated fatty acid (MUFA) influence triglyceride concentrations.
Almonds have potential health benefits and reduce risk factors associated with type 2 diabetes, cardiovascular disease, cancer and obesity 43. Previous studies have established that almond cell walls play a crucial role in regulating nutrient bioaccessibility in the gastrointestinal tract (GIT) 44. The term ‘bioaccessibility’ is defined as the proportion of a nutrient or phytochemical compound ‘released’ from a complex food matrix during digestion and, therefore, potentially available for absorption in the gastrointestinal tract (GIT). Using a in test tube and an animal study, scientists have recently demonstrated that test meals containing almonds of different particle sizes behaved differently: the degree of lipid encapsulation affected the rate and extent of bioaccessibility in the upper GIT 45. Scientists have also demonstrated that mastication of natural raw almonds released only a small proportion (7.9%) of the total lipid and was only slightly higher for roasted almonds (11.1%) 46. The lipid release from masticated almonds was in close agreement with that predicted by a theoretical model for almond lipid bioaccessibility 47. Using a test tube model of duodenal digestion 48, it was observed that a decrease in almond particle size resulted in an increased rate and extent of lipolysis.
Novotny et al. 49 conducted a feeding study in healthy adults to determine the energy value of almonds as a representative food from a group for which the Atwater factors may overestimate the energy value. They showed that only 76% of the energy contained within almonds (based on the Atwater factors) was actually metabolised 49. Furthermore, when calculating the metabolisable energy of whole natural almonds, whole roasted almonds, chopped almonds and almond butter, it was demonstrated that the number of calories absorbed was dependent on the form in which almonds were consumed.
It is known that processing of nuts, such as roasting, chopping and grinding, impacts mastication, particle size and lipid bioaccessibility 46. The decrease in size of almond particles, with consequent reduction of intact cell walls, determines the rate and extent of lipid bioaccessibility during digestion. It is interesting to note that there was limited lipid digestibility for natural raw almonds and roasted almonds during mastication. In almond butter from roasted almonds, all the intracellular lipids made available by cell-wall rupture, as well as the lipid molecules present at the interface and within the continuous lipid phase are readily available for absorption. The exposure of the remaining intact almond particles to mastication resulted in a further small release of lipid. Cassady et al. 50 reported important differences in appetitive and hormone responses after mastication of almonds. Gebauer et al. 51 have recently reported that the number of calories absorbed from almonds in the gastrointestinal tract is strictly dependent on the form in which they are consumed. As a result of incomplete macronutrient loss in the upper gastrointestinal tract, it is believed that a large proportion of nutrients from almonds reaches the large bowel, where it is fermented by the microbiota 44. Incomplete rupturing of the cell walls during mastication results in macronutrient encapsulation, which remain inaccessible to digestive enzymes and, if not fermented in the colon, are excreted in feces.
Table 10. Composition of raw and processed almonds per 100g edible portion
| Raw Almonds | Roasted Almonds | Almond Butter | |
|---|---|---|---|
| Water (g) | 4.2 | 1.3 | 2.1 |
| Protein (g) | 25.3 | 25.4 | 24.6 |
| Total lipid (g) | 49.5 | 52.5 | 55.7 |
| MUFA (g) | 30.7 | 32.1 | 32.7 |
| PUFA (g) | 10.6 | 11.4 | 13.8 |
| SFA (g) | 3.5 | 3.7 | 3.9 |
| Carbohydrate (g) | 17.9 | 18.5 | 14.5 |
| Dietary fiber (g) | 13.9 | 11.8 | 10.5 |
| Vitamin E (mg ATE) | 25.3 | 25.5 | 23.6 |
| Phytosterols (mg) | 113.6 | 125.8 | 145.1 |
| Sodium (mg) | <10 | 209 | <10 |
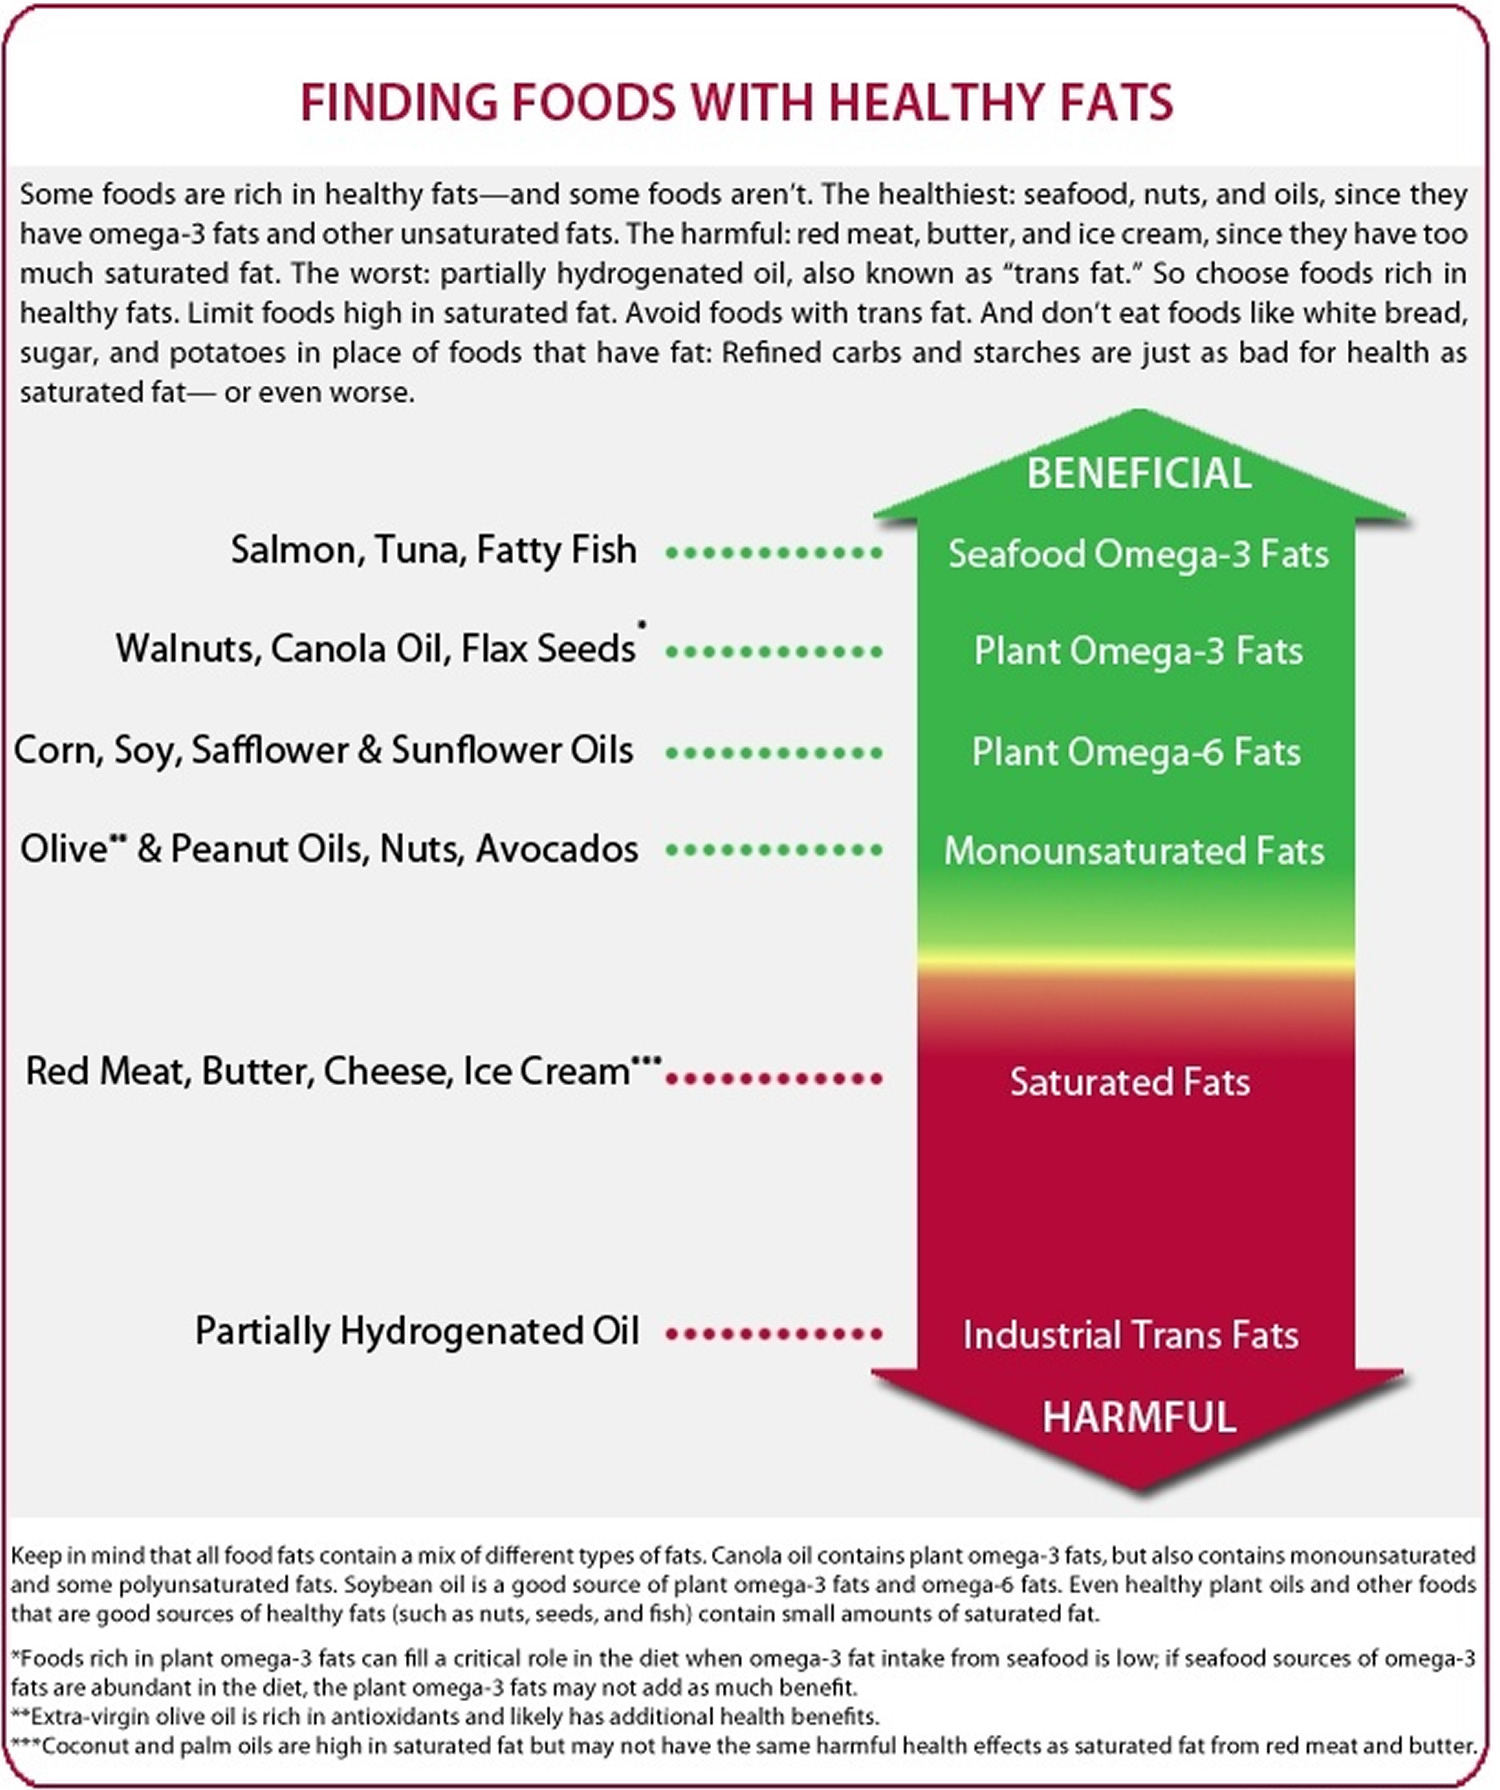
Unsaturated fats
Unsaturated fats, which are liquid at room temperature, are considered beneficial fats because they can improve blood cholesterol levels, ease inflammation, stabilize heart rhythms, and play a number of other beneficial roles. Unsaturated fats are predominantly found in foods from plants, such as vegetable oils, nuts, and seeds.
There are two types of “good” unsaturated fats:
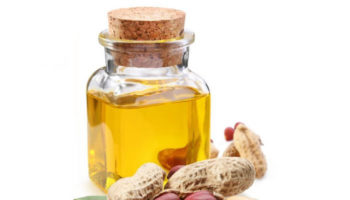
1. Monounsaturated fats are found in high concentrations in:
- Nuts such as almonds, hazelnuts, and pecans
- Seeds such as pumpkin and sesame seeds
- Olive, peanut, and canola oils
- Avocados
2. Polyunsaturated fats are found in high concentrations in:
- Sunflower, corn, soybean, and flaxseed oils
- Walnuts
- Flax seeds
- Fish
- Canola oil – though higher in monounsaturated fat, it’s also a good source of polyunsaturated fat.
Omega-3 fats are an important type of polyunsaturated fat. The body can’t make these, so they must come from food.
An excellent way to get omega-3 fats is by eating fish 2-3 times a week.
Good plant sources of omega-3 fats include flax seeds, walnuts, and canola or soybean oil.
Higher blood omega-3 fats are associated with lower risk of premature death among older adults, according to a study 52.
Most people don’t eat enough healthful unsaturated fats. The American Heart Association suggests that 8-10 percent of daily calories should come from polyunsaturated fats, and there is evidence that eating more polyunsaturated fat—up to 15 percent of daily calories—in place of saturated fat can lower heart disease risk 52.
Dutch researchers conducted an analysis of 60 trials that examined the effects of carbohydrates and various fats on blood lipid levels. In trials in which polyunsaturated and monounsaturated fats were eaten in place of carbohydrates, these good fats decreased levels of harmful LDL and increased protective HDL 53.
More recently, a randomized trial known as the Optimal Macronutrient Intake Trial for Heart Health (OmniHeart) showed that replacing a carbohydrate-rich diet with one rich in unsaturated fat, predominantly monounsaturated fats, lowers blood pressure, improves lipid levels, and reduces the estimated cardiovascular risk 54.
Saturated Fats
All foods containing fat have a mix of specific types of fats. Even healthy foods like chicken and nuts have small amounts of saturated fat, though much less than the amounts found in butter, ghee, coconut oil, beef, cheese and ice cream. Saturated fat is mainly found in animal foods, but a few plant foods are also high in saturated fats, such as coconut, coconut oil, palm oil, and palm kernel oil.
- The Dietary Guidelines for Americans recommends getting less than 10 percent of calories each day from saturated fat 55.
- The American Heart Association goes even further, recommending limiting saturated fat to no more than 7 percent of calories 56.
- Cutting back on saturated fat will likely have no benefit, however, if people replace saturated fat with refined carbohydrates. Eating refined carbohydrates in place of saturated fat does lower “bad” LDL cholesterol, but it also lowers the “good” HDL cholesterol and increases triglycerides. The net effect is as bad for the heart as eating too much saturated fat.
In the United States, the biggest sources of saturated fat 57 in the diet are:
- Pizza and cheese
- Whole and reduced fat milk, butter and dairy desserts
- Meat products (sausage, bacon, beef, hamburgers)
- Cookies and other grain-based desserts
- A variety of mixed fast food dishes
Though decades of dietary advice 58 suggested saturated fat was harmful, in recent years that idea has begun to evolve. Several studies suggest that eating diets high in saturated fat do not raise the risk of heart disease, with one report analyzing the findings of 21 studies that followed 350,000 people for up to 23 years.
Investigators looked at the relationship between saturated fat intake and coronary heart disease (coronary artery disease), stroke, and cardiovascular disease. Their controversial conclusion: “There is insufficient evidence from prospective epidemiologic studies to conclude that dietary saturated fat is associated with an increased risk of coronary heart disease, stroke, or cardiovascular disease” 58.
A well-publicized 2014 study questioned the link between saturated fat and heart disease, but nutrition experts determined the paper to be seriously misleading. In order to set the record straight, Harvard School of Public Health convened a panel of nutrition experts and held a teach-in, “Saturated or not: Does type of fat matter?“
The overarching message is that cutting back on saturated fat can be good for health if people replace saturated fat with good fats, especially, polyunsaturated fats 59, 60. Eating good fats in place of saturated fat lowers the “bad” LDL cholesterol, and it improves the ratio of total cholesterol to “good” HDL cholesterol, lowering the risk of heart disease.
Eating good fats in place of saturated fat can also help prevent insulin resistance, a precursor to diabetes 61. So while saturated fat may not be as harmful as once thought, evidence clearly shows that unsaturated fat remains the healthiest type of fat.
Trans Fats
Trans fatty acids, more commonly called trans fats, are made by heating liquid vegetable oils in the presence of hydrogen gas and a catalyst, a process called hydrogenation.
Partially hydrogenating vegetable oils makes them more stable and less likely to become rancid. This process also converts the oil into a solid, which makes them function as margarine or shortening.
Partially hydrogenated oils can withstand repeated heating without breaking down, making them ideal for frying fast foods.
For these reasons, partially hydrogenated oils became a mainstay in restaurants and the food industry – for frying, baked goods, and processed snack foods and margarine.
Partially hydrogenated oil is not the only source of trans fats in our diets. Trans fats are also naturally found in beef fat and dairy fat in small amounts.
Eliminating industrial-produced trans fats from the U.S. food supply could prevent between 6 and 19 percent of heart attacks and related deaths, or as much as 200,000 each year 62.
Trans fats are worse for cholesterol levels than saturated fats because they:
- Raise bad LDL “bad” cholesterol and lower good HDL “good” cholesterol
- Create inflammation 63 – a reaction related to immunity – which has been implicated in heart disease, stroke, diabetes, and other chronic conditions
- Contribute to insulin resistance 64
- Can have harmful health effects even in small amounts – for each additional 2 percent of calories from trans fat consumed daily, the risk of coronary heart disease increases by 23 percent.
Eliminating trans fats from food
In the 1990s, the average American was eating about 6 grams of trans fats a day; ideally that should be under 1 gram a day, and zero from partially hydrogenated oils is best 65.
A 2006 labeling law required food companies to list trans fats on food labels. This caused many food makers to switch to using trans-fat-free oils and fats in their products, resulting in a reduction of trans fat levels in the U.S. food supply.
A study from the Centers for Disease Control and Prevention 66 found that Americans’ blood-levels of trans fats dropped 58 percent from 2000 to 2009—evidence that the labeling law has had its desired effect.
A survey of 83 major-brand grocery store products and restaurant dishes offers encouraging news: When most of these food makers reformulated their products, they cut back on trans fat without increasing saturated fat 67.
If a product contains less than half a gram of trans fat and a half gram of saturated fat per serving, it can still be labeled as “trans fat-free.” So while many products in the United States are labeled “trans fat-free,” those products may still contain a small amount of trans fat.
In June 2015 the FDA announced its decision to ban artificial trans fat in the food supply. Food manufacturers in the U.S. will have three years to remove partially hydrogenated oils — the primary source of artificial trans fat — from products.
While we’re making progress in the United States, trans-fat intake is widely used in some developing nations. Inexpensive partially hydrogenated soybean oil and palm oil have become staples not only for the food industry but also for home use. This shift away from traditional cooking oils and toward trans-rich partially hydrogenated oils is contributing to the growing epidemic of cardiovascular disease in developing nations around the world.
- Mangels R (2001). Guide to nut and nut butters. Vegetarian J XXI:20–23[↩]
- Jiang R, Manson JE, Stampfer MJ, Liu S, Willett WC, Hu FB. Nut and peanut butter consumption and risk of type 2 diabetes in women. J Am Med Assoc. 2002;288:2554–2560. doi: 10.1001/jama.288.20.2554 https://jamanetwork.com/journals/jama/fullarticle/195554[↩]
- Wilkes RS (2012) Nut butter and related products enriched with omega-3. US patent. Publication number: US 2012/0164307 A1[↩]
- https://www.uoguelph.ca/foodscience/[↩]
- Fat content of dairy products, eggs, margarines and oils: implications for atherosclerosis. Scherr C, Ribeiro JP. Arq Bras Cardiol. 2010 Jul; 95(1):55-60. http://www.scielo.br/scielo.php?script=sci_arttext&pid=S0066-782X2010005000074[↩]
- Paleolithic nutrition. A consideration of its nature and current implications. Eaton SB, Konner M. N Engl J Med. 1985 Jan 31; 312(5):283-9. https://www.nejm.org/doi/full/10.1056/NEJM198501313120505[↩]
- Jenkins DJA, Hu FB, Tapsell LC, Josse AR, Kendall CWC. Possible benefit of nuts in type 2 diabetes. J Nutr. 2008;138(9):1752S–1756S. https://www.ncbi.nlm.nih.gov/pubmed/18716181[↩]
- United States Department of Agriculture Agricultural Research Service. National Nutrient Database for Standard Reference Legacy Release. https://ndb.nal.usda.gov/ndb/search/list[↩][↩][↩][↩][↩][↩]
- Gorrepati K, Balasubramanian S, Chandra P. Plant based butters. Journal of Food Science and Technology. 2015;52(7):3965-3976. doi:10.1007/s13197-014-1572-7. https://www.ncbi.nlm.nih.gov/pmc/articles/PMC4486598/[↩]
- Thomas R and Gebhardt S (2010) Sunflower and almond butter as nutrient-rich alternatives to peanut butter. American dietetic association, Food & Nutrition Conference & Expo. Boston, MA.[↩]
- Spiller GA, Miller A, Olivera K, Reynolds J, Miller B, Morse SJ, Dewell A, Farquhar JW. Effects of plant-based diets high in raw or roasted almonds, or roasted almond butter on serum lipoproteins in humans. J Am Coll Nutr. 2003;22(3):195–200. doi: 10.1080/07315724.2003.10719293 https://www.ncbi.nlm.nih.gov/pubmed/12805245[↩][↩]
- Nut and Peanut Butter Consumption and Risk of Type 2 Diabetes in Women. JAMA. 2002;288(20):2554-2560. doi:10.1001/jama.288.20.2554 https://jamanetwork.com/journals/jama/fullarticle/195554[↩]
- Alamprese C, Ratti S, Rossi M. Effects of roasting conditions on hazelnut characteristics in a two-step process. J Food Eng. 2009;95(2):272–279. doi: 10.1016/j.jfoodeng.2009.05.001[↩]
- Shakerardekani A, Karim R, Ghazali HM, Chin NL. Effect of roasting conditions on hardness, moisture content and colour of pistachio kernels. Food Res Int. 2011;18:723–729[↩]
- Pattee HE, Pearson JL, Young CT, Giesbrecht FG. Changes in roasted peanut flavor and other quality factors with seed size and storage time. J Food Sci. 1982;47(2):455–456. doi: 10.1111/j.1365-2621.1982.tb10102.x[↩]
- Ogunsanwo BM, Faboya OOP, Idowu OR, Adewuyi GO. Short communication, using rating to evaluate quality of peanut products. Afr J Biotechnol. 2005;4(12):1469–1471[↩]
- Connick FC (1997) Peanut butter manufacture. US Patent. Patent number: US 4,004,037A.[↩]
- Woodroof JG. Chapter 9, peanut butter. In: Woodroof JG, editor. Peanuts: Production, Processg, Products. 3. Westport: AVI Publishing Co., Inc.; 1983. pp. 181–227[↩]
- Crippen KL, Hamann DD, Young CT. Effects of grind size, sucrose concentration and salt concentration on peanut butter texture. J Texture Stud. 1989;20(1):29–41. doi: 10.1111/j.1745-4603.1989.tb00418.x[↩]
- Dzurik J W, Hair ER, Hardy ME, Purves ER (1971) Peanut butter containing homogenized peanut paste. US patent. Publication number: US 3 619 207A[↩]
- Aryana KJ, Resurreccion AVA, Chinnan MS, Beuchat LR. Microstructure of peanut butter stabilized with palm oil. J Food Process Preserv. 2000;24:229–241. doi: 10.1111/j.1745-4549.2000.tb00415.x[↩]
- Hinds MJ, Chinnan MS and Beuchat LR (1994) Unhydrogenated palm oil as a stabilizer for peanut butter. J Food Sci 59: 816–820 & 832[↩]
- Galvez FCF, Francisco ML, Lustre AO and Resurreccion AVA (2006) Chapter 1, Quality improvement for local unstabilized peanut butter. In: Lustre AO, Francisco ML, Palomar LS & Resurreccion AVA (Eds), Monograph series No.6: Peanut butter and spreads, USA, Philippines, pp 20–47[↩]
- Francisco ML, Galvez FCF, Lustre AO and Resurreccion AVA (2006) Chapter 2, Screening of local stabilizers for Philippine peanut butter. In: Lustre AO, Francisco ML, Palomar LS & Resurreccion AVA (Eds), Monograph series No.6: Peanut butter and spreads, USA, Philippines, pp 48–64[↩][↩]
- Woodroof JG. Chapter 9, peanut butter. In: Woodroof JG, editor. Peanuts: Production, Processg, Products. 3. Westport: AVI Publishing Co., Inc.; 1983. pp. 181–227.[↩]
- Totlani VM, Chinnan MS. Effect of stabilizer levels and storage conditions on texture and viscosity of peanut butter. Peanut Sci. 2007;34(1):1–9. doi: 10.3146/0095-3679(2007)34[1:EOSLAS]2.0.CO;2[↩]
- Aryana KJ, Resurreccion AVA, Chinnan MS, Beuchat LR. Functionality of palm oil as a stabilizer in peanut butter. J Food Sci. 2003;68:1301–1307. doi: 10.1111/j.1365-2621.2003.tb09643.x[↩]
- Gills LA, Resurreccion AVA. Sensory and physical properties of peanut butter treated with palm oil and hydrogenated vegetable oil to prevent oil separation. J Food Sci. 2000;65:173–180. doi: 10.1111/j.1365-2621.2000.tb15975.x[↩]
- Hunter JE and Eck JR (1989) Reduced calorie peanut butter. US patent. Publication number: US 4863753 A[↩]
- Akhtar S, Khalid N, Ahmed I, Shahzad A, Suleria HAR. Physicochemical charecteristics, functional properties, and nutritional benefits of peanut oil: a review. Crit Rev Food Sci Nutr. 2014;54(12):1562–1575. doi: 10.1080/10408398.2011.644353. https://www.ncbi.nlm.nih.gov/pubmed/24580558[↩]
- Hasenhuett GL. Overview of food emulsifiers. In: Hasenhuettl GL, Hartel RW, editors. Food emulsifiers and their applications. 2. New York: Springer; 2008. pp. 1–9.[↩]
- Jenkins DJ, Kendall CW, Marchie A, et al. (2002) Dose response of almonds on coronary heart disease risk factors: blood lipids, oxidized low-density lipoproteins, lipoprotein(a), homocysteine, and pulmonary nitric oxide: a randomized, controlled, crossover trial. Circulation 106, 1327–1332 http://circ.ahajournals.org/content/106/11/1327.long[↩]
- Kris-Etherton PM, Hu FB, Ros E, et al. (2008) The role of tree nuts and peanuts in the prevention of coronary heart disease: multiple potential mechanisms. J Nutr 138, 1746S–1751S https://www.ncbi.nlm.nih.gov/pubmed/18716180[↩]
- Robbins KS, Shin EC, Shewfelt RL, et al. (2011) Update on the healthful lipid constituents of commercially important tree nuts. J Agric Food Chem 59, 12083–12092 https://www.ncbi.nlm.nih.gov/pubmed/21985331[↩]
- Sathe SK, Seeram NP, Kshirsagar HH, et al. (2008) Fatty acid composition of California grown almonds. J Food Sci 73, C607–C614 https://www.ncbi.nlm.nih.gov/pubmed/19021789[↩]
- Sanders TA (2001) Olive oil and the Mediterranean diet. Int J Vitam Nutr Res 71, 179–184 https://www.ncbi.nlm.nih.gov/pubmed/11582840[↩]
- Nishi S, Kendall CWC, Gascoyne A-M, et al. Effect of almond consumption on the serum fatty acid profile: a dose–response study. The British Journal of Nutrition. 2014;112(7):1137-1146. doi:10.1017/S0007114514001640. https://www.ncbi.nlm.nih.gov/pmc/articles/PMC4189119/[↩]
- Spiller GA, Miller A, Olivera K, et al. (2003) Effects of plant-based diets high in raw or roasted almonds, or roasted almond butter on serum lipoproteins in humans. J Am Coll Nutr 22, 195–200 https://www.ncbi.nlm.nih.gov/pubmed/12805245[↩]
- Jenkins DJA, Chiavaroli L, Wong JMW, et al. (2010) Adding monounsaturated fatty acids to a dietary portfolio of cholesterol-lowering foods in hypercholesterolemia. CMAJ 182, 1961–1967 https://www.ncbi.nlm.nih.gov/pmc/articles/PMC3001502/[↩]
- Ros E & Mataix J (2006) Fatty acid composition of nuts – implications for cardiovascular health. Br J Nutr 96, Suppl. 2, S29–S35 https://www.ncbi.nlm.nih.gov/pubmed/17125530[↩]
- Bolling BW, Dolnikowski G, Blumberg JB, et al. (2010) Polyphenol content and antioxidant activity of California almonds depend on cultivar and harvest year. Food Chem 122, 819–825 https://www.ncbi.nlm.nih.gov/pmc/articles/PMC4276397/[↩]
- Kris-Etherton PM, Zhao G, Binkoski AE, et al. (2001) The effects of nuts on coronary heart disease risk. Nutr Rev 59, 103–111 https://www.ncbi.nlm.nih.gov/pubmed/11368503[↩]
- Del Gobbo L.C., Falk M.C., Feldman R., Lewis K., Mozaffarian D. Effects of tree nuts on blood lipids, apolipoproteins, and blood pressure: Systematic review, meta-analysis, and dose-response of 61 controlled intervention trials. Am. J. Clin. Nutr. 2015;102:1347–1356. doi: 10.3945/ajcn.115.110965 https://www.ncbi.nlm.nih.gov/pmc/articles/PMC4658458/[↩]
- Mandalari G., Faulks R.M., Rich G.T., Lo Turco V., Picout D.R., Lo Curto R.B., Bisignano G., Dugo P., Dugo G., Waldron K.W., et al. Release of protein, lipid, and vitamin E from almond seeds during digestion. J. Agric. Food Chem. 2008;56:3409–3416. doi: 10.1021/jf073393v https://www.ncbi.nlm.nih.gov/pubmed/18416553[↩][↩]
- Grassby T., Mandalari G., Grundy M.M., Edwards C.H., Bisignano C., Trombetta D., Smeriglio A., Chessa S., Ray S., Sanderson J., et al. In vitro and in vivo modeling of lipid bioaccessibility and digestion from almond muffins: The importance of the cell-wall barrier mechanism. J. Funct. Foods. 2017;37:263–271. doi: 10.1016/j.jff.2017.07.046 https://www.ncbi.nlm.nih.gov/pmc/articles/PMC5628021/[↩]
- Grundy M.M., Grassby T., Mandalari G., Waldron K.W., Butterworth P.J., Berry S.E., Ellis P.R. Effect of mastication on lipid bioaccessibility of almonds in a randomized human study and its implications for digestion kinetics, metabolizable energy, and postprandial lipemia. Am. J. Clin. Nutr. 2015;101:25–33. doi: 10.3945/ajcn.114.088328 https://www.ncbi.nlm.nih.gov/pmc/articles/PMC4266890/[↩][↩]
- Grassby T., Picout D.R., Mandalari G., Faulks R.M., Kendall C.W., Rich G.T., Wickham M.S., Lapsley K., Ellis P.R. Modelling of nutrient bioaccessibility in almond seeds based on the fracture properties of their cell walls. Food Funct. 2014;5:3096–3106. doi: 10.1039/C4FO00659C https://www.ncbi.nlm.nih.gov/pubmed/25310222[↩]
- Grundy M.M., Wilde P.J., Butterworth P.J., Gray R., Ellis P.R. Impact of cell wall encapsulation of almonds on in vitro duodenal lipolysis. Food Chem. 2015;185:405–412. doi: 10.1016/j.foodchem.2015.04.013 https://www.ncbi.nlm.nih.gov/pmc/articles/PMC4430076/[↩]
- Novotny J.A., Gebauer S.K., Baer D.J. Discrepancy between the Atwater factor predicted and empirically measured energy values of almonds in human diets. Am. J. Clin. Nutr. 2012;96:296–301. doi: 10.3945/ajcn.112.035782 https://www.ncbi.nlm.nih.gov/pmc/articles/PMC3396444/[↩][↩]
- Cassady B.A., Hollis J.H., Fulford A.D., Considine R.V., Mattes R.D. Mastication of almonds: Effects of lipid bioaccessibility, appetite, and hormone response. Am. J. Clin. Nutr. 2009;89:794–800. doi: 10.3945/ajcn.2008.26669 https://www.ncbi.nlm.nih.gov/pubmed/19144727[↩]
- Gebauer S.K., Novotny J.A., Bornhorst G.M., Baer D.J. Food processing and structure impact the metabolizable energy of almonds. Food Funct. 2016;7:4231–4238. doi: 10.1039/C6FO01076H https://www.ncbi.nlm.nih.gov/pubmed/27713968[↩]
- Mozaffarian, D., R. Micha, and S. Wallace, Effects on coronary heart disease of increasing polyunsaturated fat in place of saturated fat: a systematic review and meta-analysis of randomized controlled trials. PLoS Med, 2010. 7(3): p. e1000252.[↩][↩]
- Mensink, R.P., et al., Effects of dietary fatty acids and carbohydrates on the ratio of serum total to HDL cholesterol and on serum lipids and apolipoproteins: a meta-analysis of 60 controlled trials. Am J Clin Nutr, 2003. 77(5): p. 1146-55.[↩]
- Appel, L.J., et al., Effects of protein, monounsaturated fat, and carbohydrate intake on blood pressure and serum lipids: results of the OmniHeart randomized trial. JAMA, 2005. 294(19): p. 2455-64.[↩]
- Dietary Guidelines for Americans. https://health.gov/dietaryguidelines/[↩]
- Lichtenstein, A.H., et al., Diet and lifestyle recommendations revision 2006: a scientific statement from the American Heart Association Nutrition Committee. Circulation, 2006. 114(1): p. 82-96.[↩]
- Institute, N.C., Risk Factor Monitoring and Methods: Table 1. Top Food Sources of Saturated Fat among U.S. Population, 2005–2006. NHANES.[↩]
- Siri-Tarino, P.W., et al., Meta-analysis of prospective cohort studies evaluating the association of saturated fat with cardiovascular disease. Am J Clin Nutr, 2010. 91(3): p. 535-46[↩][↩]
- Astrup, A., et al., The role of reducing intakes of saturated fat in the prevention of cardiovascular disease: where does the evidence stand in 2010? Am J Clin Nutr, 2011. 93(4): p. 684-8.[↩]
- Farvid MS, Ding M, Pan A, Sun Q, Chiuve SE, Steffen LM, Willett WC, Hu FB. Dietary Linoleic Acid and Risk of Coronary Heart Disease: A Systematic Review and Meta-Analysis of Prospective Cohort Studies. Circulation, 2014.[↩]
- Riserus, U., W.C. Willett, and F.B. Hu, Dietary fats and prevention of type 2 diabetes. Prog Lipid Res, 2009. 48(1): p. 44-51.[↩]
- Mozaffarian, D., et al., Trans fatty acids and cardiovascular disease. N Engl J Med, 2006. 354(15): p. 1601-13.[↩]
- Mozaffarian, D., et al., Dietary intake of trans fatty acids and systemic inflammation in women. Am J Clin Nutr, 2004. 79(4): p. 606-12.[↩]
- Riserus, U., W.C. Willett, and F.B. Hu, Dietary fats and prevention of type 2 diabetes. Prog Lipid Res, 2009. 48(1): p. 44-51[↩]
- Allison, D.B., et al., Estimated intakes of trans fatty and other fatty acids in the US population. J Am Diet Assoc, 1999. 99(2): p. 166-74; quiz 175-6.[↩]
- Vesper, H.W., et al., Levels of plasma trans-fatty acids in non-Hispanic white adults in the United States in 2000 and 2009. JAMA, 2012. 307(6): p. 562-3.[↩]
- Mozaffarian, D., M.F. Jacobson, and J.S. Greenstein, Food reformulations to reduce trans fatty acids. N Engl J Med, 2010. 362(21): p. 2037-9.[↩]