Contents
- What is Glycemic Index?
- What Affects the GI of a Food 2 ?
- Low-GI foods in your healthy, balanced diet
- Fruits
- What is the difference between Glycemic Index (GI) and Glycemic Load (GL) ?
- Low Glycaemic Index or Low Glycaemic Load Diets for Weight Loss in Overweight and Obesity
- Benefits of Low Glycaemic Index or Low Glycaemic Load Diets for Diabetes Mellitus
- Low Glycaemic Index Diets for Coronary Heart Disease
- Glycaemic Index Diets and Cancer
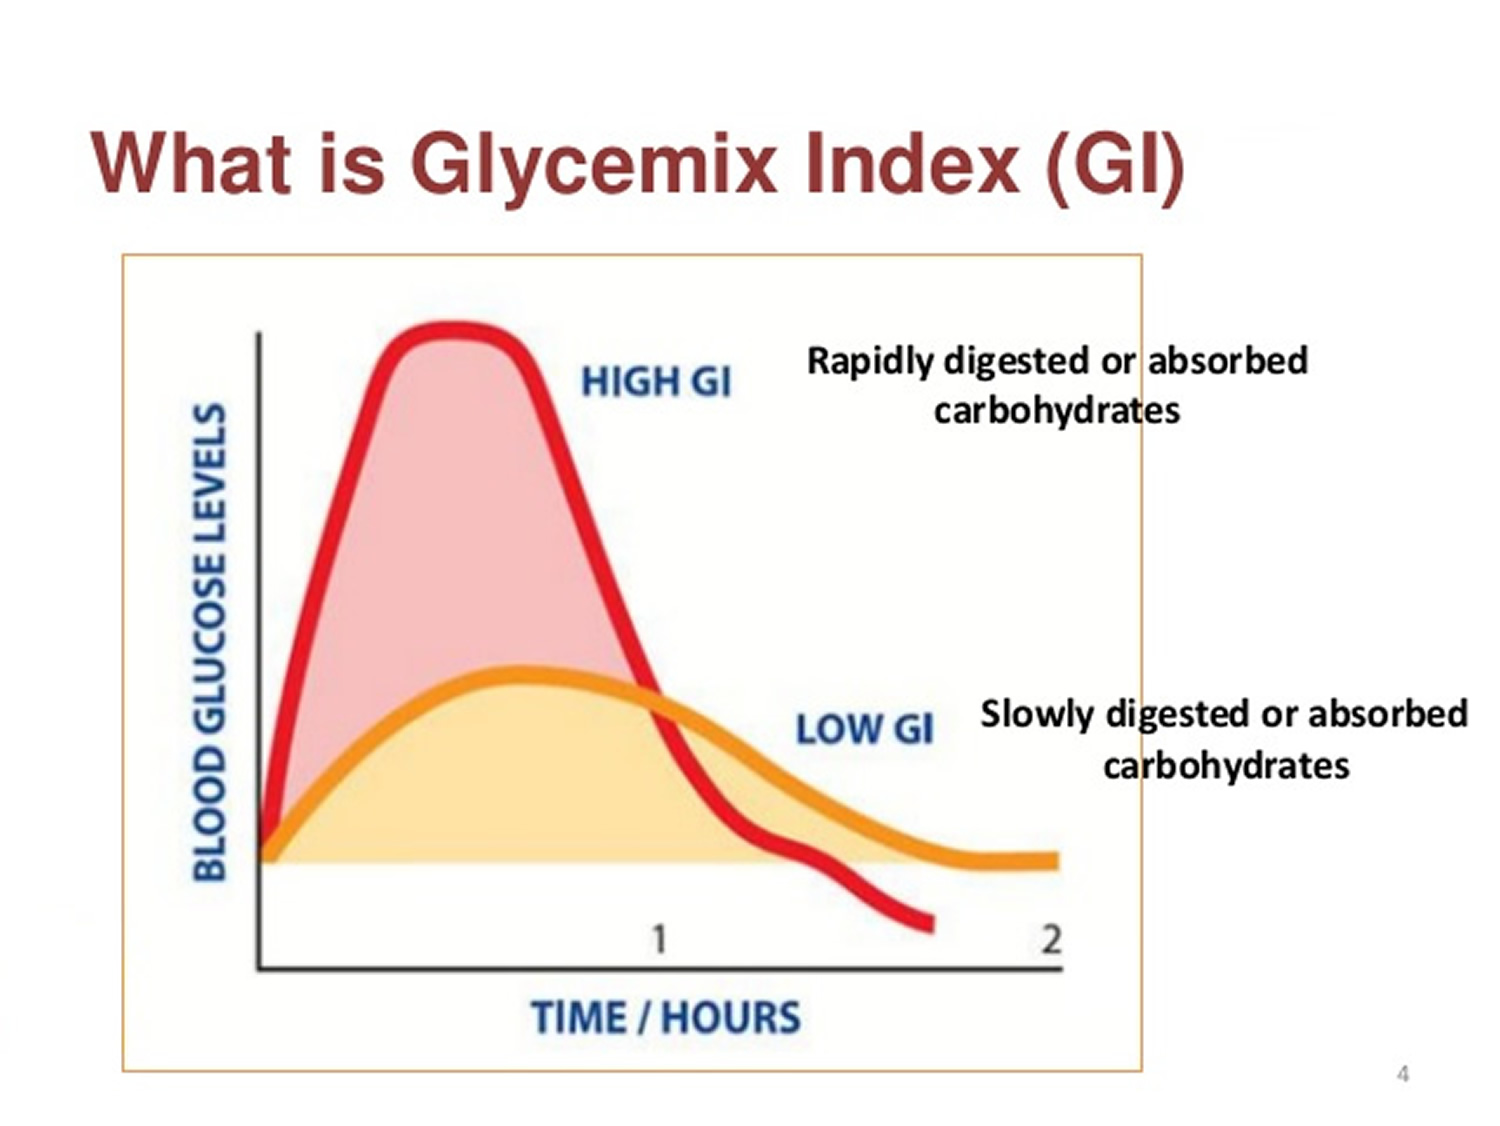
What is Glycemic Index?
Carbohydrate is an essential part of our diets, but not all carbohydrate foods are equal. The glycemic index (GI) was first developed by Jenkins and colleagues 1 and the Glycemic Index (GI) is a relative ranking of carbohydrate in foods according to how they affect blood glucose levels 2. Carbohydrates with a low GI value (55 or less) are more slowly digested, absorbed and metabolised and cause a lower and slower rise in blood glucose and, therefore usually, insulin levels.
Research shows that both the amount and the type of carbohydrate in food affect blood glucose levels. Studies also show that the total amount of carbohydrate in food, in general, is a stronger predictor of blood glucose response than the GI.
The glycemic index or GI ranks carbohydrates according to their effect on blood glucose levels. The lower the GI, the slower the rise in blood glucose levels will be when the food is consumed. The effect may differ from person to person.
Diabetes: There is no one diet or meal plan that works for everyone with diabetes. It is recommended that people with diabetes have moderate amounts of carbohydrate and include high fibre foods that also have a low GI (not all high fibre foods have a low GI). Because the type of carbohydrate can affect blood glucose, using the GI may be helpful in “fine-tuning” blood glucose management. In other words, combined with carbohydrate counting, it may provide an additional benefit for achieving blood glucose goals for individuals who can and want to put extra effort into monitoring their food choices. The amount of carbs you eat has a bigger effect on blood glucose levels than GI alone. For example, pasta has a lower GI than watermelon, but pasta has more carbs than watermelon, so if you eat similar amounts of either of these two foods, the pasta will have more of an impact on your blood glucose levels. The most important thing to do is get your portion size right – once you do this, you will get an added bonus for choosing low-GI alternatives.
Meats and fats don’t have a GI because they do not contain carbohydrate.
Some research has shown that by eating a diet with a lower GI, people with diabetes can reduce their average blood glucose levels. This is important in reducing the risk of developing diabetes-related complications.
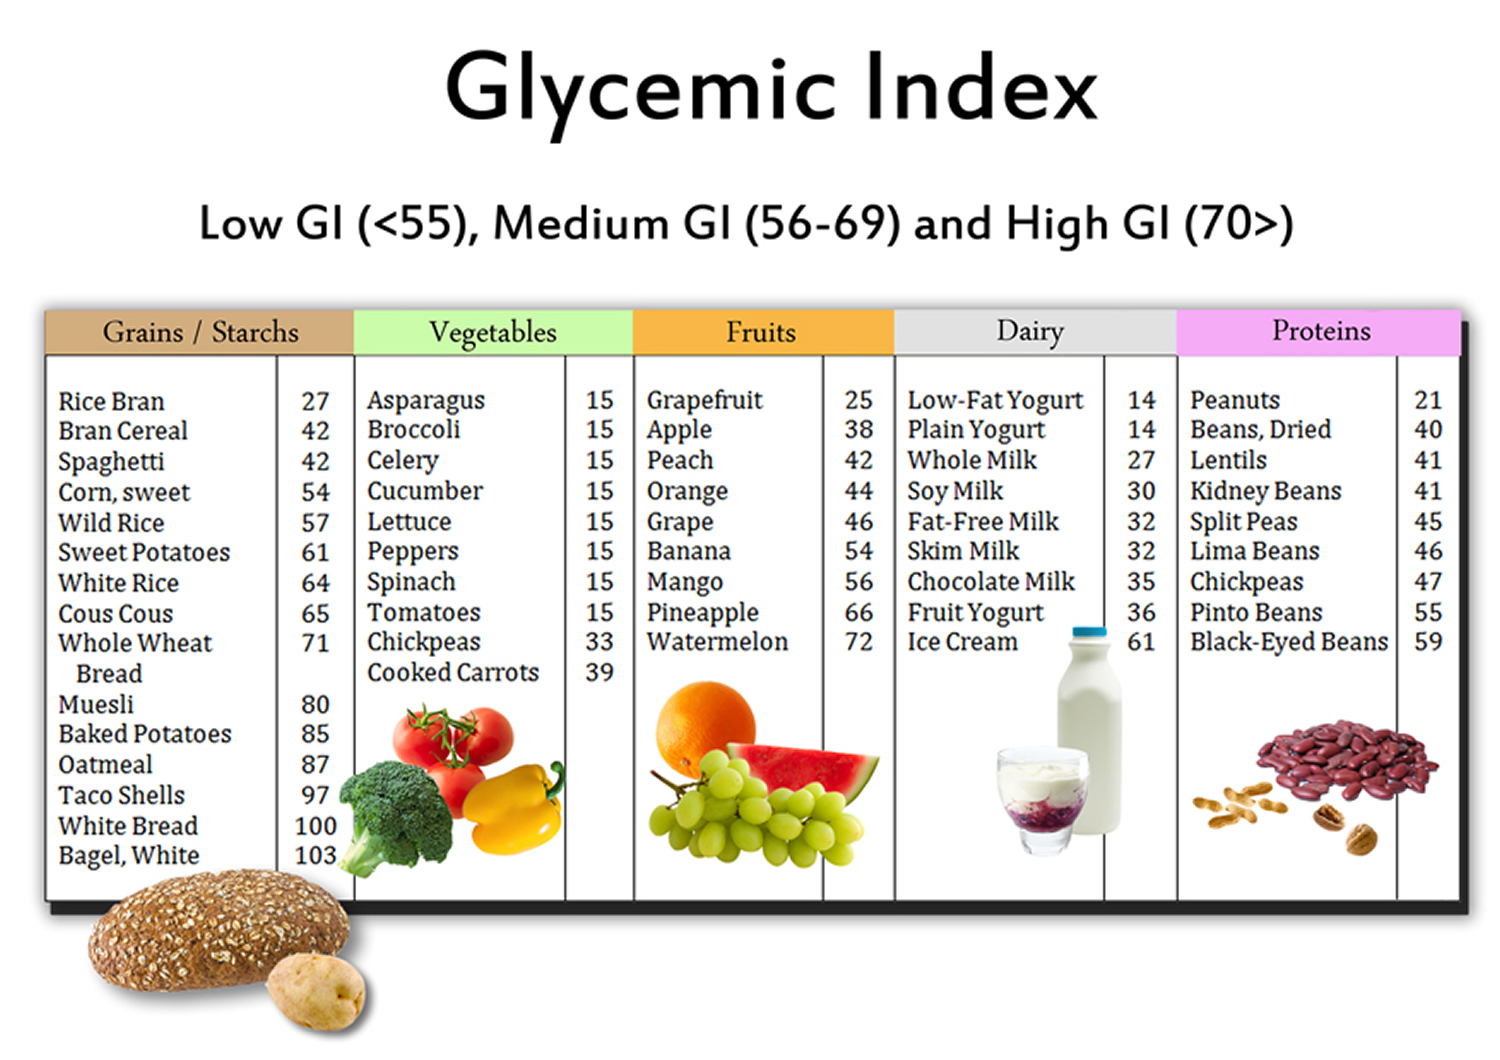
The GI index runs from 0–100 and usually uses glucose, which has a GI of 100, as the reference. Slowly absorbed carbohydrates have a low GI rating (55 or below), and include most fruits and vegetables, milk, some wholegrain cereals and bread, pulses and basmati rice. GI numbers are to be used as a guide only as individual foods do not have the same response in all people with diabetes.
- Low GI foods are foods with a GI less than 55.
- Intermediate GI foods are foods with a GI between 55 and 70.
- High GI foods are foods with a GI greater than 70.
Below are examples of foods based on their GI.
Low GI Foods (55 or less)
- 100% stone-ground whole wheat or pumpernickel bread
- Oatmeal (rolled or steel-cut), oat bran, muesli
- Pasta, converted rice, barley, bulgar
- Sweet potato, corn, yam, lima/butter beans, peas, legumes and lentils
- Most fruits, non-starchy vegetables and carrots
Not all low-GI foods are healthy choices – chocolate, for example, has a low-GI because of its fat content, which slows down the absorption of carbohydrate.
Medium GI (56-69)
- Whole wheat, rye and pita bread
- Quick oats
- Brown, wild or basmati rice, couscous
High GI (70 or more)
- White bread or bagel
- Corn flakes, puffed rice, bran flakes, instant oatmeal
- Shortgrain white rice, rice pasta, macaroni and cheese from mix
- Russet potato, pumpkin
- Pretzels, rice cakes, popcorn, saltine crackers
- melons and pineapple
Table 1. The average GI of 62 common foods derived from multiple studies by different laboratories 3
| High-carbohydrate foods | Breakfast cereals | Fruit and fruit products | Vegetables | ||||
|---|---|---|---|---|---|---|---|
| White wheat bread* | 75 ± 2 | Cornflakes | 81 ± 6 | Apple, raw† | 36 ± 2 | Potato, boiled | 78 ± 4 |
| Whole wheat/whole meal bread | 74 ± 2 | Wheat flake biscuits | 69 ± 2 | Orange, raw† | 43 ± 3 | Potato, instant mash | 87 ± 3 |
| Specialty grain bread | 53 ± 2 | Porridge, rolled oats | 55 ± 2 | Banana, raw† | 51 ± 3 | Potato, french fries | 63 ± 5 |
| Unleavened wheat bread | 70 ± 5 | Instant oat porridge | 79 ± 3 | Pineapple, raw | 59 ± 8 | Carrots, boiled | 39 ± 4 |
| Wheat roti | 62 ± 3 | Rice porridge/congee | 78 ± 9 | Mango, raw† | 51 ± 5 | Sweet potato, boiled | 63 ± 6 |
| Chapatti | 52 ± 4 | Millet porridge | 67 ± 5 | Watermelon, raw | 76 ± 4 | Pumpkin, boiled | 64 ± 7 |
| Corn tortilla | 46 ± 4 | Muesli | 57 ± 2 | Dates, raw | 42 ± 4 | Plantain/green banana | 55 ± 6 |
| White rice, boiled* | 73 ± 4 | Peaches, canned† | 43 ± 5 | Taro, boiled | 53 ± 2 | ||
| Brown rice, boiled | 68 ± 4 | Strawberry jam/jelly | 49 ± 3 | Vegetable soup | 48 ± 5 | ||
| Barley | 28 ± 2 | Apple juice | 41 ± 2 | ||||
| Sweet corn | 52 ± 5 | Orange juice | 50 ± 2 | ||||
| Spaghetti, white | 49 ± 2 | ||||||
| Spaghetti, whole meal | 48 ± 5 | ||||||
| Rice noodles† | 53 ± 7 | ||||||
| Udon noodles | 55 ± 7 | ||||||
| Couscous† | 65 ± 4 |
| Dairy products and alternatives | Legumes | Snack products | Sugars | ||||
|---|---|---|---|---|---|---|---|
| Milk, full fat | 39 ± 3 | Chickpeas | 28 ± 9 | Chocolate | 40 ± 3 | Fructose | 15 ± 4 |
| Milk, skim | 37 ± 4 | Kidney beans | 24 ± 4 | Popcorn | 65 ± 5 | Sucrose | 65 ± 4 |
| Ice cream | 51 ± 3 | Lentils | 32 ± 5 | Potato crisps | 56 ± 3 | Glucose | 103 ± 3 |
| Yogurt, fruit | 41 ± 2 | Soya beans | 16 ± 1 | Soft drink/soda | 59 ± 3 | Honey | 61 ± 3 |
| Soy milk | 34 ± 4 | Rice crackers/crisps | 87 ± 2 | ||||
| Rice milk | 86 ± 7 |
Note: The GI should not be used in isolation; the energy density and macronutrient profile of foods should also be considered 4.
Remember, GI is not a reflection of how healthy a food is.
- Fat content – Foods high in fat often have a low GI (e.g. chocolate or corn chips) and should only be included occasionally.
- The amount of food eaten- a small amount of a high GI food e.g. watermelon may only have a small effect on blood sugar levels.
- The quality of food- always aim to eat a wide range of carbohydrate containing foods including wholegrain breads and cereals, fresh fruit and vegetables and dairy which provide important nutrients and fibre.
The GI value relates to the food eaten on its own and in practice we usually eat foods in combination as meals. Bread, for example is usually eaten with butter or margarine, and potatoes could be eaten with meat and vegetables. Therefore relying solely on the glycemic index of foods could result in eating unbalanced and un-healthy diets high in fat, salt and saturated fats.
An additional problem is that GI compares the glycaemic effect of an amount of food containing 50g of carbohydrate but in real life we eat different amounts of food containing different amounts of carbohydrate.
Note: The amount of carbohydrate you eat has a bigger effect on blood glucose levels than GI alone.
The recommendation is to eat more low and intermediate GI foods, not to exclude high GI foods. By choosing the low glycaemic index foods and thus the minimally processed foods, people can lose more weight, feel fuller longer, and remain healthier.
The GI is only a small part of the healthy eating plan for people with diabetes. For people with diabetes, meal planning with the GI involves choosing foods that have a low or medium GI. If eating a food with a high GI, you can combine it with low GI foods to help balance the meal.
Carbohydrates are an essential nutrient. You need carbs as they break down into glucose in your body providing the
– main fuel for your brains and nervous systems,
– preferred source of fuel for most organs and your muscles during exercise.
Consuming good quality carbohydrates aka Low GI ones help to facilitate the management of diabetes, weight loss and weight loss management and reducing the risk of developing type 2 diabetes, diabetes complications and other chronic lifestyle diseases. In fact a low GI diet provides health benefits for everybody across all stages of life.
A low GI diet is not a fad diet but a way of eating that is sustainable in the long term and backed by over 30 years of scientific evidence.
Recommendations for using GI in your diet
- Aim to include at least 3 low GI foods throughout the day, ideally one with each meal or snack.
- When eating high GI foods, try to combine these with a low GI food in order to decrease the overall GI of a meal.
- Not all the carbohydrates you eat need to be low GI.
What Affects the GI of a Food 2 ?
Fat and fiber tend to lower the GI of a food. As a general rule, the more cooked or processed a food, the higher the GI; however, this is not always true.
Below are a few specific examples of other factors that can affect the GI of a food 5:
- The type of starch present.
- The type of sugar present – fructose (fruit sugar) and lactose (milk sugar) both have a lower GI than sucrose (table sugar).
- Ripeness and storage time — the more ripe a fruit or vegetable is, the higher the GI.
- Processing — juice has a higher GI than whole fruit; mashed potato has a higher GI than a whole baked potato, stone ground whole wheat bread has a lower GI than whole wheat bread.
- Cooking methods — how long a food is cooked (al dente pasta has a lower GI than soft-cooked pasta), frying, boiling and baking. Cooking and processing food will usually increase the GI as there is less work required by the body to break the carbohydrates down.
- Fibre: wholegrains and high-fibre foods act as a physical barrier that slows down the absorption of carbohydrate. This is not the same as ‘wholemeal’, where, even though the whole of the grain is included, it has been ground up instead of left whole. For example, some mixed grain breads that include wholegrains have a lower GI than wholemeal or white bread.
- Fat lowers the GI of a food. For example, chocolate has a medium GI because of it’s fat content, and crisps will actually have a lower GI than potatoes cooked without fat.
- Protein lowers the GI of food. Milk and other diary products have a low GI because they are high in protein and contain fat.
- Adding acidity to the food will lower the GI (e.g. adding lemon juice).
- Variety — converted long-grain white rice has a lower GI than brown rice but short-grain white rice has a higher GI than brown rice.
Low-GI foods in your healthy, balanced diet
It’s easy to include low-GI carbs in everyday meals:
- Choose basmati or easy cook rice, pasta or noodles. Or, try plantain, quinoa or bulgur wheat for a change.
- Eat wholemeal roti and include dhal in your meals.
- Use new potatoes instead of old potatoes – try sweet potatoes for a change.
- Instead of white and wholemeal bread, choose granary, pumpernickel or rye bread.
- Swap frozen chips for pasta or noodles.
- Try porridge, natural muesli or wholegrain breakfast cereals.
Fruits
Most fruits have a low glycemic index (GI) because of their fructose and fiber content. Melons and pineapple have medium GI values as do some dried fruits such as dates, raisins, and sweetened cranberries.
Fruit – all types such as apples, oranges, peaches, bananas, melons. Fruit is a good source of fibre; try to eat the whole fruit rather than drinking the juice. Include at least 2 serves of fruit a day (1 serve = 1 medium piece apple, orange or pear OR 2 small kiwifruit or plums).
The following is a list of common fruits:
- Apples
- Applesauce
- Apricots
- Avocado
- Banana
- Blackberries
- Blueberries
- Cantaloupe
- Cherries
- Dried fruit such as:
- Cherries
- Cranberries
- Dates
- Figs
- Prunes
- Raisins
- Fruit cocktail
- Grapefruit
- Grapes
- Honeydew melon
- Kiwi
- Mango
- Nectarine
- Orange
- Papaya
- Peaches
- Pears
- Pineapple
- Plums
- Raspberries
- Strawberries
- Tangerines
- Watermelon
What is the difference between Glycemic Index (GI) and Glycemic Load (GL) ?
Your blood glucose rises and falls when you eat a meal containing carbs. How high it rises and how long it remains high depends on the quality of the carbohydrates (the GI) and the quantity (the serve size). Glycemic load or GL combines both the quality and quantity of carbohydrate in one ‘number’. It’s the best way to predict blood glucose values of different types and amounts of food.
The formula is:
GL = (GI x available carbohydrate in a 100g serving) divided by 100.
Let’s take a single apple as an example.
It has a GI of 40 and it contains 15 grams of carbohydrate.
GL = 40 x 15/100 = 6 g
What about a small baked potato?
Its GI is 80 and it contains 15 g of carbohydrate.
GL = 80 x 15/100 = 12 g
You can think of GL as the amount of carbohydrate in a food “adjusted” for its glycemic potency.
- Low GL = <10
- Medium GL = 11-19
- High GL = >20
Therefore the Glycemic Load takes into account the amount of carbohydrate consumed and is a more accurate measure of the impact of a food on blood sugars. As a general rule foods that have a low GL usually have a low GI and those with a medium to high GL value almost always have a very high GI value.
Here is an abbreviated chart of the glycemic index and glycemic load, per serving, for more than 100 common foods.
| FOOD | Glycemic index (glucose = 100) | Serving size (grams) | Glycemic load per serving |
| BAKERY PRODUCTS AND BREADS | |||
| Banana cake, made with sugar | 47 | 60 | 14 |
| Banana cake, made without sugar | 55 | 60 | 12 |
| Sponge cake, plain | 46 | 63 | 17 |
| Vanilla cake made from packet mix with vanilla frosting (Betty Crocker) | 42 | 111 | 24 |
| Apple muffin, made with rolled oats and sugar | 44 | 60 | 13 |
| Apple muffin, made with rolled oats and without sugar | 48 | 60 | 9 |
| Waffles, Aunt Jemima® | 76 | 35 | 10 |
| Bagel, white, frozen | 72 | 70 | 25 |
| Baguette, white, plain | 95 | 30 | 14 |
| Coarse barley bread, 80% kernels | 34 | 30 | 7 |
| Hamburger bun | 61 | 30 | 9 |
| Kaiser roll | 73 | 30 | 12 |
| Pumpernickel bread | 56 | 30 | 7 |
| 50% cracked wheat kernel bread | 58 | 30 | 12 |
| White wheat flour bread, average | 75 | 30 | 11 |
| Wonder® bread, average | 73 | 30 | 10 |
| Whole wheat bread, average | 69 | 30 | 9 |
| 100% Whole Grain® bread (Natural Ovens) | 51 | 30 | 7 |
| Pita bread, white | 68 | 30 | 10 |
| Corn tortilla | 52 | 50 | 12 |
| Wheat tortilla | 30 | 50 | 8 |
| BEVERAGES | |||
| Coca Cola® (US formula) | 63 | 250 mL | 16 |
| Fanta®, orange soft drink | 68 | 250 mL | 23 |
| Lucozade®, original (sparkling glucose drink) | 95 | 250 mL | 40 |
| Apple juice, unsweetened | 41 | 250 mL | 12 |
| Cranberry juice cocktail (Ocean Spray®) | 68 | 250 mL | 24 |
| Gatorade, orange flavor (US formula) | 89 | 250 mL | 13 |
| Orange juice, unsweetened, average | 50 | 250 mL | 12 |
| Tomato juice, canned, no sugar added | 38 | 250 mL | 4 |
| BREAKFAST CEREALS AND RELATED PRODUCTS | |||
| All-Bran®, average | 44 | 30 | 9 |
| Coco Pops®, average | 77 | 30 | 20 |
| Cornflakes®, average | 81 | 30 | 20 |
| Cream of Wheat® | 66 | 250 | 17 |
| Cream of Wheat®, Instant | 74 | 250 | 22 |
| Grape-Nuts® | 75 | 30 | 16 |
| Muesli, average | 56 | 30 | 10 |
| Oatmeal, average | 55 | 250 | 13 |
| Instant oatmeal, average | 79 | 250 | 21 |
| Puffed wheat cereal | 80 | 30 | 17 |
| Raisin Bran® | 61 | 30 | 12 |
| Special K® (US formula) | 69 | 30 | 14 |
| GRAINS | |||
| Pearled barley, average | 25 | 150 | 11 |
| Sweet corn on the cob | 48 | 60 | 14 |
| Couscous | 65 | 150 | 9 |
| Quinoa | 53 | 150 | 13 |
| White rice, boiled, type non-specified | 72 | 150 | 29 |
| Quick cooking white basmati | 63 | 150 | 26 |
| Brown rice, steamed | 50 | 150 | 16 |
| Parboiled Converted white rice (Uncle Ben’s®) | 38 | 150 | 14 |
| Whole wheat kernels, average | 45 | 50 | 15 |
| Bulgur, average | 47 | 150 | 12 |
| COOKIES AND CRACKERS | |||
| Graham crackers | 74 | 25 | 13 |
| Vanilla wafers | 77 | 25 | 14 |
| Shortbread | 64 | 25 | 10 |
| Rice cakes, average | 82 | 25 | 17 |
| Rye crisps, average | 64 | 25 | 11 |
| Soda crackers | 74 | 25 | 12 |
| DAIRY PRODUCTS AND ALTERNATIVES | |||
| Ice cream, regular, average | 62 | 50 | 8 |
| Ice cream, premium (Sara Lee®) | 38 | 50 | 3 |
| Milk, full-fat, average | 31 | 250 mL | 4 |
| Milk, skim, average | 31 | 250 mL | 4 |
| Reduced-fat yogurt with fruit, average | 33 | 200 | 11 |
| FRUITS | |||
| Apple, average | 36 | 120 | 5 |
| Banana, raw, average | 48 | 120 | 11 |
| Dates, dried, average | 42 | 60 | 18 |
| Grapefruit | 25 | 120 | 3 |
| Grapes, black | 59 | 120 | 11 |
| Oranges, raw, average | 45 | 120 | 5 |
| Peach, average | 42 | 120 | 5 |
| Peach, canned in light syrup | 52 | 120 | 9 |
| Pear, raw, average | 38 | 120 | 4 |
| Pear, canned in pear juice | 44 | 120 | 5 |
| Prunes, pitted | 29 | 60 | 10 |
| Raisins | 64 | 60 | 28 |
| Watermelon | 72 | 120 | 4 |
| BEANS AND NUTS | |||
| Baked beans | 40 | 150 | 6 |
| Black-eyed peas | 50 | 150 | 15 |
| Black beans | 30 | 150 | 7 |
| Chickpeas | 10 | 150 | 3 |
| Chickpeas, canned in brine | 42 | 150 | 9 |
| Navy beans, average | 39 | 150 | 12 |
| Kidney beans, average | 34 | 150 | 9 |
| Lentils | 28 | 150 | 5 |
| Soy beans, average | 15 | 150 | 1 |
| Cashews, salted | 22 | 50 | 3 |
| Peanuts | 13 | 50 | 1 |
| PASTA and NOODLES | |||
| Fettucini | 32 | 180 | 15 |
| Macaroni, average | 50 | 180 | 24 |
| Macaroni and Cheese (Kraft®) | 64 | 180 | 33 |
| Spaghetti, white, boiled, average | 46 | 180 | 22 |
| Spaghetti, white, boiled 20 min | 58 | 180 | 26 |
| Spaghetti, whole-grain, boiled | 42 | 180 | 17 |
| SNACK FOODS | |||
| Corn chips, plain, salted | 42 | 50 | 11 |
| Fruit Roll-Ups® | 99 | 30 | 24 |
| M & M’s®, peanut | 33 | 30 | 6 |
| Microwave popcorn, plain, average | 65 | 20 | 7 |
| Potato chips, average | 56 | 50 | 12 |
| Pretzels, oven-baked | 83 | 30 | 16 |
| Snickers Bar®, average | 51 | 60 | 18 |
| VEGETABLES | |||
| Green peas | 54 | 80 | 4 |
| Carrots, average | 39 | 80 | 2 |
| Parsnips | 52 | 80 | 4 |
| Baked russet potato | 111 | 150 | 33 |
| Boiled white potato, average | 82 | 150 | 21 |
| Instant mashed potato, average | 87 | 150 | 17 |
| Sweet potato, average | 70 | 150 | 22 |
| Yam, average | 54 | 150 | 20 |
| MISCELLANEOUS | |||
| Hummus (chickpea salad dip) | 6 | 30 | 0 |
| Chicken nuggets, frozen, reheated in microwave oven 5 min | 46 | 100 | 7 |
| Pizza, plain baked dough, served with parmesan cheese and tomato sauce | 80 | 100 | 22 |
| Pizza, Super Supreme (Pizza Hut®) | 36 | 100 | 9 |
| Honey, average | 61 | 25 | 12 |
The complete list of the glycemic index and glycemic load for more than 1,000 foods can be found in the article “International tables of glycemic index and glycemic load values: 2008” by Fiona S. Atkinson, Kaye Foster-Powell, and Jennie C. Brand-Miller in the December 2008 issue of Diabetes Care, Vol. 31, number 12, pages 2281-2283 6.
Low Glycaemic Index or Low Glycaemic Load Diets for Weight Loss in Overweight and Obesity
To assess the effects of low glycaemic index or low glycemic load diets for weight loss in overweight or obese people. Six eligible randomised controlled trials (total of 202 participants) comparing a low glycaemic index or low glycemic load diet (LGI) with a higher glycaemic index or load diet or other diet (Cdiet) in overweight or obese people, were reviewed 7. The dietary interventions ranged from five weeks to six months duration with up to six months follow-up after the intervention ceased. The decrease in body mass (-1.1 kg) and body mass index (BMI) -1.3 was significantly greater in participants receiving low glycaemic index or load diets compared to higher glycaemic index or load diets. The decrease in total cholesterol was significantly greater with low glycaemic index or load diets compared to higher glycaemic index or load diets (-0.22 mmol/L), as was the change in LDL-cholesterol (-0.24 mmol/L). No study reported adverse effects, mortality or quality of life data. The authors concluded, overweight or obese people on low glycaemic index or low glycemic load diets lost more weight and had more improvement in lipid profiles than those receiving higher glycaemic index or load diets. Body mass, total fat mass, body mass index, total cholesterol and LDL-cholesterol all decreased significantly more in the low glycaemic index or low glycemic load diets group. In studies comparing ad libitum low glycaemic index or low glycemic load diets to conventional restricted energy low-fat diets, participants fared as well or better on the low glycaemic index or low glycemic load diet, even though they could eat as much as desired. Lowering the glycaemic load of the diet appears to be an effective method of promoting weight loss and improving lipid profiles and can be simply incorporated into a person’s lifestyle. Further research with longer term follow-up will determine whether improvement continues long-term and improves quality of life 7.
In a large European study looked at the role of protein and glycemic index upon weight loss maintenance 8. Researchers first implemented a very low-calorie diet to produce weight loss, then examined whether protein and glycemic index impacted weight loss maintenance. The study involving 1209 overweight adults (average age 41 years) with a body mass index (BMI) of 34. The study population was made up of 938 overweight adults from European countries who were randomly entered into one of the 4 low-calorie-diet phase plus 1 control diet of the study groups over a 26-week period, a low-calorie diet consisting of:
- a Low-Protein and Low-Glycemic-index diet;
- a Low-Protein and High-Glycemic-index diet;
- a High-protein and Low-Glycemic-index diet;
- a High-protein and High-Glycemic-index diet;
- or a Control diet.
The results 8, fewer participants in the high-protein and the low-glycemic-index groups than in the low-protein–high-glycemic-index group dropped out of the study (26.4% and 25.6%, respectively, vs. 37.4%). The mean initial weight loss with the low-calorie diet was 11.0 kg (at least 8% of their initial body weight). In the analysis of participants who completed the study, only the low-protein–high-glycemic-index diet was associated with subsequent significant weight regain (1.67 kg). The weight regain was 0.93 kg less in the groups assigned to a high-protein diet than in those assigned to a low-protein diet and 0.95 kg less in the groups assigned to a low-glycemic-index diet than in those assigned to a high-glycemic-index diet.
In conclusion, these results show that a modest increase in protein content (high-protein diet) and a modest reduction in the glycemic index (low-glycemic-index diet) led to an improvement in study completion and maintenance of weight loss 8.
Benefits of Low Glycaemic Index or Low Glycaemic Load Diets for Diabetes Mellitus
There is consensus that diets low in GI and GL were relevant to the prevention and management of diabetes and coronary heart disease, and probably obesity. Moderate to weak associations were observed for selected cancers 9.
To assess the effects of low glycaemic index or low glycaemic load, diets on glycaemic control in people with diabetes, eleven relevant randomised controlled trials, lasting 1 to 12 months, involving 402 participants were analysed 10.
There was a significant decrease in the glycated haemoglobin A1c (HbA1c) -0.5%. Episodes of hypoglycaemia were significantly fewer with low glycaemic index or low glycaemic load compared to high GI diet in one trial (difference of -0.8 episodes per patient per month), and proportion of participants reporting more than 15 hyperglycaemic episodes per month was lower for low-GI diet compared to measured carbohydrate exchange diet in another study (35% versus 66%). No study reported on mortality, morbidity or costs. The review authors concluded a low-GI diet can improve glycaemic control in diabetes without compromising hypoglycaemic events 10. This result is consistent with another smaller trial involving eight type 2 diabetes mellitus patients who were given carbohydrate foods with either a high or low glycemic index over a 2 weeks period 11.
Although a majority of studies show a positive correlation between high glycemic foods and type two diabetes, several studies disagree with these findings. Meyer et al. 12 found that glycemic index had no effect on the prevalence of type 2 diabetes in older aged women. However, there was a strong inverse relationship between dietary fiber intake and type 2 diabetes when adjusted for age and BMI. Women consuming an average of 26 g/day of dietary fiber had a 22% lower risk of developing diabetes when compared to women only consuming 13 g/d. Schulze et al. 13 agreed with these findings with men and women showing a decreased risk of diabetes with the consumption of an additional 12 g of dietary fiber per day. According to these findings, it may be more significant to focus on an increased consumption of dietary fiber to prevent diabetes than glycemic index/load. It is also important to note that the inverse relationship between dietary fiber and diabetes observed by Meyer et al. 14 and Schulze et al. 13 was independent of age and body weight. Hu et al. 15 supported these findings while correcting for age, fat intake, smoking, alcohol, family history, exercise, and body weight. Therefore, it seems that dietary fiber is associated with type two diabetes, independent of other compounding factors.
According to recent research, the soluble versus insoluble fraction of fiber may give some insight on the efficacy of dietary fiber on diabetes and its mechanisms. Although some studies have been contradictory, showing no differentiation between soluble and insoluble fiber on diabetes 13, a majority of the research demonstrates a strong inverse relationship between insoluble fiber and the risk of type two diabetes. Meyer et al. 12 using healthy middle aged women, observed a strong inverse relationship between insoluble fiber and the risk of type two diabetes while soluble fiber had no effect. Montonen et al. 16 also found the same results in healthy middle aged men and women consuming increased levels of whole rye bread. Interestingly, fiber from fruits and vegetables had no effect on the risk of developing type two diabetes. Earlier studies have agreed with these findings. A large epidemiological study of 42,000 men found that dietary fiber from fruits or vegetables had no effect on the risk of diabetes. However, dietary fiber from whole cereal grains showed a significant decrease in diabetes occurrence 17. Daily intakes of fiber among all groups were similar.
Insoluble fiber only has a small effect on macronutrient absorption 18. Therefore, another mode of action must be present and several hypotheses should be discussed. Some suggest that insoluble fiber increases the passage rate of foodstuff through the gastrointestinal tract thus resulting in a decreased absorption of nutrients, namely simple carbohydrates. However, Weicket et al. 19 found that an increased intake of cereal fiber significantly improved whole body glucose disposal resulting in an 8% improvement of insulin sensitivity. This suggests that the mechanisms behind insoluble fiber are more peripheral and not limited to nutrient absorption. First, an accelerated secretion of glucose-dependent insulintropic polypeptide was observed directly after the ingestion of an insoluble fiber in healthy women 20. Glucose-dependent insulintropic polypeptide is an incretin hormone which stimulates postprandial insulin release. Second, insoluble fiber can result in a reduced appetite and food intake 21. This may lead to a decreased caloric intake and BMI. Third, short chain fatty acids, via fermentation, have been shown to reduce postpandrial glucose response 22, 23. Early research demonstrated that lipid infusions impaired glucose utilization 24 and oral acetate could decrease free fatty acids in the blood 25. According to Kelley and Mandarino 26, increases in free fatty acid in the blood can inhibit glucose metabolism through the inhibition of GLUT 4 transporters. Therefore, short chain fatty acids, by way of decreasing serum free fatty acids, may reduce blood glucose levels through competition in insulin–sensitive tissues.
Low Glycaemic Index Diets for Coronary Heart Disease
Currently there is no evidence from randomised clinical trials to show an effect of low glycaemic index (low GI) diets on coronary heart disease 27. Weak evidence for minor effects on some coronary heart disease risk factors (weak evidence of slightly lower total cholesterol with low glycaemic index diets. However, when only studies on diabetics were included in the analysis, no evidence of an effect on total cholesterol was found) was found. Many of the trials identified were short-term, of poor quality and did not have sufficient power to detect clinically important differences. The combined evidence from the studies suggests that any beneficial effect of low glycaemic index diets on coronary heart disease and its risk factors is small. There is a need for well designed, adequately powered, randomised controlled studies, of greater than 12 weeks duration to assess the true effects of low glycaemic index diets for coronary heart disease.
In a systematic meta-analysis review 28 of available randomised controlled trials data on the effect of low glycemic index diets on blood lipids over at least 4 weeks. This meta-analysis 28 provides consistent evidence that low glycemic index diets reduce total and LDL-cholesterol and have no effect on HDL-cholesterol or triglycerides.
Glycaemic Index Diets and Cancer
In a study to find out if higher carbohydrate intake, glycaemic index (GI) and glycaemic load (GL) could increase your risk of developing cancer 29. Researchers reviewed the data from 3184 Caucasian American adults, what they found was that carbohydrate intake was not associated with risk of adiposity-related cancers combined or prostate and colorectal cancers 29. Furthermore, high-, medium- and low-GI foods were not associated with risk of adiposity-related cancers or prostate and colorectal cancers. Moreover, they also found that consuming healthier low-GI foods, were associated with 49 % lower breast cancer risk 29.
- Glycemic index of foods: a physiological basis for carbohydrate exchange. Jenkins DJ, Wolever TM, Taylor RH, Barker H, Fielden H, Baldwin JM, Bowling AC, Newman HC, Jenkins AL, Goff DV. Am J Clin Nutr. 1981 Mar; 34(3):362-6. https://www.ncbi.nlm.nih.gov/pubmed/6259925/[↩]
- American Diabetes Association. Glycemic Index and Diabetes. http://www.diabetes.org/food-and-fitness/food/what-can-i-eat/understanding-carbohydrates/glycemic-index-and-diabetes.html[↩][↩]
- Atkinson FS, Foster-Powell K, Brand-Miller JC. International Tables of Glycemic Index and Glycemic Load Values: 2008 . Diabetes Care. 2008;31(12):2281-2283. doi:10.2337/dc08-1239. https://www.ncbi.nlm.nih.gov/pmc/articles/PMC2584181/[↩]
- FAO/WHO scientific update on carbohydrates in human nutrition: conclusions. Mann J, Cummings JH, Englyst HN, Key T, Liu S, Riccardi G, Summerbell C, Uauy R, van Dam RM, Venn B, Vorster HH, Wiseman M. Eur J Clin Nutr. 2007 Dec; 61 Suppl 1:S132-7. https://www.ncbi.nlm.nih.gov/pubmed/17992184/[↩]
- Glycemic Index International Database, University of Sydney. http://www.glycemicindex.com[↩]
- Diabetes Care 2008 Dec; 31(12): 2281-2283. https://doi.org/10.2337/dc08-1239. International Tables of Glycemic Index and Glycemic Load Values: 2008. http://care.diabetesjournals.org/content/31/12/2281.full[↩]
- Cochrane Review 18 July 2007. Low glycaemic index or low glycaemic load diets for overweight and obesity. http://www.cochrane.org/CD005105/ENDOC_low-glycaemic-index-or-low-glycaemic-load-diets-for-overweight-and-obesity[↩][↩]
- N Engl J Med. 2010 Nov 25; 363(22): 2102–2113. doi: 10.1056/NEJMoa1007137. Diets with High or Low Protein Content and Glycemic Index for Weight-Loss Maintenance. https://www.ncbi.nlm.nih.gov/pmc/articles/PMC3359496/[↩][↩][↩]
- Nutrition, Metabolism and Cardiovascular Diseases, 2015-09-01, Volume 25, Issue 9, Pages 795-815. https://www.clinicalkey.com.au/#!/content/playContent/1-s2.0-S0939475315001271[↩]
- Cochrane Review 21 January 2009. Low glycaemic index, or low glycaemic load, diets for diabetes mellitus. http://www.cochrane.org/CD006296/ENDOC_low-glycaemic-index-or-low-glycaemic-load-diets-for-diabetes-mellitus[↩][↩]
- Am J Clin Nutr. 1988 Aug;48(2):248-54. Low-glycemic-index starchy foods in the diabetic diet. https://www.ncbi.nlm.nih.gov/pubmed/3407604[↩]
- Carbohydrates, dietary fiber, and incident type 2 diabetes in older women. Meyer KA, Kushi LH, Jacobs DR Jr, Slavin J, Sellers TA, Folsom AR. Am J Clin Nutr. 2000 Apr; 71(4):921-30. https://www.ncbi.nlm.nih.gov/pubmed/10731498/[↩][↩]
- Glycemic index, glycemic load, and dietary fiber intake and incidence of type 2 diabetes in younger and middle-aged women. Schulze MB, Liu S, Rimm EB, Manson JE, Willett WC, Hu FB. Am J Clin Nutr. 2004 Aug; 80(2):348-56. https://www.ncbi.nlm.nih.gov/pubmed/15277155/[↩][↩][↩]
- Carbohydrates, dietary fiber, and incident type 2 diabetes mellitus in older women. Meyer KA, Kushi LH, Jacobs DR Jr, Slavin J, Sellers TA, Folsom AR. Am J Clin Nutr. 2000 Apr; 71(4):921-30. https://www.ncbi.nlm.nih.gov/pubmed/10731498/[↩]
- Diet, lifestyle, and the risk of type 2 diabetes mellitus in women. Hu FB, Manson JE, Stampfer MJ, Colditz G, Liu S, Solomon CG, Willett WC. N Engl J Med. 2001 Sep 13; 345(11):790-7. https://www.ncbi.nlm.nih.gov/pubmed/11556298/[↩]
- Whole-grain and fiber intake and the incidence of type 2 diabetes. Montonen J, Knekt P, Järvinen R, Aromaa A, Reunanen A. Am J Clin Nutr. 2003 Mar; 77(3):622-9. https://www.ncbi.nlm.nih.gov/pubmed/12600852/[↩]
- Dietary fiber, glycemic load, and risk of NIDDM in men. Salmerón J, Ascherio A, Rimm EB, Colditz GA, Spiegelman D, Jenkins DJ, Stampfer MJ, Wing AL, Willett WC. Diabetes Care. 1997 Apr; 20(4):545-50. https://www.ncbi.nlm.nih.gov/pubmed/9096978/[↩]
- Dietary fibres, fibre analogues, and glucose tolerance: importance of viscosity. Jenkins DJ, Wolever TM, Leeds AR, Gassull MA, Haisman P, Dilawari J, Goff DV, Metz GL, Alberti KG. Br Med J. 1978 May 27; 1(6124):1392-4. https://www.ncbi.nlm.nih.gov/pubmed/647304/[↩]
- Metabolic effects of dietary fiber consumption and prevention of diabetes. Weickert MO, Pfeiffer AF. J Nutr. 2008 Mar; 138(3):439-42. https://www.ncbi.nlm.nih.gov/pubmed/18287346/[↩]
- Impact of cereal fibre on glucose-regulating factors. Weickert MO, Mohlig M, Koebnick C, Holst JJ, Namsolleck P, Ristow M, Osterhoff M, Rochlitz H, Rudovich N, Spranger J, Pfeiffer AF. Diabetologia. 2005 Nov; 48(11):2343-53. https://www.ncbi.nlm.nih.gov/pubmed/16172868/[↩]
- Insoluble cereal fiber reduces appetite and short-term food intake and glycemic response to food consumed 75 min later by healthy men. Samra RA, Anderson GH. Am J Clin Nutr. 2007 Oct; 86(4):972-9. https://www.ncbi.nlm.nih.gov/pubmed/17921373/[↩]
- Effect of neutralized and native vinegar on blood glucose and acetate responses to a mixed meal in healthy subjects. Brighenti F, Castellani G, Benini L, Casiraghi MC, Leopardi E, Crovetti R, Testolin G. Eur J Clin Nutr. 1995 Apr; 49(4):242-7. https://www.ncbi.nlm.nih.gov/pubmed/7796781/[↩]
- Barley bread containing lactic acid improves glucose tolerance at a subsequent meal in healthy men and women. Ostman EM, Liljeberg Elmståhl HG, Björck IM. J Nutr. 2002 Jun; 132(6):1173-5. https://www.ncbi.nlm.nih.gov/pubmed/12042429/[↩]
- Effect of fatty acids on glucose production and utilization in man. Ferrannini E, Barrett EJ, Bevilacqua S, DeFronzo RA. J Clin Invest. 1983 Nov; 72(5):1737-47. https://www.ncbi.nlm.nih.gov/pubmed/6138367/[↩]
- Role of acetate in the reduction of plasma free fatty acids produced by ethanol in man. Crouse JR, Gerson CD, DeCarli LM, Lieber CS. J Lipid Res. 1968 Jul; 9(4):509-12. https://www.ncbi.nlm.nih.gov/pubmed/5725882/[↩]
- Fuel selection in human skeletal muscle in insulin resistance: a reexamination. Kelley DE, Mandarino LJ. Diabetes. 2000 May; 49(5):677-83. https://www.ncbi.nlm.nih.gov/pubmed/10905472/[↩]
- Cochrane Review 18 October 2004. Low glycaemic index diets for coronary heart disease. http://www.cochrane.org/CD004467/VASC_low-glycaemic-index-diets-for-coronary-heart-disease[↩]
- Nutr Metab Cardiovasc Dis. 2013 Jan;23(1):1-10. doi: 10.1016/j.numecd.2012.06.002. Epub 2012 Jul 25. Low glycaemic index diets and blood lipids: a systematic review and meta-analysis of randomised controlled trials. https://www.ncbi.nlm.nih.gov/pubmed/22841185[↩][↩]
- British Journal of Nutrition Volume 117, Issue 11, June 2017, pp. 1603-1614. Carbohydrate nutrition and risk of adiposity-related cancers: results from the Framingham Offspring cohort (1991–2013). https://www.cambridge.org/core/journals/british-journal-of-nutrition/article/carbohydrate-nutrition-and-risk-of-adiposityrelated-cancers-results-from-the-framingham-offspring-cohort-19912013/FABC2997829AF7BE2ABF6EC0E21694AE[↩][↩][↩]
