
Contents
- What is the Rosemary Conley diet
- Rosemary Conley Diet reviews
- Macro and micro-nutrient composition of diet at baseline
- Alteration in fat intake
- Macronutrient changes
- Changes in micronutrients
- Dietary fiber and fruit and vegetable intake
- Weight and fat loss
- Analysis of diet programmes completers
- Cardiac risk factors
- Compliance with the diets
- Withdrawal from diet programmes
- Follow-up at 12 months
- Conclusions
- Rosemary Conley Diet reviews
What is the Rosemary Conley diet
Rosemary Conley’s “Eat Yourself Slim” Diet and Fitness Plans (a low fat diet combined with a weekly group exercise class) combine a low-fat, low-GI diet with regular exercise 1. You can follow her recipes or her various diets and fitness programmes. The Rosemary Conley’s diet recommends participants choose foods with less than a 4% fat content, with the exception of oily fish, porridge oats and lean meat. In contrast, protein energy increased by 4%, carbohydrate rose by 8%. There was no significant change in % energy derived from alcohol. Overall there was a fall of 37% in mean daily energy intake. Her online weight loss club has a range of tools and videos covering cooking classes, medical, psychological and nutritional advice, plus exercises for all fitness levels. There is also support and motivation from trained coaches. You learn about calorie counting and portion size, which can help you sustain your weight loss beyond the programme. The diets are designed to help you lose a stone in seven weeks and encourage lifestyle change. How long you stay on the plan depends on your weight loss goal.
Rosemary Conley Diet reviews
‘Diet Trials’ 2, a large UK multi-site unblinded randomized controlled study was designed to compare the relative efficacy of four commercial weight loss programmes on weight and body fat loss and the primary outcomes of this study have recently been published. The diets were chosen as being representative of the major different approaches to weight management available in the UK: the Slim-Fast Plan (a meal replacement approach), Weight Watchers Pure Points Programme (an energy controlled diet with weekly group meetings), Dr Atkins’ New Diet Revolution (a low carbohydrate eating plan) and Rosemary Conley’s “Eat Yourself Slim” Diet & Fitness Plan (a low fat diet combined with a weekly group exercise class). All diets resulted in significant loss of body fat and weight over six months. Groups did not differ significantly but loss of body fat and weight was greater in all groups compared with the control group 2. In an intention to treat analysis, average weight loss was 5.9 kg and average fat loss was 4.4 kg over six months 2. The Atkins diet resulted in significantly higher weight loss during the first four weeks, but by the end was no more or less effective than the other diets 2.
Macro and micro-nutrient composition of diet at baseline
At baseline the average % of energy from macronutrients comprised of 42% carbohydrate, 37% fat, 16% protein, 5% alcohol for the whole cohort. In terms of fat content, the average baseline diet contained 30.8 g saturated fat, 14.8 g polyunsaturated and 28.4 g monounsaturated fat. All micronutrient intakes exceeded their respective reference nutrient intake values with the exception of potassium where the average intake was 95% reference nutrient intake. There were no significant differences between the baseline diets in terms of macro, micro-nutrient or % energy derived from alcohol. Therefore, all data presented are changes for each diet group from baseline measurement.
Alteration in fat intake
Of interest in this analysis, is the effect of the different dietary programmes on the type and amount of fat intake and in particular differences between the low carbohydrate and low fat diets (Weight Watchers and Rosemary Conley). Change in dietary fat intake was calculated from baseline to 8 weeks in terms of absolute intake (g/day), see Figure 1. This shows that although there was a proportional increase in % energy from fat in the Atkins dieters, there were no significant changes in absolute intake of fat per day or in the quantity of saturated fat consumed. It should be noted, the amount of saturated fat consumed fell significantly on all the other diets and also in the control group.
Figure 1. Change in fat (g/day) between baseline and 2 months for those following the Atkins, Weight Watchers, Rosemary Conley and Slimfast diets
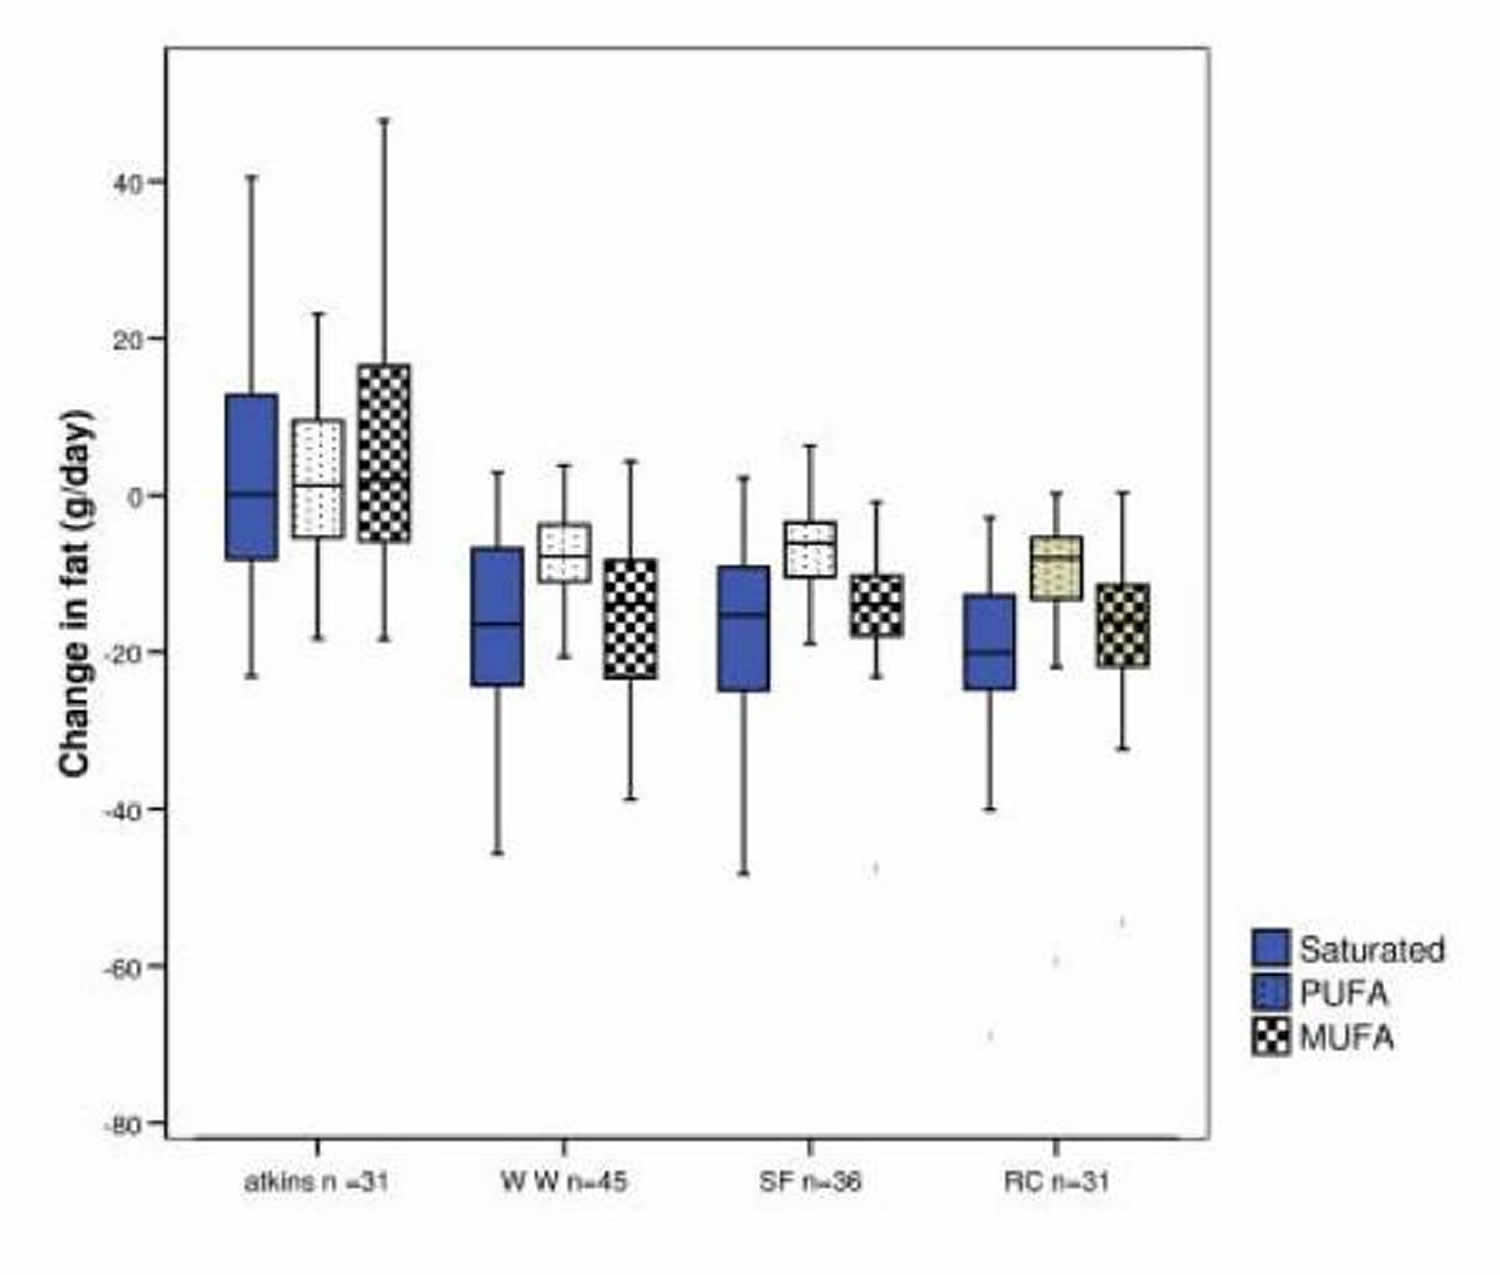
WW= Weight Watchers; SF = Slim Fast; RC= Rosemary Conley
[Source 1]Macronutrient changes
Alteration of energy intake across all diet groups was apparent over the study period with significant falls in total energy intake and energy intake/kg/body weight recorded. This was mirrored by analysis of the ‘plausible reporters’ sub-group which showed a significant reduction in energy intake (kJ/kg/day) between baseline and two months, with significant differences between control and all active diet groups. These falls in energy intake are substantiated by the physiological measures of weight loss. In summary, the mean weight losses (kg) over the 2 month study were as follows: Atkins 5.2 kg, Weight Watchers 4.7 kg, Slim-Fast 3.7 kg, Rosemary Conley 4.0 kg, Control 0.4 kg, with all diet groups being significantly greater than control but there were no differences between active diet groups.
Figure 2. Alteration in percentage of energy from macronutrients from baseline and after 8 weeks of dieting
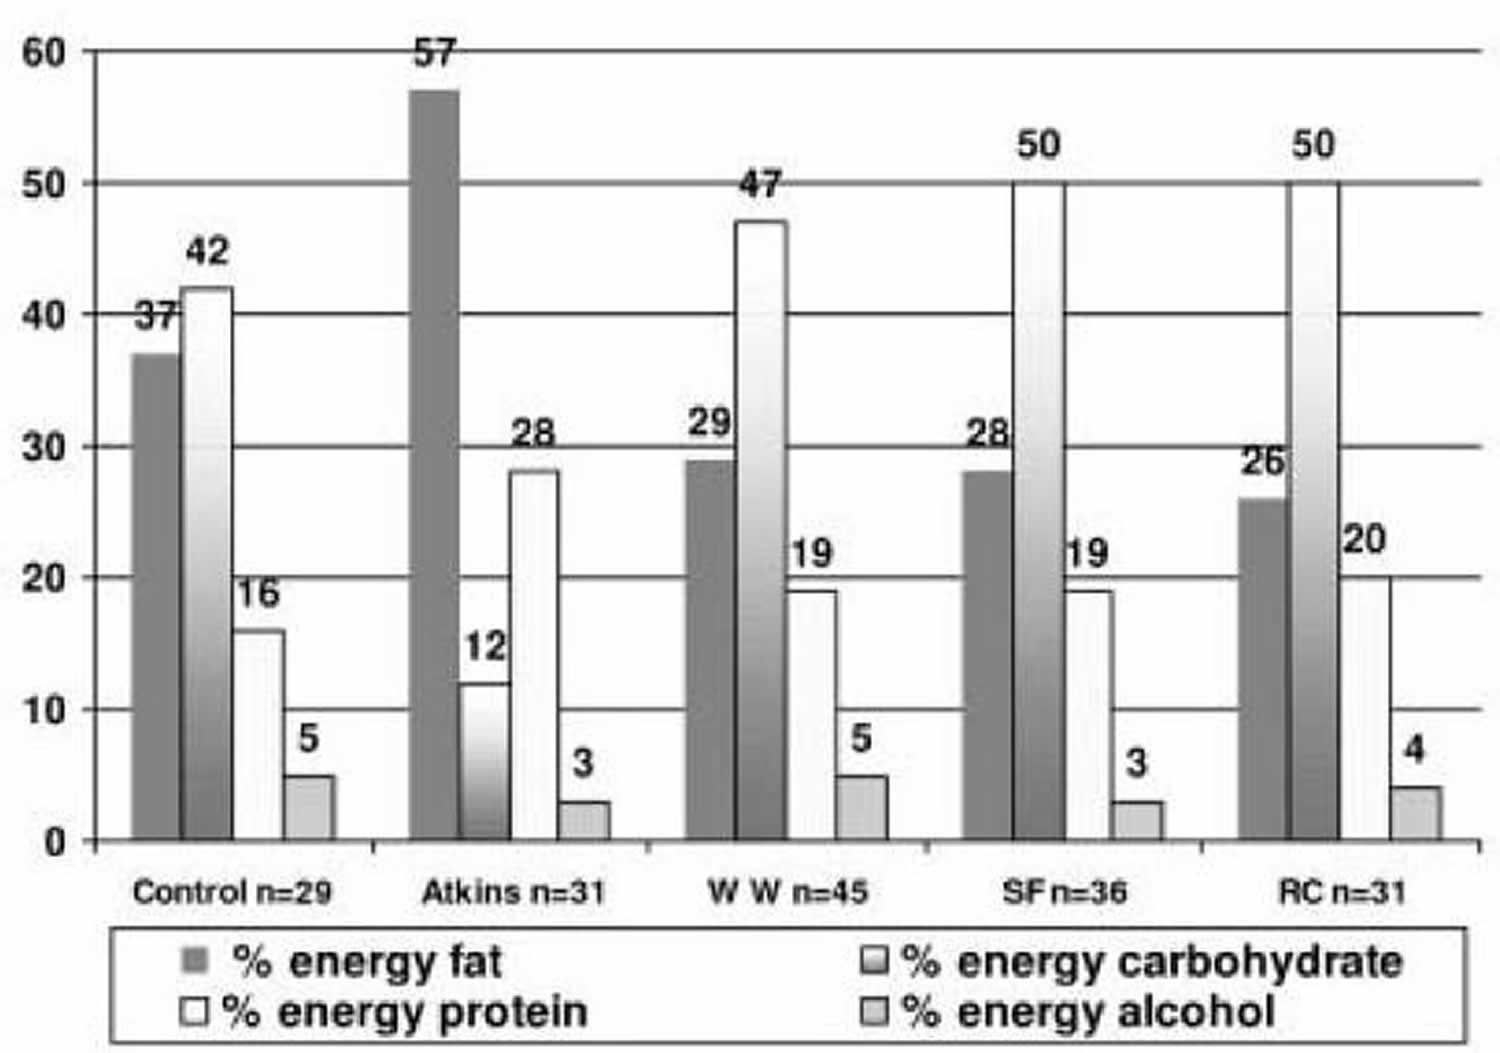
WW= Weight Watchers; SF = Slim Fast; RC= Rosemary Conley
[Source 1]Changes in micronutrients
Micronutrient intakes reported as a proportion of recommended daily intakes are summarized in Table 1 using data for completers only. All of the Atkins group were calculated without micronutrient supplementation and the recommended daily intakes for thiamin was calculated as 0.4 mg/4200 kj reported energy intake. At baseline, the only micronutrient consistently below recommended daily intakes was potassium, this showed a trend to drop further away from the recommended daily intakes in all diet groups over time. In this study, there were significant differences in iron intake between males and females at baseline. At baseline, men had an absolute iron intake (median 14.6 mg, range 5.7 – 27.1 mg/day) that was significantly higher than women (median 11.9 mg range 5.6 – 23 mg/day). Changes in intake of iron (mg/day) from baseline to two months demonstrated a significant effect of diet group for women only .
Changes within diet groups are summarised as follows:
Atkins group
There were significant falls in % recommended daily intake for folate, magnesium, calcium, iron and potassium and a significant increase in selenium.
Weight Watchers group
There were significant declines in % recommended daily intake for riboflavin, niacin, potassium, calcium, magnesium, iron and zinc.
Slimfast group
There was a significant decline for niacin and a rise in % recommended daily intake for zinc after 2 months.
Rosemary Conley group
There were significant decline in % recommended daily intake for magnesium, potassium and zinc.
Control group
There were no significant alterations in micronutrient % recommended daily intake in the control group.
Table 1. Micronutrient intake (mean % recommended daily intakes) and percentage change in recommended daily intakes over the 2 month study period by diet group for individuals with data recorded at baseline and at follow-up
| Atkins | Wt Watchers | Slimfast | Rosemary Conley | Control | ||||||
| Baseline | 2 month | Baseline | 2 month | Baseline | 2 mntho | Baseline | 2 m | Baseline | 2 m | |
| n | 30 | 45 | 34 | 30 | 26 | |||||
| Vitamin A | ||||||||||
| Mean | 182 | 175 | 128 | 104 | 119 | 203 | 158 | 105 | 136 | 118 |
| SEM | 35 | 47 | 10 | 9 | 11 | 58 | 21 | 14 | 17 | 13 |
| %difference (95%CI) | 4 (-67,75) | -23 (-84,39) | 80 (12,148) | -54 (-125,17) | -49 (-125,26) | |||||
| P-value | 0.91 | 0.47 | 0.02 | 0.14 | 0.19 | |||||
| Thiamin | ||||||||||
| Mean | 223 | 146 | 240 | 323 | 198 | 250 | 235 | 449 | 274 | 178 |
| SEM | 34 | 9 | 40 | 91 | 15 | 16 | 37 | 250 | 65 | 15 |
| %difference (95%CI) | -96 (-283,90) | 98 (-68,264) | 37 (-141,215) | 208 (14,402) | -70 (-267,128) | |||||
| P-value | 0.31 | 0.25 | 0.68 | 0.40 | 0.49 | |||||
| Riboflavin | ||||||||||
| Mean | 158 | 138 | 161 | 128 | 147 | 167 | 169 | 151 | 143 | 134 |
| SEM | 9 | 11 | 7 | 7 | 7 | 12 | 11 | 8 | 7 | 8 |
| %difference (95%CI) | -19 (-36,-3) | -30 (-44,-16) | 18 (3,34) | -14 (-30,3) | -9 (-27,8) | |||||
| P-value | 0.02 | <0.00 | 0.02 | 0.10 | 0.29 | |||||
| Niacin | ||||||||||
| Mean | 310 | 353 | 314 | 253 | 301 | 257 | 321 | 284 | 307 | 283 |
| SEM | 14 | 29 | 12 | 10 | 12 | 14 | 13 | 11 | 20 | 18 |
| %difference (95%CI) | 44 (8,79) | -55 (-96,-25) | -52 (-86,-18) | -33 (-69,3) | -18 (-56,19) | |||||
| P-value | 0.02 | <0.001 | 0.003 | 0.07 | 0.34 | |||||
| Folate | ||||||||||
| Mean | 139 | 93 | 132 | 116 | 125 | 133 | 138 | 133 | 126 | 114 |
| SEM | 9 | 8 | 8 | 5 | 7 | 7 | 10 | 9 | 8 | 7 |
| %difference (95%CI) | -42 (-57,-26) | -13 (-26,0) | 6 (-9,21) | -2 (-18,14) | -8 (-25,8) | |||||
| P-value | <0.00 | 0.05 | 0.41 | 0.998 | 0.34 | |||||
| Vitamin C | ||||||||||
| Mean | 224 | 132 | 242 | 224 | 248 | 326 | 309 | 379 | 275 | 205 |
| SEM | 23 | 19 | 21 | 21 | 29 | 69 | 39 | 57 | 40 | 42 |
| %difference (95%CI) | -89 (-178,19) | -13 (-90,64) | 65 (-21,151) | 107 (17,197) | -78 (-174,19) | |||||
| P-value | 0.06 | 0.74 | 0.14 | 0.02 | 0.11 | |||||
| Calcium | ||||||||||
| Mean | 125 | 92 | 130 | 87 | 133 | 139 | 138 | 113 | 123 | 111 |
| SEM | 8 | 7 | 6 | 4 | 11 | 6 | 10 | 15 | 10 | 8 |
| %difference (95%CI) | -33 (-51,-11) | -39 (-58,-20) | 2 (-19,24) | -22 (-44,1) | -22 (-46,1) | |||||
| P-value | 0.004 | <0.00 | 0.82 | 0.06 | 0.06 | |||||
| Magnesium | ||||||||||
| Mean | 106 | 75 | 112 | 84 | 106 | 104 | 115 | 97 | 102 | 95 |
| SEM | 6 | 7 | 5 | 3 | 4 | 4 | 4 | 4 | 4 | 6 |
| %difference (95%CI) | -31 (-41,-21) | -25 (-34,-17) | -3 (-12,7) | -16 (-26,-6) | -5 (-15,6) | |||||
| P-value | <0.001 | <0.001 | 0.56 | 0.002 | 0.38 | |||||
| potassium | ||||||||||
| Mean | 96 | 67 | 98 | 77 | 95 | 88 | 104 | 88 | 93 | 84 |
| SEM | 5 | 4 | 5 | 4 | 4 | 4 | 4 | 4 | 4 | 4 |
| %difference (95%CI) | -28 (-37,-19) | -19 (-27,-12) | -8 (-17,0) | -12 (-21,-3) | -8 (-17,2) | |||||
| P-value | <0.001 | <0.001 | 0.05 | 0.007 | 0.11 | |||||
| iron | ||||||||||
| Mean | 136 | 91 | 121 | 97 | 111 | 130 | 126 | 110 | 116 | 104 |
| SEM | 11 | 9 | 10 | 9 | 8 | 9 | 9 | 8 | 11 | 9 |
| %difference (95%CI) | -43 (-59,-28) | -24 (-37,-11) | 17 (2,31) | -16 (-31,0) | -11 (-27,5) | |||||
| P-value | <0.001 | <0.001 | 0.03 | 0.05 | 0.18 | |||||
| zinc | ||||||||||
| Mean | 119 | 139 | 113 | 88 | 117 | 196 | 123 | 96 | 118 | 103 |
| SEM | 6 | 9 | 4 | 4 | 5 | 18 | 5 | 4 | 8 | 6 |
| %difference (95%CI) | 15 (-4,35) | -24 (-41,-7) | 74 (55,92) | -26 (-45,-6) | -12 (-33,9) | |||||
| P-value | 0.13 | 0.005 | <0.001 | 0.01 | 0.25 | |||||
| selenium | ||||||||||
| Mean | 100 | 149 | 116 | 86 | 97 | 97 | 103 | 79 | 93 | 87 |
| SEM | 6 | 41 | 13 | 7 | 5 | 4 | 5 | 5 | 7 | 12 |
| %difference (95%CI) | 49 (18,79) | -25 (-51,1) | -2 (-31,27) | -27 (-57,4) | -6 (-39,26) | |||||
| P-value | 0.002 | 0.06 | 0.89 | 0.119 | 0.70 | |||||
Dietary fiber and fruit and vegetable intake
Intake of dietary fiber was on average 17.7 g/day; with no diet group differences but gender differences were apparent with men consuming on average 3 g/day more dietary fibre than women. Baseline intake of non-starch polysaccharide was below the recommended intake of 18 g/day (mean intake 12.8 g/day).
The median number of fruit and vegetable portions consumed at baseline was 17 portions per week (2.4 portions per day). Only 12% of the entire cohort achieved the UK recommended intake of ≥ 5 fruit and vegetables portions per day at baseline. There were no between diet group differences in portions of fruit and vegetables eaten at baseline.
Only the Weight Watchers diet led to a significant increase of fruit and vegetables and this amounted to less than one portion per day (0.79 portions per day). There was a trend towards an increase in the Rosemary Conley group (0.53 portion increase); there were no significant shifts for the other diets tested. Although portions of fruit and vegetables eaten on the Atkins diet did not alter over time, there was a significant reduction in non-starch polysaccharide intake in the Atkins dieters. A repeated measures of non-starch polysaccharide intake from baseline to 2 months of all diet groups showed a significant effect of diet group and post hoc testing demonstrated a significant reduction in non-starch polysaccharide (12.8 g at baseline to 5.1 g at 2 months) for the Atkins group compared to all the other diets.
Weight and fat loss
Monthly weight loss by using all available data (Figure 3) was high initially but then slowed. Loss of body fat showed similar patterns (see Table 2). Mean weight loss was significantly higher in the Atkins group than in the other diet groups during the first four weeks: Atkins 4.4 kg (range 13.5 to 0.3 kg), Weight Watchers 2.86 kg (range 12.9 to – 0.9 kg), Slim-Fast 2.68 kg (range 9.4 to – 1.8 kg), and Rosemary Conley 3.17 kg (range 8.1 to – 2.0 kg). Furthermore, in the first two months, the greatest loss of body fat was also seen in the Atkins group; however, this loss was not significantly different from that seen in the Weight Watchers or Rosemary Conley groups, but it was significantly greater than that seen in the Slim-Fast group. Fat loss was significantly greater in all four diet groups than in the control group. Between two and six months, fat loss (kg and percentage) slowed down and the diets groups did not differ significantly. Between baseline and six months fat loss did not differ between diet groups, but fat loss in all diet groups was significantly greater than in the control group. All diets resulted in a reduction in waist circumference. Waist reduction (at six months) was highly correlated with total weight loss and moderately correlated with percentage of body fat lost.
Table 2. Mean baseline characteristics of participants in the BBC diet trials allocated to different diet regimens. Values are mean (SD)
| Characteristic | Atkins diet (n=57) | Weight Watchers (n=58) | Slim-Fast (n=59) | Rosemary Conley (n=58) | Controls (n=61) |
|---|---|---|---|---|---|
| Age (years) | 40.9 (9.7) | 39.9 (10.9) | 38.9 (10.7) | 40.6 (10.3) | 40.8 (9.6) |
| Weight (kg) | 90.3 (12.7) | 88.8 (13.3) | 90.1 (14.1) | 89.8 (12.9) | 87.9 (13.5) |
| Body mass index (kg/m2) | 31.9 (2.2) | 31.2 (2.7) | 32.2 (3.0) | 31.6 (2.6) | 31.5 (2.9) |
| Body fat (kg)* | 35.7 (6.0) | 34.2 (6.9) | 35.6 (6.5) | 34.5 (7.6) | 33.4 (6.5) |
| Body fat (%) | 40.9 (6.6) | 39.7 (7.1) | 40.6 (6.5) | 39.6 (7.7) | 39.4 (6.8) |
| Waist circumference (cm) | 102 (10.6) | 100 (10.3) | 101 (11.5) | 100 (9.8) | 100 (10.1) |
| Blood pressure (mm Hg): | |||||
| Systolic | 135 (15.1) | 127 (15.1) | 129 (17) | 130 (14.8) | 130 (16.1) |
| Diastolic | 83 (10.7) | 80 (10.7) | 81 (11.5) | 82 (10.3) | 81 (9.6) |
| Glucose (mmol/l)† | 5.47 (0.5) | 5.46 (0.5) | 5.53 (0.6) | 5.6 (0.6) | 5.48 (0.5) |
| Total cholesterol (mmol/l)† | 5.77 (0.9) | 5.58 (1.1) | 5.47 (1.1) | 5.63 (0.95) | 5.80 (1.1) |
Figure 3. Weight loss during the BBC diet trials
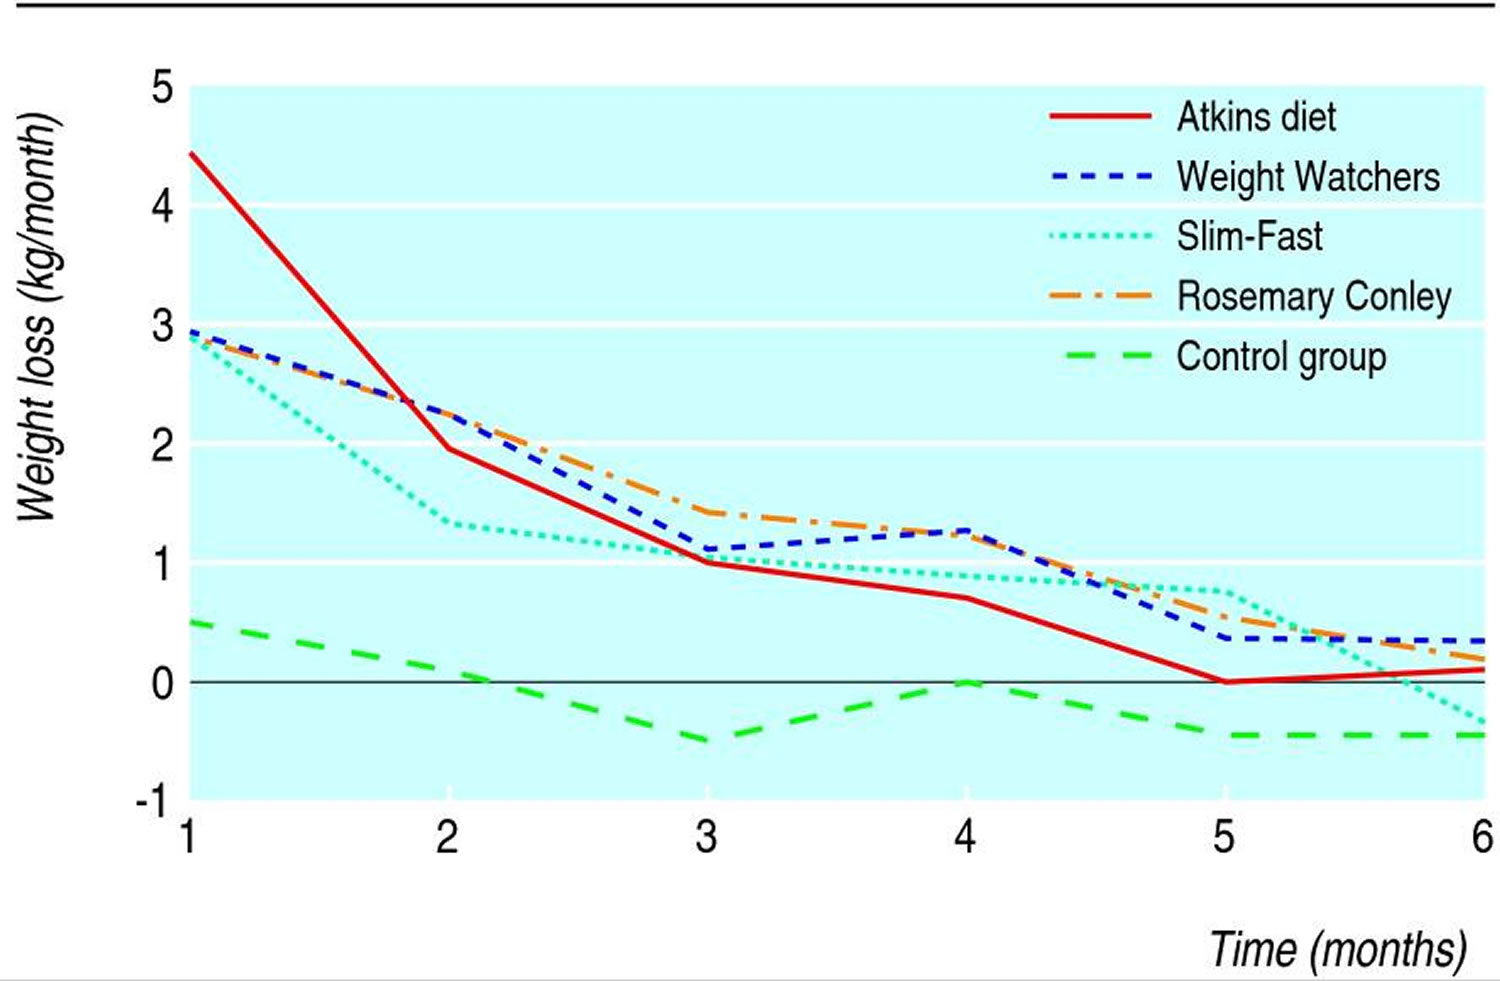
Table 3. Main outcome indicators in participants in the BBC diet trials allocated to different diet regimens
| Outcome | Atkins diet (n=57) | Weight Watchers (n=58) | Slim-Fast (n=58) | Rosemary Conley (n=58) | Controls (n=61) |
|---|---|---|---|---|---|
| Weight loss (kg) | |||||
| 0-2 months | 5.2 (4.4) | 4.7 (3.2) | 3.7 (3.5) | 4.0 (3.3) | 0.4 (1.8) |
| 2-6 months | 1.3 (3.1) | 2.2 (3.0) | 1.4 (2.8) | 2.4 (3.4) | −0.9 (1.6) |
| 0-6 months | 6.0 (6.4) | 6.6 (5.4) | 4.8 (5.6) | 6.3 (6.1) | −0.6 (2.2) |
| Weight loss (%) | |||||
| 0-2 months | 5.5 (4.2) | 5.1 (3.5) | 3.8 (3.4) | 4.5 (3.6) | 0.4 (2.2) |
| 2-6 months | 1.3 (3.1) | 2.4 (3.4) | 1.3 (2.9) | 2.7 (3.7) | −1.2 (1.9) |
| 0-6 months | 6.2 (6.2) | 7.3 (6.1) | 4.9 (5.5) | 7.0 (6.6) | −0.6 (2.7) |
| Fat loss (kg)* | |||||
| 0-2 months | 3.5† (3.0) | 3.1 (2.4) | 2.3† (2.3) | 2.5 (2.1) | 0.2 (1.3) |
| 2-6 months | 1.2 (2.3) | 2.0 (2.3) | 1.2 (2.6) | 2.1 (2.5) | −0.5 (1.2) |
| 0-6 months | 4.6 (4.8) | 5.0 (4.3) | 3.4 (4.3) | 4.5 (4.3) | −0.3 (4.4) |
| Fat loss (%) | |||||
| 0-2 months | 1.9† (1.9) | 1.6 (1.9) | 1.0† (1.4) | 1.5 (1.5) | 0.1 (1.4) |
| 2-6 months | 1.3 (1.9) | 2.0 (2.0) | 1.2 (2.4) | 2.1 (2.4) | −0.0 (1.0) |
| 0-6 months | 3.1 (3.3) | 3.6 (3.3) | 2.1 (2.9) | 3.4 (3.5) | 0.1 (1.6) |
| Reduction in waist circumference (cm) | |||||
| 0-2 months | 6.7 (6.1) | 5.5 (5.1) | 4.8 (4.6) | 4.5 (5.3) | 1.0 (4.0) |
| 2-6 months | 2.4 (4.0) | 3.0 (3.5) | 2.1 (3.4) | 3.0 (4.2) | −0.3 (2.4) |
| 0-6 months | 8.1 (7.4) | 8.3 (7.0) | 6.4 (6.3) | 7.2 (7.2) | 0.8 (3.8) |
For all variables reported, the control group was significantly different from all other groups (P<0.001).
Analysis of diet programmes completers
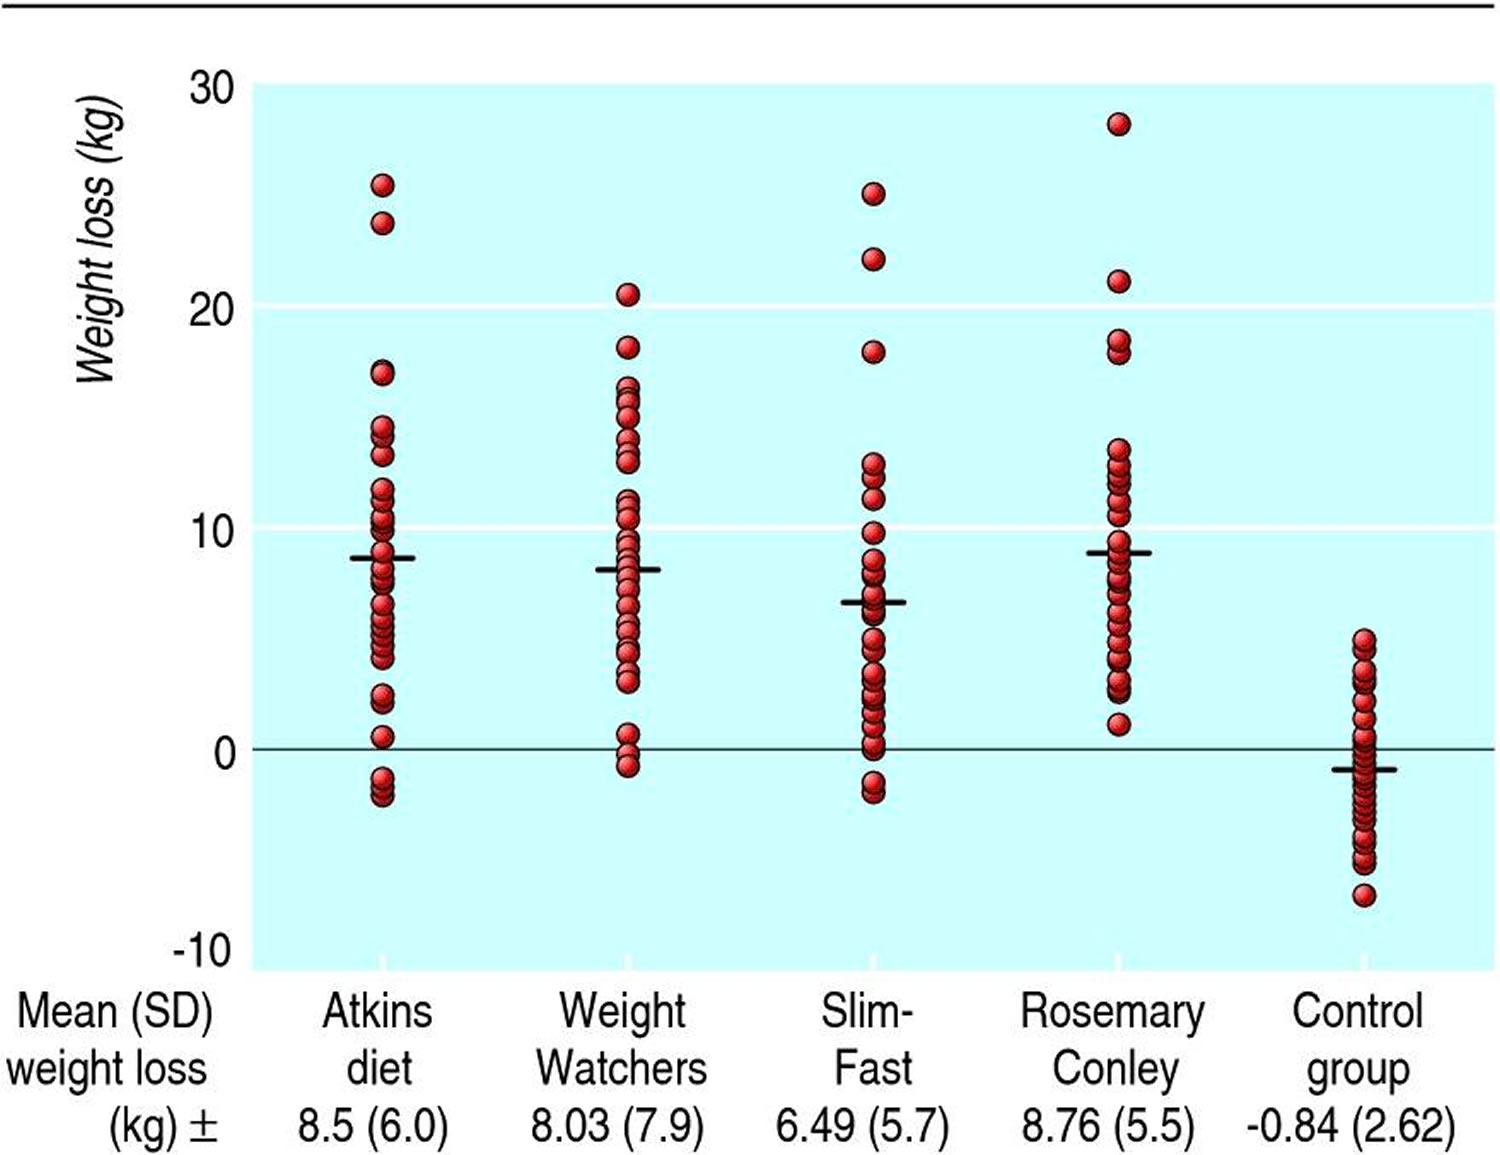
A secondary analysis of data from participants who completed the trial shows the range of weight lost by these highly motivated participants, who probably adhered most strongly to the randomly allocated diets. Figure 4 shows the range of total weight lost; some participants lost more than 25 kg over the six month study period, whereas others gained weight. After six months all diets resulted in a clinically useful mean reduction in percentage body weight: Rosemary Conley 9.9%, Weight Watchers 9.0%, Atkins 8.9% and Slim-Fast 6.8% 2; no significant differences were seen between the diets but all were more successful than no diet (controls gained 0.95%, 3.3%). The proportion of participants who completed the trial and lost at least 10% of their body weight at six months was 46% for the Rosemary Conley group, 45% for the Atkins group, 36% for the Weight Watchers group, and 21% for the Slim-Fast group. These losses were achieved despite the random allocation of diets.
Figure 4. Absolute weight loss of participants who completed the BBC diet trials
Cardiac risk factors
The researchers found few significant differences in cardiac risk factors between the diets groups and the control group (Table 3). Initially, the fall in systolic pressure in the Atkins group was significantly greater than in the Slim-Fast group but not the other groups, probably because of the relatively greater initial weight loss in the Atkins group. Regression analysis showed that total weight loss over time had the greatest influence on systolic and diastolic pressure.
Glucose concentrations fell slightly over time; only in the Weight Watchers group was fasting glucose significantly lower than in the control group. In the first two months, a significant but small drop in total cholesterol was seen in all diet groups except for the Atkins group. By six months, cholesterol had fallen significantly compared with the control group only in the Weight Watchers group (by 0.55 mmol/l).
Table 4. Changes in cardiac risk factors in participants in the BBC diet trials allocated to different diet regimens. Values are mean (SD)
| Outcome | Atkins diet (n=57) | Weight Watchers (n=58) | Slim-Fast (n=58) | Rosemary Conley (n=58) | Controls (n=61) |
| Fall in blood pressure | |||||
| 0-2 months: | |||||
| Systolic | 5.7* (12.7) | 3.5 (9.6) | 0.5* (11.4) | 2.4 (11.2) | 3.3 (11.0) |
| Diastolic | 3.6 (8.4) | 4.1 (6.8) | 3.1 (7.8) | 2.8 (7.1) | 2.0 (7.0) |
| 2-6 months: | |||||
| Systolic | 1.3 (9.8) | 0.9 (10.3) | 2.9 (12.4) | 2.1 (9.2) | −0.9 (8.3) |
| Diastolic | 1.1 (6.3) | 0.8 (6.7) | −0.3 (8.6) | 1.0 (5.5) | −0.4 (5.7) |
| 0-6 months: | |||||
| Systolic | 7.2 (11.6) | 4.1 (11.7) | 2.7 (10.7) | 4.5 (9.8) | 2.8 (11.6) |
| Diastolic | 4.9 (8.1) | 4.4 (8.6) | 2.5 (8.6) | 3.6 (6.0) | 1.6 (7.4) |
| Fall in total glucose (mmol/l) | |||||
| 0-2 months | 0.04 (0.4) | 0.14 (0.5) | 0.13 (0.5) | 0.15 (0.5) | 0.02 (0.4) |
| 2-6 months | 0.13 (0.5) | 0.29 (0.6) | 0.12 (0.5) | 0.17 (0.5) | 0.13 (0.4) |
| 0-6 months | 0.19 (0.5) | 0.46* (0.6) | 0.19 (0.6) | 0.27 (0.5) | 0.14* (0.5) |
| Fall in cholesterol (mmol/l) | |||||
| 0-2 months | 0.08 (0.7) | 0.44* (0.6) | 0.26* (0.6) | 0.35* (0.8) | 0.08 (0.5) |
| 2-6 months | 0.19 (0.5) | 0.11 (0.5) | 0.07 (0.5) | 0.08 (0.6) | 0.24 (0.24) |
| 0-6 months | 0.29 (0.8) | 0.55* (0.7) | 0.35 (0.6) | 0.5 (0.5) | 0.5* (0.18) |
Compliance with the diets
Reported attendance at slimming clubs was similar at two months (Rosemary Conley 79%, Weight Watchers 66%) and six months (Rosemary Conley 47%, Weight Watchers 47%). Slim-Fast recommends 14 meal replacements each week; participants reported 10 each week at two months and eight at six months. With the Atkins diet, reported portions of carbohydrate foods fell from 40 each day at baseline to five at two months and seven at six months.
Withdrawal from diet programmes
Eighty three (28%) participants had withdrawn by six months (Table 5); 53 (64% of the total number) had withdrawn by week 8, and at this time only seven (8%) participants who withdrew had lost more than 5% of their body weight compared with 53 (25%) who completed the trial. Older participants were significantly more likely to complete than younger ones (mean age 41.6 v 36.8). No differences in diet, center or sex were found between participants who completed or withdrew. Withdrawal in the control group (21; 35%) was mostly because participants did not wish to delay dieting.
Table 5. Reasons for withdrawal from the diet
| Group | Dissatisfied with randomization | Could not tolerate diet | Dissatisfied with weight loss | Non-compliant or lost to follow-up | Socioeconomic | Pregnancy | Total (% of initial cohort) | |||||||
|---|---|---|---|---|---|---|---|---|---|---|---|---|---|---|
| M | F | M | F | M | F | M | F | M | F | M | F | M | F | |
| Atkins diet | 0 | 2 | 1 | 6 | 0 | 0 | 0 | 2 | 1 | 5 | — | 0 | 2 (13) | 15 (36) |
| Weight Watchers | 0 | 1 | 0 | 2 | 0 | 1 | 2 | 4 | 0 | 1 | — | 0 | 2 (13) | 9 (21) |
| Slim-Fast | 0 | 0 | 1 | 6 | 0 | 3 | 4 | 1 | 0 | 1 | — | 1 | 5 (29) | 12 (29) |
| Rosemary Conley | 2 | 1 | 0 | 1 | 1 | 2 | 1 | 3 | 2 | 4 | — | 0 | 6 (40) | 11 (26) |
| Controls | 2 | 12 | — | — | — | — | 2 | 1 | 1 | 3 | — | 0 | 5 (33) | 16 (35) |
| Total | 4 | 16 | 2 | 15 | 1 | 6 | 9 | 11 | 4 | 14 | 1 | 20 (25) | 63 (29) | |
M=male, F=female.
Follow-up at 12 months
At 12 months, 158 participants (54% of the original sample) returned data; 29 had originally been allocated to the Atkins diet, 33 to Weight Watchers, 33 to Slim-Fast, 35 to Rosemary Conley, and 28 to the control group. Dieting behaviour had changed considerably: only 58 (45%) were still keeping to their originally allocated diets (nine to Atkins, 20 to Weight Watchers, nine to Slim-Fast, 20 to Rosemary Conley). Twenty five (19%) had swapped dietary programmes and 47 (36%) were following their own diet or exercise plan. More participants in the unsupported programmes (Atkins diet and Slim-Fast) withdrew than in the supported programmes. Participants in the control group who had switched to dieting (mean weight loss 6.37 kg) also preferred group based approaches because just over half chose Weight Watchers.
Because so many participants changed diets (25% of men and 29% of women), we also analysed weight loss in participants who had maintained the diet to which they were initially allocated (Table 6). Statistical analysis is limited by sample size but indicates that weight rebound after the initial six months was higher in the unsupported programmes; however, all diets resulted in a clinically useful weight loss of around 10% after 12 months in participants who had persisted with the diet allocated.
Table 6. Mean weight loss for participants in the BBC diet trials who completed 12 months on the diet to which they were randomly allocated
| Weight loss | Atkins diet (n=9) | Weight watchers (n=20) | Slim-Fast (n=9) | Rosemary Conley (n=20) |
| 0-12 months: | ||||
| Absolute weight loss (kg) | 9.0 (4.1) | 9.1 (6.2) | 10.7 (6.2) | 10.9 (4.1) |
| Weight loss (% of initial body weight) | 10.3 (4.7) | 10.3 (6.0) | 11.4 (5.9) | 13.1 (4.9) |
| 6-12 months: | ||||
| Absolute weight loss (kg) | −1.5 (3.3) | 0.45 (3.6) | −1.65 (3.1) | 1.2 (3.5) |
Conclusions
Clinically beneficial weight loss is possible through the 4 commercially available strategies (Weight Watchers, Slim-Fast, Rosemary Conley and Atkins) and reduced blood pressure and waist circumference accompany weight loss. The four different approaches were equally effective after six months 2. Reductions in weight and body fat were seen with the Atkins diet within the first eight weeks of dieting, so that the large weight changes seen with low carbohydrate diets are not caused by loss of body water alone. The Atkins diet had no detrimental effects on total cholesterol concentrations or renal function, although the overall safety of the diet was not tested 3.
No dietary differences were apparent at six months, but behavior from six to 12 months points towards an advantage of programmes based on group support.
The range of absolute weight loss in participants who completed the study was wide. However, the mean absolute weight loss of around 8 kg is comparable to other studies 4. Compliance with each diet varied greatly. Weight can be lost only by a sustained negative balance of energy, so the degree of adherence to a diet will predict success or failure if activity levels remain constant.
The need for a “quick fix” and the relative lack of interest that people show in achieving modest weight loss contribute to lack of adherence to most diets in the long term. People who had kept to their allocated diet lost about 10% of their weight, despite some weight rebound, but some regression to the mean effect was seen.
- Overall, mean weight loss did not vary significantly between the 4 commercially available diet groups (Weight Watchers, Slim-Fast, Rosemary Conley and Atkins).
- Clinically useful weight loss and fat loss can be achieved in adults who are motivated to follow commercial diets for a substantial period.
- The Rosemary Conley’s diet and exercise plans offer a balanced approach to weight loss that teaches you about portion size, the importance of regular exercise and making healthier choices. The educational element is very useful for long-term weight management once you have left the programme.
Rosemary Conley’s diet Pros:
The programme is based around calories, with a focus on cutting fat. The “portion pots” – which are used to measure foods such as rice, cereal, pasta and baked beans – teach you about portion control. Physical activity is an integral part of the weight loss plan, with exercise videos suitable for all ages, sizes and abilities offered online.
Rosemary Conley (and Slimming World and Weight Watchers), meets the National Institute for Health and Care Excellence (NICE) best practice criteria 5 to be effective at 12 to 18 months – in helping adults adopt the lifestyle behavior changes needed to reduce weight, prevent weight gain and support long-term weight maintenance.
Rosemary Conley’s diet Cons:
Some low-fat products aren’t necessarily healthier, as they can still be high in sugar and calories. It’s unrealistic to expect people to go out with their portion pots, which means portion control may be tricky away from the home.
- Truby H, Hiscutt R, Herriot AM, et al. Commercial weight loss diets meet nutrient requirements in free living adults over 8 weeks: A randomised controlled weight loss trial. Nutrition Journal. 2008;7:25. doi:10.1186/1475-2891-7-25. https://www.ncbi.nlm.nih.gov/pmc/articles/PMC2551603/[↩][↩][↩][↩]
- Truby H, Baic S, deLooy A, et al. Randomised controlled trial of four commercial weight loss programmes in the UK: initial findings from the BBC “diet trials.” BMJ : British Medical Journal. 2006;332(7553):1309-1314. doi:10.1136/bmj.38833.411204.80. https://www.ncbi.nlm.nih.gov/pmc/articles/PMC1473108/[↩][↩][↩][↩][↩][↩][↩][↩][↩][↩][↩][↩][↩]
- Safety of low-carbohydrate diets. Crowe TC. Obes Rev. 2005 Aug; 6(3):235-45. https://www.ncbi.nlm.nih.gov/pubmed/16045639/[↩]
- The efficacy of dietary fat vs. total energy restriction for weight loss. Harvey-Berino J. Obes Res. 1998 May; 6(3):202-7. https://www.ncbi.nlm.nih.gov/pubmed/9618124/[↩]
- Weight management: lifestyle services for overweight or obese adults. https://www.nice.org.uk/guidance/ph53[↩]


