
Contents
What is the Slimming World diet
The commercial weight management organization, Slimming World (and Rosemary Conley and Weight Watchers), meets the National Institute for Health and Care Excellence (NICE) best practice criteria 1 to be effective at 12 to 18 months – in helping adults adopt the lifestyle behavior changes needed to reduce weight, prevent weight gain and support long-term weight maintenance.
Slimming World’s weight loss plan encourages you to swap high-fat foods for low-fat foods that are naturally filling. You choose your food from a list of low-fat foods they call “Free Foods”, such as fruit, vegetables, pasta, potatoes, rice, lean meat, fish and eggs, which you can eat in unlimited amounts. There’s no calorie counting, no foods are banned, and you’re still allowed the occasional treat. You can get support from fellow slimmers at weekly group meetings and follow an exercise plan to become gradually more active. The plan is designed to help you lose about 1-2lb a week.
The organisation has an extensive community-based infrastructure of over 13,000 support groups held each week across the UK and Ireland, supporting ~800,000 members seeking to manage their weight and to develop healthy eating and lifestyle behaviors 2, 3. Groups are located in a variety of local venues at different times and days of the week, making the groups widely accessible for members of the community. Around 98 % of participants access the groups through self-referral and pay weekly (£4.95) to attend their chosen group. This is an open programme, with no fixed duration of membership. Participants can join, leave and re-join as they wish for any length of time as support groups are continuously available week-by-week through the year, to maximise attendance and engagement from members of the community.
The programme consist of a multi-component approach utilizing evidence-based behavior change techniques in the context of group support targeted to individual needs to help members to make healthier food choices and gradual increases in physical activity 4. Trained facilitator-led group support provides an environment, which avoids criticism, prescriptive control or judgment and facilitates sustainable health related behavior changes. The support system combines individual attention and group participation in a forum where members discuss experiences, identify their own patterns of behavior and, with the support of the group, develop new ways of overcoming barriers to change to support weight loss and maintenance of weight loss.
Evidence-based strategies and actions taken in the programme to promote and sustain weight loss include:
- Self-regulation through a variety of techniques including:
- (i) weekly recording of body weight,
- (ii) use of diaries to self-monitor food, activity, feelings and emotions and energy density risk scaling tools to encourage participants to eat more healthily,
- (iii) individualized motivation and group support for self-monitoring, goal setting, action plans, contingent reinforcement, and pre-planned strategies for relapse events 5.
- Motivational components for dietary and physical activity change involving practices focused on improving intrinsic motivation and self-efficacy for physical activity and healthy eating 6.
- Emotion regulation and stress management components through a non-judgemental, non-stigmatic and de-shaming environment of social support enabling shared experience with an emphasis on the importance of compassion and self-compassion 7.
Slimming World Diet reviews
Weight change and attendance
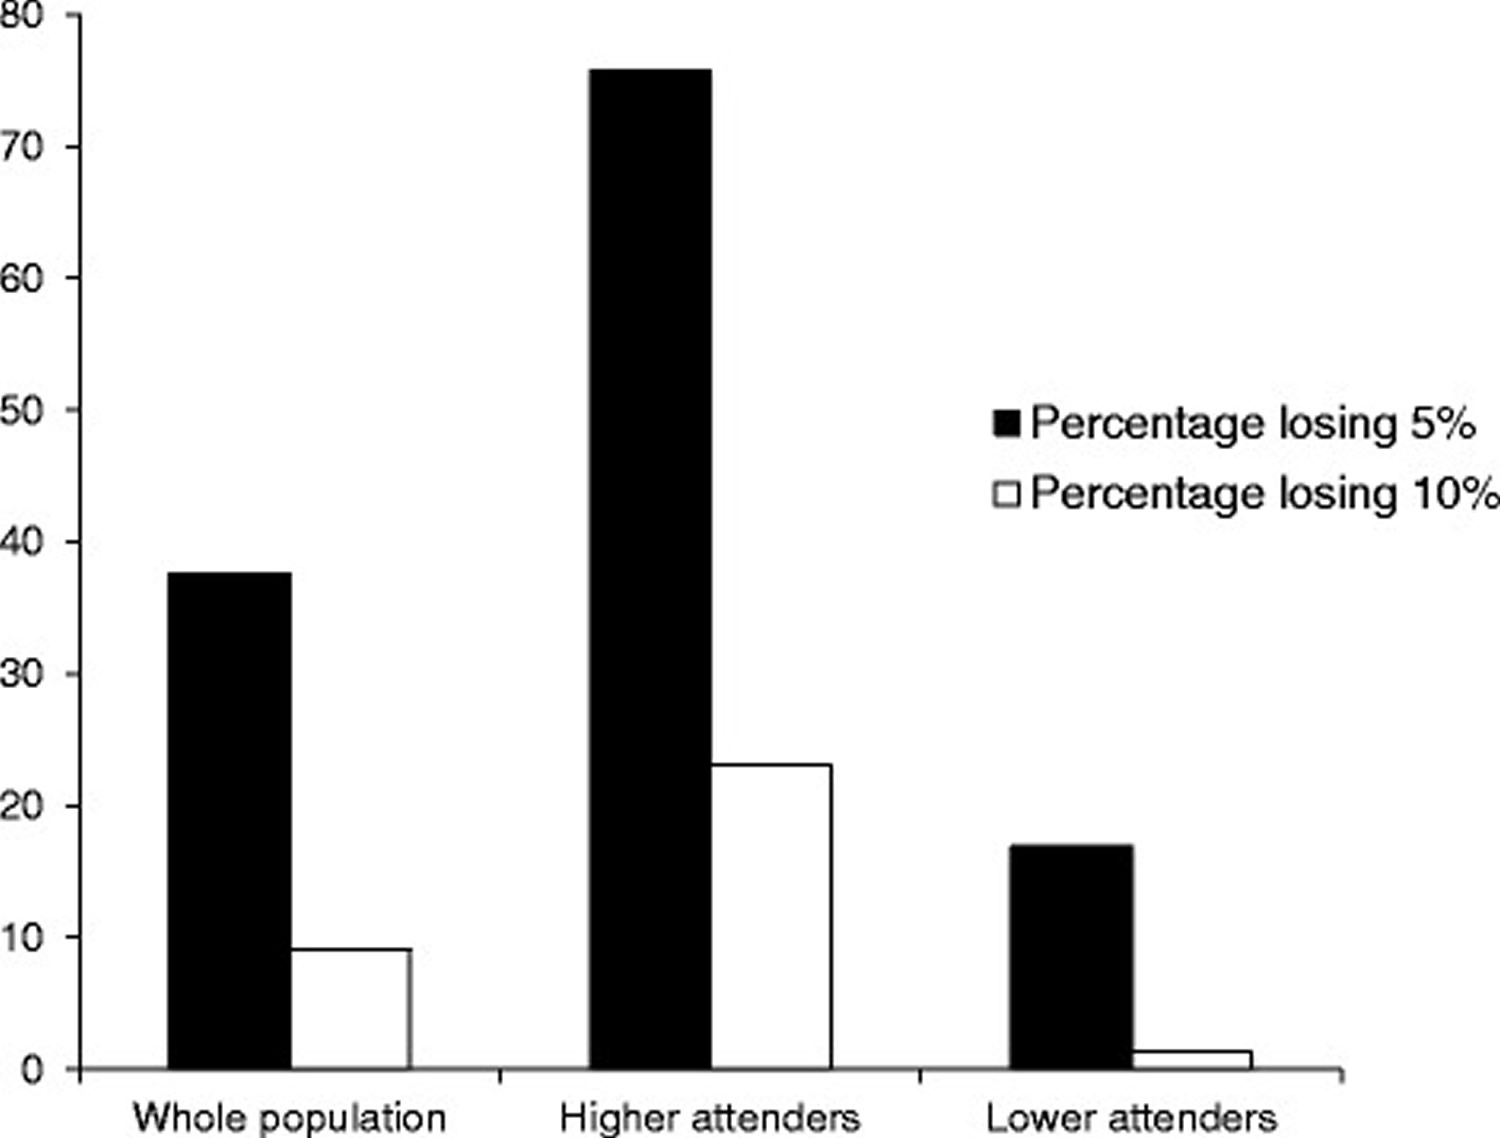
The characteristics and outcomes for higher attenders and lower attenders are given in Table 1. Mean weight change of all participants was −3.9 kg, percent weight change −4.4 %, BMI after 3 months was 31.2 kg/m2 and mean BMI change was −1.4 kg/m2. Mean attendance was 7.8 of a possible 14 sessions. Excluding all subjects who only attended one week and therefore recorded no weight change (n = 91,814), mean weight change was −4.2 kg, percent weight change −4.7 % (3.7), mean BMI change was −1.5 kg/m2 and mean attendance was 8.2 (4.0). 478,772 (35.3 %) of participants attended at least 75 % of sessions (higher attenders) and 877,333 (64.7 %) were classified as lower attenders. Mean attendance of higher attenders was 12.5 sessions and for lower attenders was 5.1 sessions. 37.6 % of the whole population and 75.7 % of the higher attenders lost at least 5 %, 23.1 % of higher attenders and 9.0 % of the whole population lost equal to or more than 10 % of their body weight over the 14 possible sessions.
Table 1 shows that higher attenders on average were slightly heavier (2.3 kg), older, (3.5 years) had a slightly higher BMI (0.9 kg/m2) and a similar height on enrolment to lower attenders 2. Higher attenders lost significantly more weight than lower attenders (6.8 versus 2.3 kg, respectively), during the 14-week period. The same patterns were evident for percent weight loss (7.5 versus 2.7 % respectively and for change in BMI (−2.5 versus −0.9 kg/m2 respectively).
Figure 1 shows the percentage of the whole population, higher attenders and lower attenders who achieved 5 % and ≥10 % weight loss by week 14. 75.7 % of higher attenders and 16.9 % of lower attenders achieved at least 5 % weight loss. 23.1 % of higher attenders lost at least 10 % of their initial body weight by the end of the referral period compared to 1.3 % of lower attenders.
Table 1. The characteristics and weight loss outcomes for higher attenders (n = 478,772) and lower attenders (n = 877,333). Higher attenders are defined as those who attended ≥75 % of the 14 sessions of the observation period. Lower attenders are those who attended ≤75 % of sessions
| Higher attenders | n = 478,772 | Lower attenders | n = 877,333 | |
| Average | SD | Average | SD | |
| Height (m) | 1.65 | 0.08 | 1.65 | 0.07 |
| Weight (kg) | 89.9 | 19 | 87.6 | 18.6 |
| Age (years) | 44.6 | 13.8 | 41.1 | 13.3 |
| Weight change (kg) | –6.8 | 3.6 | –2.3 | 2.4 |
| Weight change (%) | –7.5 | 3.5 | –2.7 | 2.6 |
| Attendance (wks) | 12.5 | 1.1 | 5.1 | 2.9 |
| Start BMI (kg/m2) | 33.2 | 6.3 | 32.3 | 6.2 |
| End BMI (kg/m2) | 30.7 | 6 | 31.4 | 6.2 |
| BMI change (kg/m2) | –2.5 | 1.3 | –0.9 | 0.9 |
Figure 1. The percentage of the whole population, higher attenders and lower attenders who achieved ≥5 % and ≥10 % weight loss by the end of the 14 sessions of the observation period (n = 1,356,105)
Men and women
Table 2 compares the characteristics and weight loss outcomes for men and women. Men were on average taller (0.14 m), older (2 years), heavier (26.2 kg) and had a higher BMI (3.2 kg/m2) on enrolment than women. Men tended to lose more weight than women both absolutely (2.7 kg) and as a percentage (1.4 %) of baseline body weight. Men attended to a slightly greater degree than women (0.8 sessions) and they had a greater BMI change (−0.7 kg/m2) than women over the 14 sessions of the observation period. There was a significant difference in the percentage of men and women classed as higher attenders (42.5 % versus 34.9 %, respectively).
A significantly higher percentage of men than women lost 5 % (51.1 % versus 36.9 %) and 10 % (18.3 % versus 8.6 %, respectively) of their baseline weight by the 14th session.
Table 2. The characteristics and weight loss outcomes for men (n = 67,139) and women (n = 1,288,966)
| Men | n = 67,139 | Women | n = 1,288,966 | |
| Average | SD | Average | SD | |
| Height (m) | 1.78 | 0.07 | 1.64 | 0.07 |
| Start weight (kg) | 113.3 | 21.8 | 87.1 | 17.7 |
| Age (years) | 44.2 | 13.3 | 42.2 | 13.6 |
| Weight change (kg) | –6.5 | 5.3 | –3.8 | 3.4 |
| Weight change (%) | –5.7 | 4.4 | –4.3 | 3.7 |
| Attendance (wks) | 8.5 | 4.2 | 7.7 | 4.3 |
| Start BMI (kg/m2) | 35.6 | 6.3 | 32.4 | 6.2 |
| BMI at 3 months (kg/m2) | 33.5 | 6.1 | 31 | 6.1 |
| BMI change (kg/m2) | –2.1 | 1.7 | –1.4 | 1.3 |
Rates of weight change
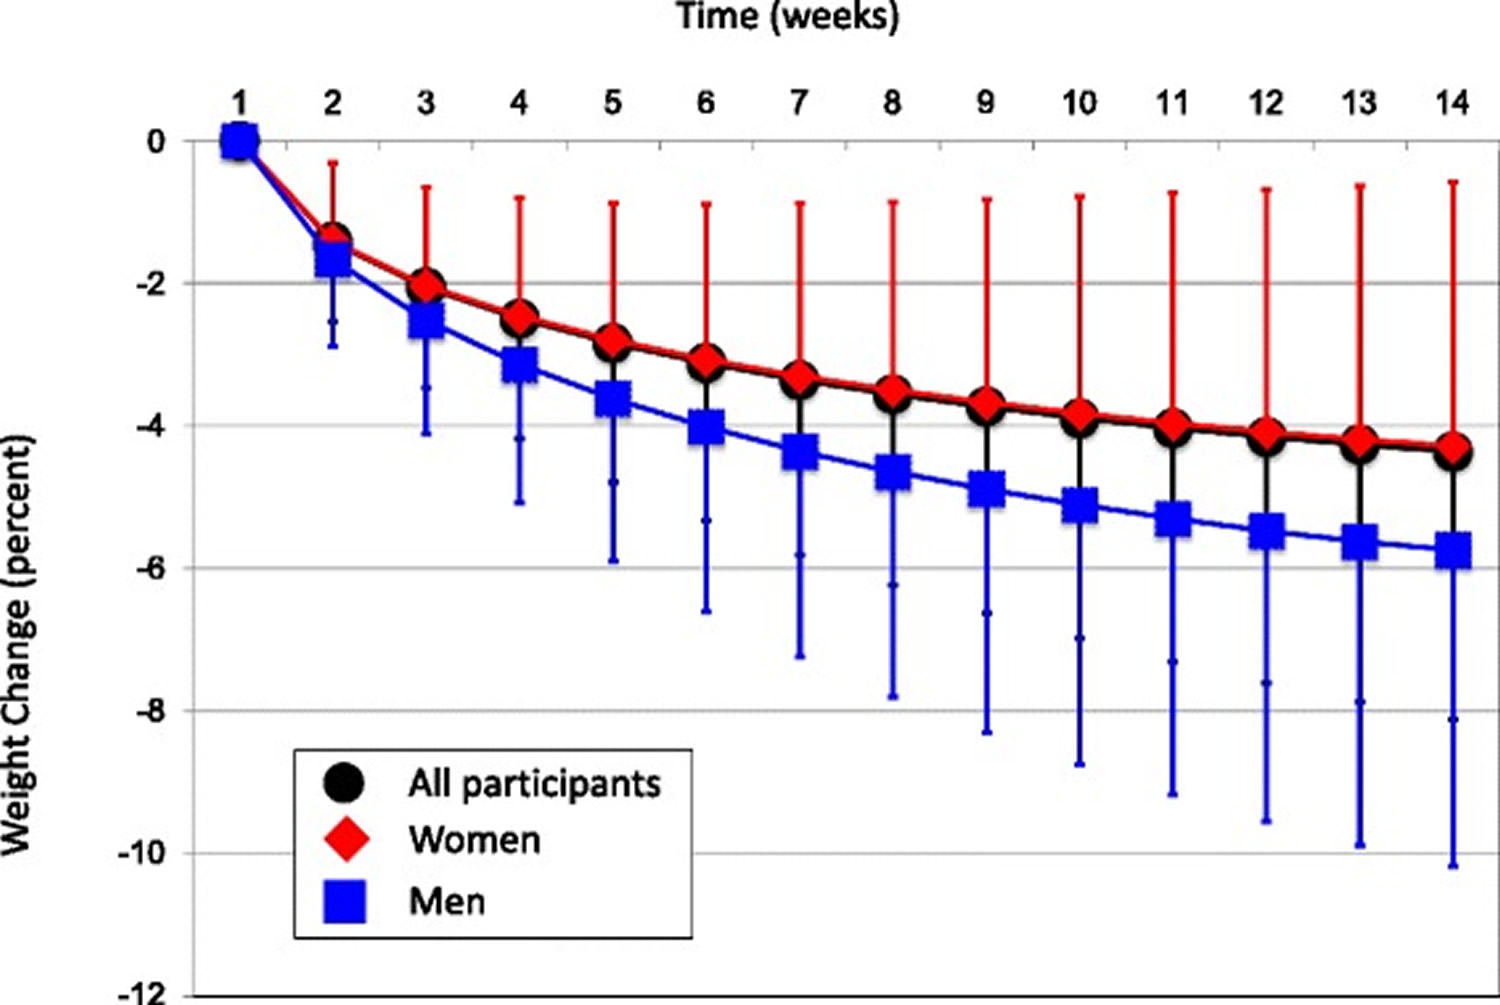
The average rate of weight change over the 14-week time window, in kg/week for the total population was −0.28 kg/week. Analysis of variance showed that men lost weight at a significantly faster rate (−0.47 versus −0.27 kg/week or 0.41 versus 0.31 %, respectively) than women, both in absolute and percent terms. Higher attenders lost weight at a significantly faster rate than did lower attenders (−0.48 versus −0.17 kg/week). These patterns were also apparent for percent weight loss −0.53 versus 0.19 %, respectively.
Figure 2 shows that the rate of weight loss decreased as the process of weight reduction proceeded from the start to end of the observation period. The slope for the rate of weight loss was steeper during weeks 1 to 7 than weeks 8 to 14 for the whole population and for men compared to women.
Figure 2. Mean cumulative weight change for the whole study population (n = 1,356,105), women (n = 1,288,966) and men (n = 67,139) over the 14-sessions of the observation period
Weight change in different BMI groups
39.8 % of participants had a BMI <30 kg/m2, 30.8 % between 30–34.9 kg/m2, 17.3 % between 35–39.9 kg/m2 and 12.2 % had a start BMI ≥40 kg/m2. Absolute weight loss increased with increasing BMI category. Absolute weight changes were −3.1, −3.9, −4.5, and −5.4 kg for the BMI categories <30 kg/m2, 30–34.9 kg/m2, 35–39.9 kg/m2 and ≥40 kg/m2, respectively. However, percent weight change was similar in each BMI category at −4.2, −4.5, −4.5 and −4.4 % for BMI categories <30 kg/m2, 30–34.9 kg/m2, 35–39.9 kg/m2and ≥40 kg/m2, respectively. The significance of these comparisons reflects a small effect size but a very large sample size.
Prediction of weight loss
The greatest predictors of percent weight loss were gender (men losing more than women), number of attendances and percent weight lost in the first week 2. Height and start BMI had considerably smaller impacts on percent weight lost at 3 months although due to the very large sample size factors for height and BMI were significant at p < 0.001. Age, height, gender and starting BMI all explained a very small amount of the variance in percent weight lost. In the case of gender it should be borne in mind that men accounted for 5 % of the sample. Attendance accounted for 44 % of the total variance in percent weight lost at the end of the 3-month period. Percent weight lost during the first week of attendance was also an important predictor of total weight lost, accounting for 11.3 % of the variance.
Thus, considering that men accounted for only 5 % of the sample, the two key predictors of percent weight loss by the end of the 3 month period were attendance and percent weight lost in the first week. However, week 1 weight loss was also related to attendance, since adding week 1 weight loss into the stepwise model first increased the percent variance explained by the first week’s weight loss to 19.6 % and decreased the percent of the variance due to attendance to 35.6 %. Since week 1 loss is included in the total loss, some correlation is inevitable unless there is complete compensation in later weeks. Therefore, week 1 loss is positively correlated with subsequent loss up to 3 months. Those who lost more weight in week 1 tended to attend longer. Both models explained the same total amounts of variance in percent weight lost.
Conclusions
In the Slimming World weight management programme, no foods are banned, so meals offer balance and variety and are family-friendly. The portion size from each food group will vary depending on which plan you follow. The “Body Magic” booklet they provide gives ideas to help you raise your activity levels. Meeting as a group can provide valuable support. Slimming World diet’s group meetings encourage members to share successes, ideas and recipes with each other, but they may not appeal to everyone. While the meal plans may lack some flexibility, they are generally balanced. Higher levels of attendance led to levels of weight loss known to be associated with significant clinical benefits, which on this scale may have an impact on public health. However, without learning about calories and portion sizes, you may struggle to make healthy choices once you’ve left the programme.
Another interesting outcome from this study was that the percentage weight lost in the first week and attendance were the greatest predictors of weight loss. These effects has also been found in other studies 8, 9. Attendance is discussed above. The relationship between percent weight lost in the first week and end weight loss is less clear. It may be that those who lose a greater percent of baseline weight in the first week are more motivated (either before they attend or as a consequence of their experiences in the first week), they may have familiarized themselves with the eating and activity programme to a greater extent, are simply on a consistent trajectory of greater weight loss or a combination of these variables. What is known is that certain behavior change techniques are associated with better weight outcomes 10. Evidence also suggests that greater engagement with components of commercial programmes that promote these behaviour changes is associated with better weight outcomes 11. Improving personalisation of multicomponent programmes to better match behavior change techniques to the requirements of specific individuals is likely to further improve engagement and weight outcomes. This should be a research priority for implementing weight management solutions in the general population and may improve the capacity of models to predict weight outcomes for different groups of people.
Slimming World diet Pros:
In the present review mean weight loss was 3.9 kg, 37.7 % of the whole population and 75.7 % of the higher attenders lost ≥5 % during the first 3 months of their engagement in the Slimming World weight management programme. Twenty three percent of higher attenders and 9.0 % of the whole population lost ≥10 % of their body weight. These data have confirmed that there are two simple basic predictors (attendance and weight loss in the first week) of weight loss that together account for 55 % of the variability in weight lost during the study period, which would be valuable indicators of the likelihood a person will lose ~5 % of their initial body weight during that time. Weight management programmes should therefore work to enhance initial weight loss and attendance because regardless of age or starting weight, if a person is able to attend 11 or more sessions in a 3 month period and is supported and encouraged to achieve good weight losses in their first week, they are likely to be successful in beginning their weight loss journey.
Slimming World diet Cons:
Slimming World doesn’t educate you about calories. Without learning about calories and portion sizes, you may struggle to keep the weight off in the long term when you come off the programme.
- Weight management: lifestyle services for overweight or obese adults. https://www.nice.org.uk/guidance/ph53[↩]
- Stubbs RJ, Morris L, Pallister C, Horgan G, Lavin JH. Weight outcomes audit in 1.3 million adults during their first 3 months’ attendance in a commercial weight management programme. BMC Public Health. 2015;15:882. doi:10.1186/s12889-015-2225-0. https://www.ncbi.nlm.nih.gov/pmc/articles/PMC4566482/[↩][↩][↩][↩][↩][↩][↩]
- https://www.slimmingworld.com/[↩]
- Stubbs RJ, Lavin JH. The challenges of implementing behaviour changes that lead to sustained weight management. Nutr Bull. 2013;38:5–22. doi: 10.1111/nbu.12002.[↩]
- Dombrowski SU, Sniehotta FF, Avenell A, Johnston M, MacLennan G, A-S V. Identifying active ingredients in complex behavioural interventions for obese adults with obesity-related co-morbidities or additional risk factors for co-morbidities: a systematic review. Health Psychol. 2012;6:7–32.[↩]
- Teixeira PJ, Silva MN, Mata J, Palmeira AL, Markland D. Motivation, self-determination, and long-term weight control. Int J Behav Nutr Phys Act. 2012;9:22. doi: 10.1186/1479-5868-9-22. https://www.ncbi.nlm.nih.gov/pmc/articles/PMC3312817/[↩]
- Stubbs RJ, Gail C, Whybrow S, Gilbert P: The evolutionary inevitability of obesity in modern society: implications for behavioral solutions to weight control in the general population. In: Obesity and Weight Management: Challenges, Practices and Health Implications. edn. Edited by Martinez MP, Robinson H. Hauppauge NY 11788-3619 USA: Novo Publishing. 2012.[↩]
- Postrach E, Aspalter R, Elbelt U, Koller M, Longin R, Schulzke JD, Valentini L. Determinants of successful weight loss after using a commercial web-based weight reduction program for six months: cohort study. J Med Internet Res. 2013;15:e219. doi: 10.2196/jmir.2648. https://www.ncbi.nlm.nih.gov/pmc/articles/PMC3806515/[↩]
- Hemmingsson E, Johansson K, Eriksson J, Sundstrom J, Neovius M, Marcus C. Weight loss and dropout during a commercial weight-loss program including a very-low-calorie diet, a low-calorie diet, or restricted normal food: observational cohort study. Am J Clin Nutr. 2012;96:953–961. doi: 10.3945/ajcn.112.038265. https://www.ncbi.nlm.nih.gov/pmc/articles/PMC3471207/[↩]
- Hartmann-Boyce J, Johns DJ, Jebb SA, Aveyard P, Behavioural Weight Management Review G Effect of behavioural techniques and delivery mode on effectiveness of weight management: systematic review, meta-analysis and meta-regression. Obes Rev. 2014;15:598–609. doi: 10.1111/obr.12165. https://www.ncbi.nlm.nih.gov/pmc/articles/PMC4237119/[↩]
- Neve MJ, Morgan PJ, Collins CE. Behavioural factors related with successful weight loss 15 months post-enrolment in a commercial web-based weight-loss programme. Public Health Nutr. 2012;15:1299–1309. doi: 10.1017/S1368980011003090. https://www.ncbi.nlm.nih.gov/pubmed/22122973[↩]


