
Contents
- Best Diet for Building Muscle
- How to lose belly fat
- How many calories do I need per day?
- How many calories should I eat to lose weight?
- What happens when your calories are too low?
- What should bodybuilders eat?
- How to build muscles faster?
- The science behind muscle building
- What builds muscle the most?
- Strength training (muscle-strengthening exercise)
Best Diet for Building Muscle
Body building focuses on building muscles for strength and to look good. However, bodybuilders size and shape depend largely on their genetic factors, which is why it is difficult for a naturally thin person to put on muscles. Lean muscle mass naturally diminishes with age. Your body fat percentage will increase over time if you don’t do anything to replace the lean muscle you lose over time. Strength training (see below) can help you preserve and enhance your muscle mass at any age. Lifting weights or doing physical activities such as push-ups, pull-ups and squats 2 or 3 days a week will help you build strong muscles. Only intense strength training, along with certain genes, can build large muscles. Like other kinds of physical activity, muscle-strengthening activities will help improve your health and also may help you control your weight by increasing the amount of energy-burning muscle.
An active lifestyle and exercise routine, along with eating healthy foods, is the best way to lose weight and lose belly fat. Losing belly fat is not easy like taking a pill for a headache. Getting rid of your belly fat require you to change your beliefs, habits and lifestyle with a lot of sweat and self discipline. It’s a lifelong habit and lifestyle you need to maintain for the rest of your life! Managing your weight is a life-long commitment – not just following a diet for a few weeks to drop pounds. That’s because losing weight isn’t necessarily the problem, it’s keeping it off longer term that is difficult. Popular media is full of fad diets and magic weight loss potions endorsed by celebrities and supported by personal success stories. While many of these diets may help you to lose weight while you’re following them, as soon as you resume your usual lifestyle, the weight starts to creep back on. Remember, if the strategies you’re putting into place to lose weight are not strategies that you’ll be able to follow for the rest of your life, chances are you’ll regain any weight you lose.
There is no single diet that works for everyone. To lose weight you’ll need to start with finding a way to eat fewer calories than you need. This phase is referred to as the “energy deficit” or “hypo-caloric phase” of weight loss. The essential components of weight loss, regardless of type of diet, are decreased energy intake, increased energy output through physical activity, behavioral modification and alterations in the environment that foster all of these 3 components 1.
Most American adults are overweight or obese. What is your current weight? Are you overweight or morbidly obese? Because there’s a huge difference between someone who’s 500 pounds then someone who’s 200 pounds who’s trying to lose belly fat. For someone who’s extremely obese to lose 300 pounds is a lot harder that for someone who’s overweight trying to lose 50 pounds. For example, a 5’4’’ woman weighing 250 pounds with a body mass index (BMI) of 43 kg/m² losing 5% of her body weight, or 12.5 pounds, will have an ending BMI of 41 kg/m². This amount of weight loss could take up to 25 weeks, if she loses one-half a pound per week. Weight loss of one-half a pound to two pounds per week is reasonable and offers the best chance for long-term success, but for extremely heavy people, this may take many months or years. If further weight reduction is necessary after 10% of initial body weight is lost, it can be attempted with an increased calorie deficit after prior weight loss has been maintained for several months. In contrast, obese people often expect to lose 25% to 35% of their initial weight over the first year of obesity treatment. Dieters often maintain these expectations even when they are repeatedly informed that their goals are likely unrealistic even with weight-loss drug treatment 2. It is important to note that one-half to one pound per week of fat loss is a realistic, achievable goal that will improve your health. Additionally, it is difficult to continue to lose weight at such a rapid pace. Because in the beginning (the first several days) of weight-loss from low-calorie diet is due to water loss. This is especially true for those on severely low-caloric diets (with deficits of 1,000 calories per day), those on ketogenic diets, and those on very low carbohydrate diets 3, 4. Ketogenic diets or keto diets consist of 60-80% of calorie intake from fats and limiting carbohydrate consumption to less than 10% of daily intake. While keto diets have been shown to aid in weight loss/fat loss, studies have shown the primary mechanism behind weight loss is due to hunger suppression. A high-fat diet can suppress appetite since it is highly satiating, leading to decreased caloric consumption. Additionally, many studies have shown that calorically matched diets with identical protein levels aid in fat loss just as successfully as a keto diet.
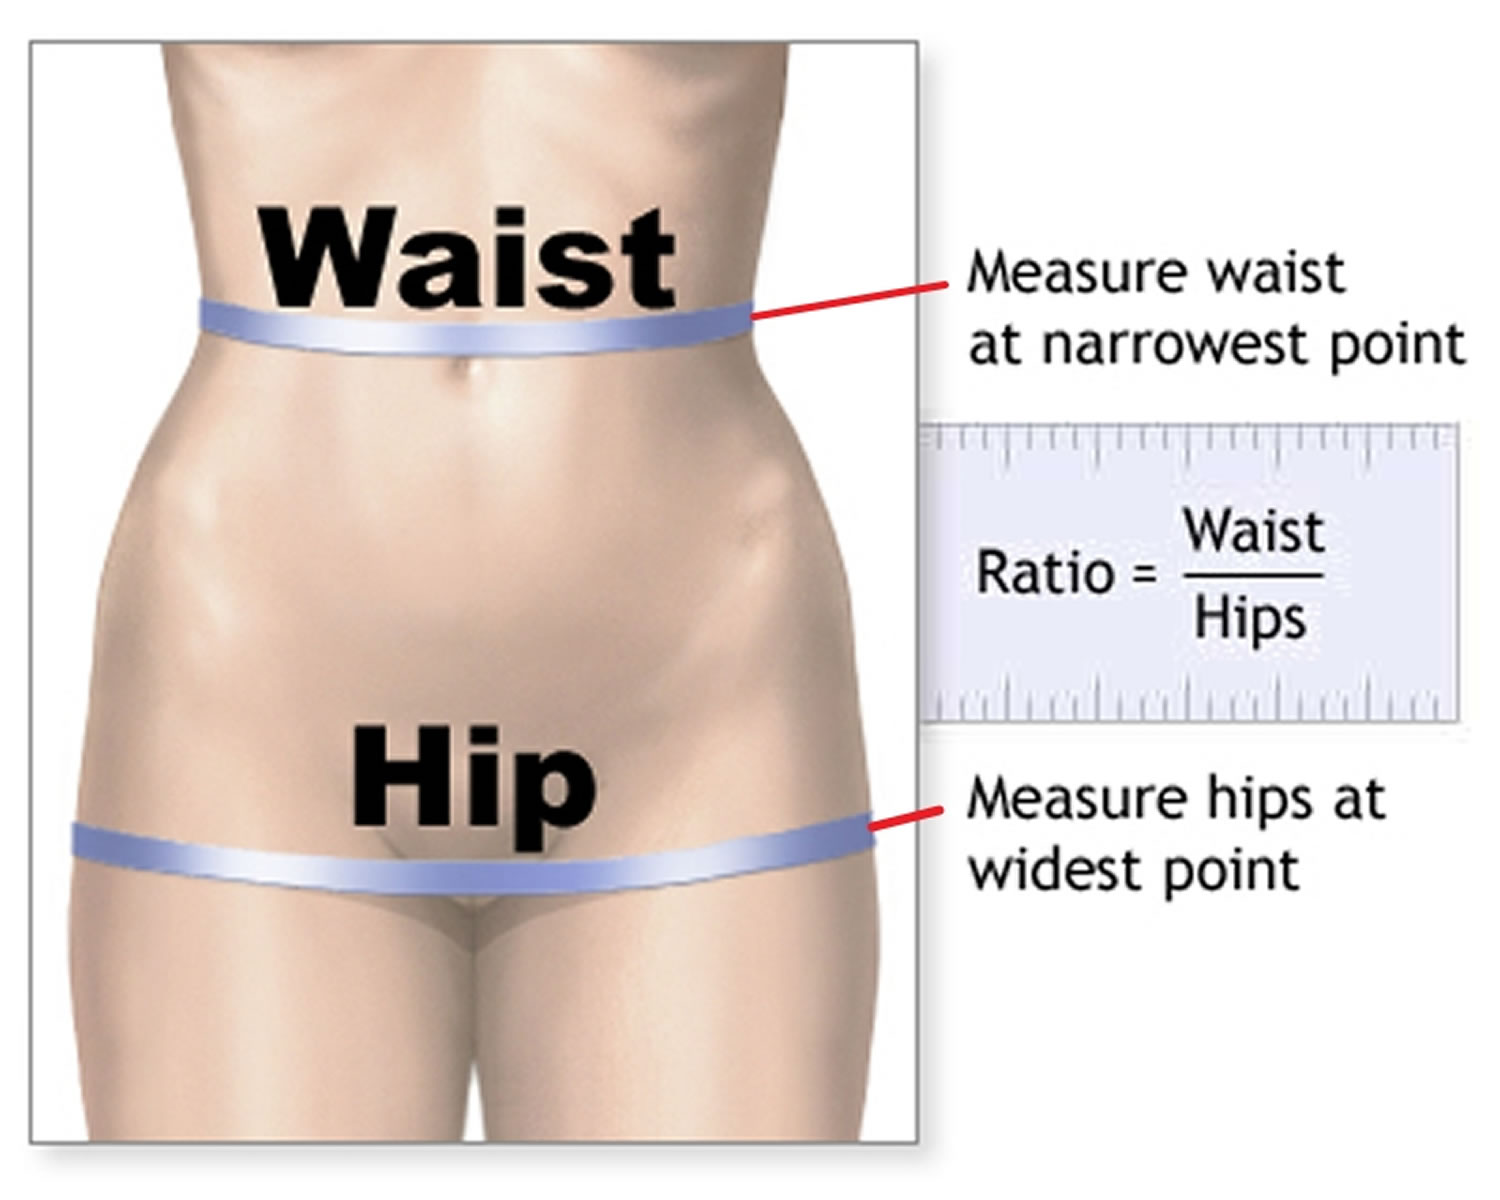
Doctors and dietitians assess weight by measuring your Body Mass Index (BMI), a ratio of weight to height. The BMI is defined as the body mass in kilogram (Kg) that is divided by the square of the body height in meter (m2), and is expressed in units of kg/m², resulting from mass in kilograms and height in meters (see Figure 1). You can also use an online BMI calculator (https://www.nhlbi.nih.gov/health/educational/lose_wt/BMI/bmicalc.htm). A BMI between 25 and 29.9 kg/m² is considered overweight, and obesity is a BMI of 30 kg/m² or higher. Waist to hip ratio should also be measured, in men more than 1:1 and women more than 0:8 is considered significant (see Figure 3). Being overweight or obese puts you at risk for a myriad of health problems, such as ischemic heart disease, high blood pressure, cardiovascular disease, fatty liver disease, breathing problems (obstructive sleep apnea, ventilatory failure and asthma), type 2 diabetes, gastro-esophageal reflux disease (GERD), gallstones, some cancers, Alzheimer’s disease, renal failure and other health problems 5. Ninety per cent of people with type 2 diabetes have a body mass index (BMI) greater than 23 kg/m² and conversely it is estimated that the attributable risk of obesity for diabetes is between 30% and 70% 6.
Many factors can contribute to your weight. These factors include your environment (cultural and societal), family history and genetics, metabolism (the way your body changes food and oxygen into energy), and behavior or habits. Other causes of obesity include reduced physical activity, insomnia, food habits, endocrine disorders, medications, food advertisements, and energy metabolism 7. Most common syndromes associated with obesity include Prader Willi syndrome and MC4R syndromes, others like fragile X, Bardet-Beidl syndrome, Wilson Turner congenital leptin deficiency, and Alstrom syndrome are also associated with obesity 7.
Furthermore, your current health will also affect your ability to do physical activity and do weights to build lean muscle mass. For example, do you have any medical conditions that could hinder you lifting weights and doing aerobic cardio workouts? Because if you have existing medical conditions you may not be able to do the hard workouts in the gym in order to build the muscle mass you wanted.
Another thing to consider is your ‘WHY’. Why are you wanting to build muscle and have six pack abs? Is it for you and you have decided to change your life to live a healthier life? Or are you trying to impress other people? Do you want to ‘look healthy’ or do want to be healthy? Because if you’re doing it for yourself, your chances of reaching your goal is easier than if you’re trying to impress others with your beauty (aesthetic) and your appearance (cosmetic). Your primary reason (your WHY) is to lose enough weight to improve or maintain your health. The aesthetic and cosmetic effects of weight loss are “extra benefits” or ‘icing on the cake’.
Lastly, how serious and motivated are you in wanting your dream outcome like building muscle and losing your belly fat to have six pack abs? Most people are not serious and not motivated to do the work like dieting, eating healthy, exercising and lifting heavy weights. Most people just want a quick solutions like popping weight loss pills, taking supplements and following fad diets (popular celebrity endorsed short term diets that sound too good to be true that can cause nutrient deficiencies, fatigue, weight regain and disordered eating) hoping these quick fix ineffective, unhealthy and dangerous products will give them their dream results. Furthermore, most people want six pack abs to impress others and have the false impression that having big muscles and six pack abs will solve their self esteem and confidence issues. In reality, to become successful and achieve your dream outcome, you’ll need to first change your mindset, your beliefs and become self-aware that anything in life requires sacrifice, time, hard work, effort, being resilient, self-confidence, high self-esteem, healthy diet and dedication.
To achieve your dream outcome like building muscle and losing your belly fat to have six pack abs you’ll have to embrace challenges, views failures as opportunities for growth, and believe in your ability to achieve your dream. It involves setting clear goals (e..g, how much weight you have to lose, how many calories you have to remove from your diet), maintaining a positive outlook, and persisting through obstacles with resilience and determination.
Adults BMI calculator
Children and teens BMI calculator
Figure 1. Body Mass Index calculator
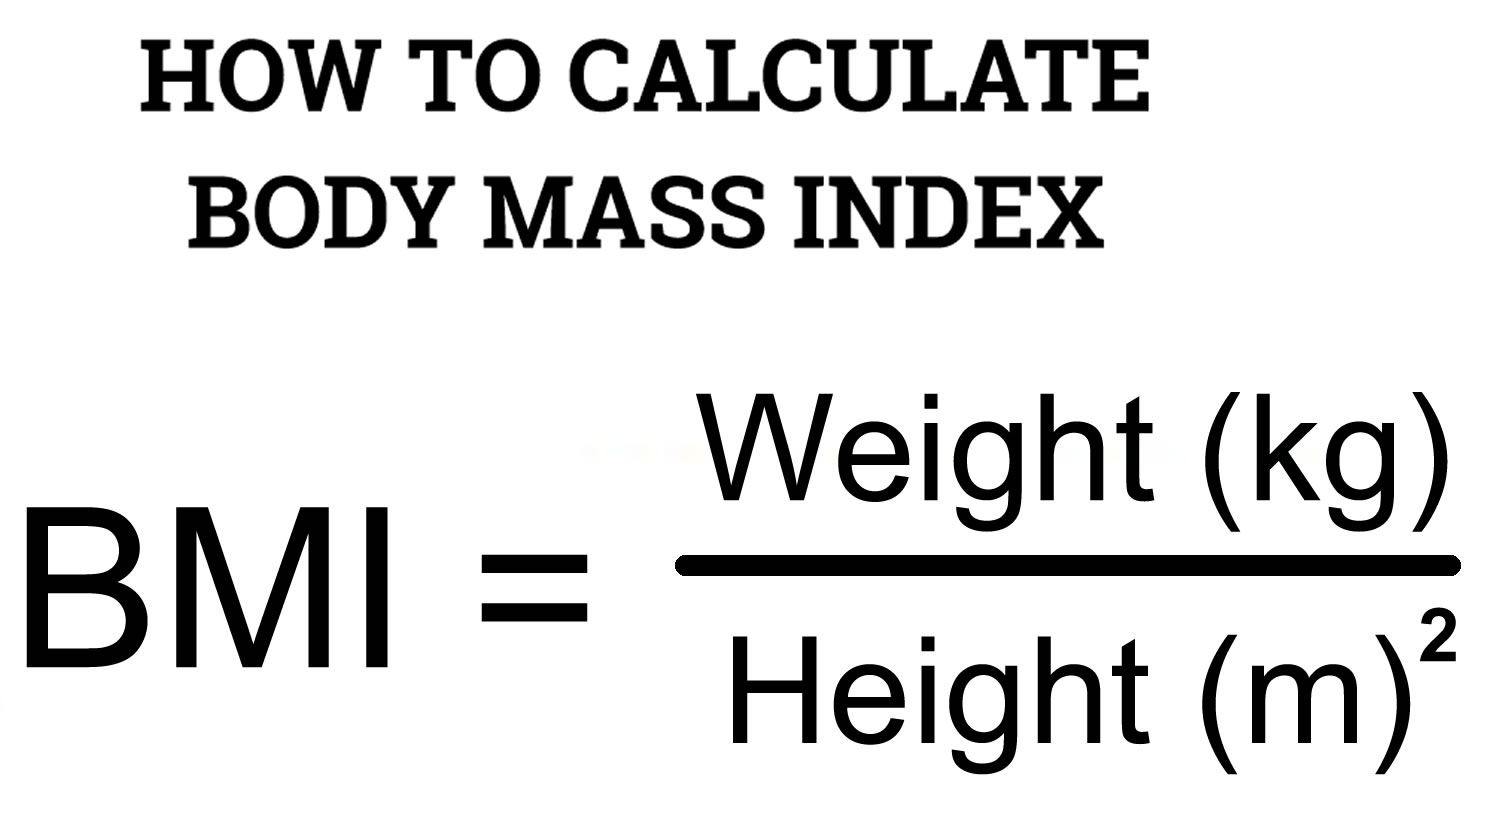
Table 1. Body Mass Index range
| BMI Range (kg/m²) | Weight class |
| Less than 16.5 kg/m² | Severely Underweight |
| 16.5 – 18.5 kg/m² | Underweight |
| 18.5 – 25 kg/m² | Normal |
| 25 – 30 kg/m² | Overweight |
| 30 – 34.9 kg/m² | Obese, Class 1 |
| 35 – 39.9 kg/m² | Obese, Class 2 |
| More than 40 kg/m² | Obese, Class 3 (Morbidly Obese) |
Figure 2. Body Mass Index chart
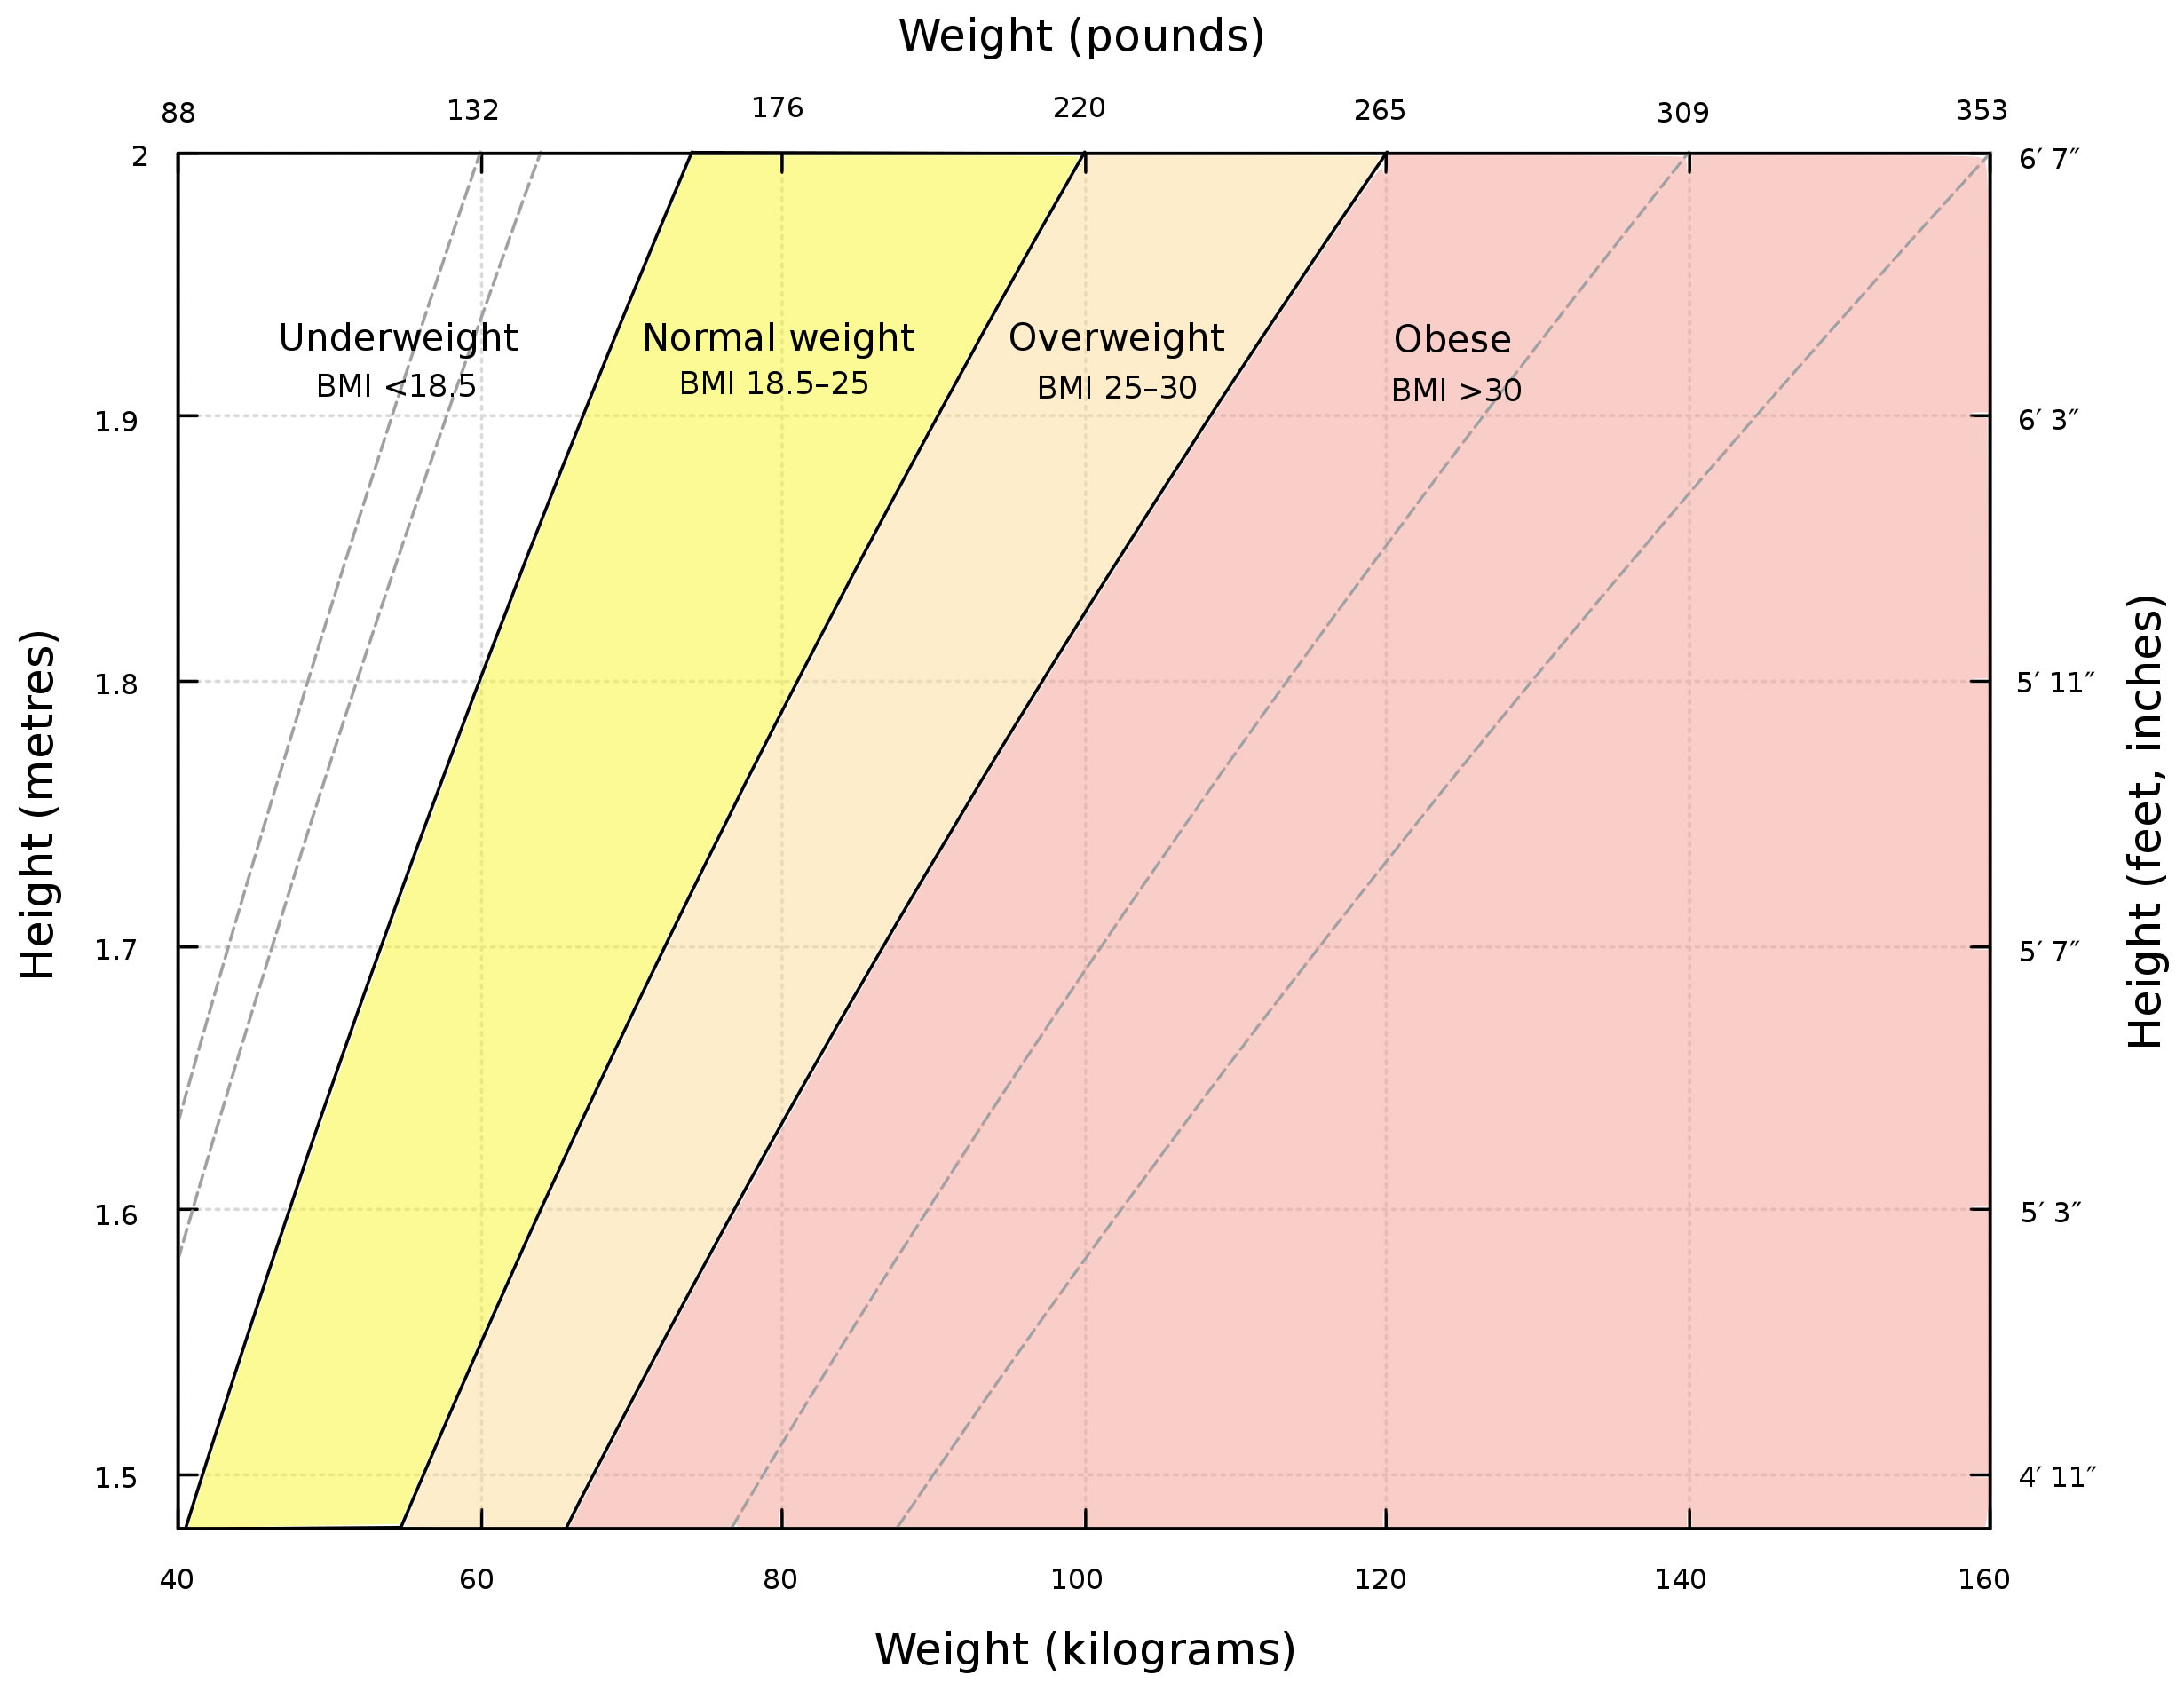
Footnote: A graph of body mass index (BMI) as a function of body mass and body height. The dashed lines represent subdivisions within a major class. The Body mass index scale show all people with high level of muscles also overweight or obese. This is because the BMI scale is designed in accordance to the body fat levels not body muscles mass levels. Therefore, BMI measure is not an accurate measure for muscular individual.
Figure 3. Waist to hip ratio
How to lose belly fat
To lose weight you’ll need to start with finding a way to eat fewer calories than you need. A calorie is a unit of energy, which is in the foods and drinks you consume. Scientifically, the calorie (a unit of energy) was originally defined as the amount of heat required at a pressure of 1 standard atmosphere to raise the temperature of 1 gram of water 1° Celsius. When you hear something contains 100 calories, it’s a way of describing how much energy your body could get from eating or drinking it. However, since calories are too small of a measurement to use when discussing nutrition and exercise, kilocalorie (kcal) measurements are used instead and the term is interchangeable with calories. Kilocalorie (kcal) is a unit of measurement for energy that is equivalent to 1,000 calories. Also,1 kcal or 1 kilocalorie is equivalent to 1 large Calorie (with an uppercase C) or 1,000 calories.
Some countries use kilojoules (kJ) to measure how much energy people get from consuming a food or drink.
- 1 calorie = 4.184 joule
- 1 kilocalorie (kcal) = 4.184 kilojoules (kJ)
- 1 Calorie (1,000 calories) = 4.184 kilojoules (kJ)
Here’s how many calories are in your foods and drinks 8:
- 1 gram of carbohydrate = 4 calories
- 1 gram of protein = 4 calories
- 1 gram of fat = 9 calories
- 1 gram of water = 0 calorie
Most foods and drinks contain calories. You can find out how many calories are in a food by looking at the nutrition facts label. The label also will describe the components of the food such as how many grams of carbohydrate, protein, and fat it contains.
That means if you know how many grams of each one are in a food, you can calculate the total calories. You would multiply the number of grams by the number of calories in a gram of that food component. For example, if a serving of potato chips (about 20 chips) has 10 grams of fat, 90 calories are from fat. That’s 10 grams x 9 calories per gram. Some foods, such as lettuce, contain few calories (1 cup of shredded lettuce has less than 10 calories). Other foods, like peanuts, contain a lot of calories (½ cup of peanuts has 427 calories).
There are many unhealthy misconceptions about weight loss. There are no magical foods or ways to combine foods that melt away excess body fat. To reduce your weight, you’ll have to reduce your calorie intake.
Calories aren’t bad for you. Your body needs calories for energy. Your body uses energy (calorie) for everything you do from breathing and sleeping to exercising. Some people mistakenly believe they have to burn off all the calories they eat or they will gain weight. This isn’t true. Your body needs some calories just to operate — to keep your heart beating and your lungs breathing. When you eat, you’re replacing the energy (calorie) you’ve used, which helps you to maintain a healthy weight. But eating more calories than your body needs and not burning enough of them off through activity can lead to weight gain and other health problems such as type 2 diabetes, heart disease, high blood pressure, certain cancers (e.g., uterine, gallbladder, kidney, liver, and colon cancers) and death 9, 10, 1, 11.
Being overweight or obese is the result of an energy imbalance between your daily energy intake and your energy expenditure resulting in excessive weight gain 12. The amount of energy or calories you get from food and drinks (energy IN) is balanced with the energy your body uses for things like breathing, digesting, and being physically active (energy OUT):
- The same amount of energy IN and energy OUT over time = weight stays the same (Energy Balance)
- More energy IN than OUT over time = Weight Gain
- More energy OUT than IN over time = Weight Loss
In order to lose weight, energy expenditures must exceed energy intake. To lose weight, most people need to reduce the number of calories they get from food and beverages (energy IN) and increase their physical activity (energy OUT). To achieve this imbalance, you can decrease energy intake, increase energy expenditures or combine a decrease in intake with an increase in expenditures. Being physically active and eating fewer calories will help you lose weight and keep the weight off over time. As a result, most weight loss recommendations advise combining a low caloric diet with an exercise program in order to achieve a significant energy deficit 13. A long-standing consistent observation is that regular exercise by itself is prescribed in small to moderate amounts resulting in modest weight loss or in some cases weight gain 14.
Weight loss of about 1 to 1 ½ pounds per week is considered reasonable and more likely to be maintained. For a weight loss of 1 to 1 ½ pounds per week, daily intake should be reduced by 500 to 750 calories. In general 15:
- Eating plans that contain 1,200–1,500 calories each day will help most women lose weight safely.
- Eating plans that contain 1,500–1,800 calories each day are suitable for men and for women who weigh more or who exercise regularly.
Very low calorie diets of fewer than 800 calories per day should not be used unless you are being monitored by your doctor. Because dieting can be harmful because your body responds to these periods of semi-starvation by lowering its metabolic rate. When you lose weight too quickly, you lose fat and muscle. Muscle burns kilojoules, but fat doesn’t. So, when you stop dieting and return to your usual habits, your body will burn even fewer calories than before because the relative amount of muscle in your body has decreased and your metabolic rate is slower. This kind of eating pattern can also affect your general health – just one cycle of weight loss and weight gain can contribute to an increased risk of coronary heart disease (regardless of your body fat levels). That’s why it’s more important to be able to maintain weight loss.
Energy balance is also important for maintaining a healthy weight. To maintain a healthy weight, your energy IN and OUT don’t have to balance exactly every day. It’s the balance over time that helps you maintain a healthy weight.
You can reach and maintain a healthy weight if you:
- Follow a healthy diet, and if you are overweight or obese, reduce your daily intake by 500 calories for weight loss
- Are physically active
- Limit the time you spend being physically inactive
While people vary quite a bit in the amount of physical activity (exercise) they need for weight control, many can maintain their weight by doing 150 to 300 minutes (2 ½ to 5 hours) a week of moderate-intensity activity such as brisk walking. People who want to lose a large amount of weight (more than 5 percent of their body weight) and people who want to keep off the weight that they’ve lost may need to be physically active for more than 300 minutes of moderate-intensity activity each week.
You now know the basics about calories – the key to weight loss for most people is simply finding the right combination of exercise, healthy foods and cutting back on portions will help you lose those extra pounds. No fad diet required. In other words, eat healthily, watch your portions and get moving more. By losing just a few pounds with healthy eating and exercise, you’ll start to feel better. You’ll have more energy. To prevent the weight creeping back on, you need to keep going with the healthy habits you’ve formed.
How many calories do I need per day?
The total number of calories you need each day varies depends on a number of factors, namely your age, sex, height, weight, level of physical activity, and pregnancy or lactation status. According to the Dietary Guidelines for Americans, American female adult estimated calorie needs range from 1,600 to 2,400 calories per day and for males 2,000 to 3,000 calories per day 16. The average, healthy, adult, American male consumes approximately 2,800 calories per day, and the average female about 1,800 calories 1. But most people need different amounts of calories based on how their bodies work, how active they are and any weight management goals. And if you want to lose weight you’ll have to reduce your calorie intake.
Here is a general estimate of calories you need each day:
- Sedentary lifestyle (little to no exercise)
- Women: 1,800 to 2,400 calories
- Men: 2,200 to 3,000 calories
- Moderately active lifestyle (engages in moderate exercise/physical activity like walking or light yard work:
- Women: 2,000 to 2,600 calories
- Men: 2,400 to 2,800 calories
- Very active lifestyle (engages in hard exercise/physical activity, or has a physically demanding job):
- Women: 2,200 to 2,800 calories
- Men: 2,800 to 3,200 calories
These are just general guidelines. It’s essential to consult with a nutritionist or a doctor who can give personalized advice based on your specific situation. Remember, it’s not just the quantity but also the quality of calories that matters for overall health.
Obesity results from the accumulation of excessive body fat, which is stored as adipose tissue. An energy deficit of approximately 3,500 calories is required to lose one pound of fat. However, there are several factors that can influence this particular number. These include compensatory changes in your resting metabolism (basal metabolic rate [BMR]), the energy cost of work, and discretionary physical activity, which can sometimes alter this figure by 100 to 200 calories. Your basal metabolic rate (BMR) also known as resting metabolic rate (RMR) is the number of calories your body burns while performing basic life-sustaining functions, such as breathing and keeping your heart beating. Your basal metabolic rate (BMR) is typically between 1,000 and 2,000 calories per day.
How to calculate calories you need for weight loss
You can calculate your basal metabolic rate (BMR) or resting metabolic rate (RMR) using the Mifflin-St Jeor equation 17, which is considered more accurate than the Harris-Benedict equation, especially for lean people. According to the Academy of Nutrition and Dietetics Evidence Analysis Library (EAL), the Mifflin-St. Jeor equation accurately predicted resting metabolic rate (RMR) using actual body weight within +/- 10% of measured RMR in 70% of obese individuals 18. Of the remaining 30%, 9% were overestimations and 21% were underestimations. The individual error range was a maximum overestimate of 15% to a maximum underestimate of 20%” 19. While the Harris-Benedict and WHO equations are often used in clinical practice with reasonable accuracy, results have been mixed regarding their applications to individuals who are overweight or obese 1.
The Mifflin-St Jeor formula for calculating your basal metabolic rate (BMR) or resting metabolic rate (RMR):
- Males Basal metabolic rate [BMR] (kcal/day) = (10 X weight in kilograms) + (6.25 X height in centimeters) – (5 X age in years) + 5 (kcal/day)
- Females Basal metabolic rate [BMR] (kcal/day) = (10 X weight in kilograms) + (6.25 X height in centimeters) – (5 X age in years) – 161 (kcal/day)
You can also use the free online Basal Metabolic Rate (BMR) calculator here: https://www.nasm.org/resources/calorie-calculator
Or the Body Weight Planner (https://www.niddk.nih.gov/health-information/weight-management/body-weight-planner).
The Body Weight Planner allows you to make personalized calorie and physical activity plans to reach a goal weight within a specific time period and to maintain it afterwards.
The Basal Metabolic Rate (BMR) calculator factor in your activity levels, overall goals, and calorie usage to help you craft a weight-loss plan.
Once you have found your basal metabolic rate (BMR), multiply your BMR by your Physical Activity Levels to provide a baseline daily caloric level for weight maintenance:
- Sedentary (light physical activity associated with typical day-to-day life) = 1
- Low Active (walking about 1.5 to 3 miles per day at 3 to 4 miles per hour, in addition to the light physical activity associated with typical day-to-day life), For males = 1.11 and females = 1.20
- Active (walking more than 3 miles per day at 3 to 4 miles per hour, in addition to light physical activity associated with typical day-to-day life: 60 minutes of at least moderate intensity physical activity). For males = 1.25 and females = 1.27
- Very Active (walking more than 7.5 miles per day at 3 to 4 miles per hour, in addition to light physical activity associated with typical day-to-day life: 60 minutes of at least moderate to vigorous intensity physical activity). For males = 1.48 and females = 1.45
Your Total Daily Energy Expenditure (TDEE) gives you the estimated number of calories you need to maintain your current weight based on your activity level.
To find your Total Daily Energy Expenditure (TDEE) multiply your Basal Metabolic Rate (BMR) by your Physical Activity Levels
For example:
- Sedentary (little to no exercise): BMR x 1
- Lightly active (walking about 1.5 to 3 miles per day at 3 to 4 miles per hour, in addition to the light physical activity associated with typical day-to-day life): BMR x For males = 1.11 and females = 1.20
- Moderately active (moderate exercise/sports 3-5 days/week): BMR x 1.55
- Very active (walking more than 7.5 miles per day at 3 to 4 miles per hour, in addition to light physical activity associated with typical day-to-day life: 60 minutes of at least moderate to vigorous intensity physical activity): BMR x For males = 1.48 and females = 1.45
- Super active (very hard exercise & physical job or 2x training): BMR x 1.9
You can increase your basal metabolic rate (BMR) by:
- Exercising more, especially interval training
- Weight training to build muscle mass
- Eating fat-burning foods
- Getting enough sleep
After calculating your basal metabolic rate (BMR) or resting metabolic rate (RMR), your RMR should be multiplied by an appropriate physical activity factor to provide your baseline daily caloric level for weight maintenance. Once your baseline caloric level is known, your recommended calorie intake should be reduced to facilitate your weight loss.
If you want to lose weight, subtract 500 to 1000 calories from your Total Daily Energy Expenditure (TDEE) to get a daily intake goal. For weight gain, add extra calories. Reducing your calorie intake by 500 calories is a common strategy to yield a weight loss of approximately one pound per week, although reductions of up to 750 calories per day are sometimes used 20.
Another approach is to reduce your current caloric intake by 30% 20. Diets that reduce caloric intake relative to energy expenditure result in weight loss, regardless of macronutrient composition 20.
Here’s how to estimate how long it will take to reach your goal:
Jessie’s current weight is 150 lbs. She wants to lose 20 lbs.
- 150lbs – 20lbs = 130lbs.
- 20lbs loss at 2lbs/week = 10 weeks.
- It will take Jessie about 10 week to lose the weight.
Remember, these are general guidelines only. It’s crucial to monitor your progress and adjust as necessary. Consulting with a nutritionist or health professional is always recommended for personalized advice.
How many calories should I eat to lose weight?
For a healthy and sustainable weight loss journey, it’s typically recommended you not to shed more than 2 pounds of fat weekly. This translates to a daily calorie deficit of 1,000 calories. It’s essential to note that when weight loss surpasses 2lbs within a week, it’s often water weight being lost, not just fat.
For those leading a more sedentary lifestyle, aiming to lose 1lb per week is a good starting point. This means creating a daily calorie deficit of 500 calories.
On the other hand, those who are more active naturally have higher daily calorie needs. So, when they’re trying to lose weight, they can afford to eat a bit more since their maintenance calories are already elevated.
For such individuals, aiming for a daily calorie deficit of 500-1,000 calories is realistic, potentially leading to a weight loss rate of up to 2lbs weekly.
What happens when your calories are too low?
Consuming calories below your body’s needs for an extended period can lead to various physiological and psychological consequences. Here’s what can happen when your caloric intake is too low:
- Slower metabolism: Your body might slow down its metabolic rate as a defense mechanism to conserve energy. This can make weight loss harder over time and weight regain more likely once normal eating resumes.
- Nutrient deficiencies: Low calorie intake can lead to inadequate intake of essential vitamins and minerals. Over time, this can result in conditions like anemia, osteoporosis, and impaired immune function.
- Loss of muscle mass: Your body might start breaking down muscle tissue for energy, especially if protein intake is inadequate. This can further slow down metabolism and lead to weakness.
- Hormonal changes: Reduced calorie intake can affect hormone levels, leading to disruptions in menstrual cycles for women, reduced bone density, and other hormonal imbalances.
- Reduced energy and fatigue: You might feel constantly tired or find it difficult to concentrate.
- Mood changes: Low caloric intake can influence mood. This can result in irritability, depression, or anxiety.
- Impaired Immune Function: Your body might become more susceptible to infections due to a weakened immune system.
- Hair and skin problems: You might experience hair loss, dry skin, or brittle nails due to inadequate nutrient intake.
- Digestive problems: Constipation or other digestive issues can occur as a result of reduced fiber and fluid intake.
- Fertility issues: Low calorie and nutrient intake can lead to fertility problems in both men and women.
- Cardiovascular problems: Chronic low calorie intake can affect heart health, leading to low blood pressure, irregular heart rhythms, or other cardiovascular issues.
- Increased risk of gallstones: Rapid weight loss from very low-calorie diets can lead to the development of gallstones.
What should bodybuilders eat?
Most of body builders can meet all of their nutritional needs from food. Tips for making healthy eating choices:
- Eat a variety of foods. Eat a variety of foods from each of the five food groups daily. Healthy choices include fruits, vegetables, whole grains, protein foods, and fat-free or low-fat dairy. Foods are grouped together because they provide similar amounts of key nutrients. For example, key nutrients of the milk, yoghurt, cheese and alternatives group include calcium and protein, while the fruit group is a good source of vitamins, minerals, antioxidants. As a bonus, choosing a variety of foods will help to make your meals interesting, so that you don’t get bored with your diet.
- Eat fruit instead of drinking it. Eating fruit is linked to a reduced risk of several health conditions, but fruit juices are more likely to spike blood sugar levels.
- Add healthy fats. Healthy fats like monounsaturated and polyunsaturated fats can help lower cholesterol and protect your heart. You can find healthy fats in foods like olive oil, nuts, avocados, and some types of fish.
- Drink water. Sipping water throughout the day can help keep you full and hydrated. Sometimes thirst is mistaken for hunger.
- Reduce added sugar. Too much added sugar in your diet can contribute to weight gain, obesity, type 2 diabetes, and heart disease.
- Chew your food well. Chewing your food well can help you make healthier food choices.
- Sit at the table to eat. Sitting at the table to eat can help you focus on your food and internal cues for hunger or fullness.
Some bodybuilders and athletes use dietary supplements to try to improve their strength, muscle mass, and energy. However, many of these types of products contain harmful ingredients. Also, for some substances, including glutamine, choline, methoxyisoflavone, quercetin, zinc/magnesium aspartate, nitric oxide, and L-arginine, there’s no clear evidence that they improve athletic performance.
Carbohydrates
Carbohydrates are your body’s fuel. Carbohydrates also play roles in gut health and immune function 21. For healthy children and adults, carbohydrates should make up approximately 45 to 65% of energy intake based on the minimum required glucose for brain function 21. However, some carbohydrates are more nutritious than others.
Foods that contain the most carbohydrates include:
- Fruit.
- Vegetables, especially potatoes and corn.
- Legumes, including dried beans, peas and lentils.
- Grains.
- Bread.
- Breakfast cereal.
- Rice, pasta and noodles.
- Low-fat milk and yoghurt.
These foods are rich in vitamins, minerals and antioxidants and are generally low in fat. This makes them well suited to a healthy eating plan. Some are excellent sources of dietary fibre, including wholegrain varieties, legumes, fruit and vegetables.
Foods with lots of added sugar like soft drinks, alcohol and sweets are another source of carbohydrates, but these contribute extra kilojoules with few vitamins and minerals.
Optimal carbohydrate intake should consist of high fiber, nutrient-dense whole grains, fruits, vegetables and legumes, without the added sugar 8.
The Dietary Guidelines for Americans recommends that carbohydrates should make up 45 to 65% of one’s daily calories 22. To calculate how many grams of carbohydrates you need, multiply your daily calorie requirements by 0.45 and 0.65 to obtain calories from carbohydrates.
- (A) 0.45 x 2000 = 900 calories
- (B) 0.65 x 2000 = 1300 calories
Divide answers in step 1 by 4 since there are 4 calories per 1 gram of carbohydrate
- (A) 900/4 = 225g of carbohydrate
- (B) 1300/4 = 325g of carbohydrate
Carbohydrates are eaten in the form of simple carbohydrates, like monosaccharides and disaccharides, or complex carbohydrates, like oligosaccharides and polysaccharides 21. Monosaccharides are the basic building blocks of all carbohydrates and include glucose, fructose, and galactose. Glucose is the simplest type of carbohydrates and is the major source of energy for your body’s cells 21. Glycogen is the storage form of glucose in animals and is present in the liver and muscle, but there is little to none in the diet.
Disaccharides contain two sugar units and include lactose, sucrose, and maltose. Lactose is a carbohydrate found in milk, and sucrose is basic table sugar.
Oligosaccharides consist of 3 to 10 sugar units and include raffinose and stachyose, which are in legumes.
Polysaccharides include greater than ten sugar units and consist of starches, glycogen, and fibers, like pectin and cellulose. Starches like amylose are in grains, starchy vegetables, and legumes and consist of glucose monomers.
Fibers are plant polysaccharides like pectin and cellulose found in whole grains, fruits, vegetables, and legumes but are not digestible by humans. However, fibers play a major role in gut health and function and can be digested by microbiota (microorganisms) in the large intestine 23. The recommended fiber intake is greater than 38 g for men and 25 g for women, which is the intake that research has observed to lower the risk of coronary artery disease (a heart disease that affects the main blood vessels that supply blood to the heart).
Does eating more carbohydrates cause body fat?
If carbohydrates control body fat, then you would expect that low-carb diets are less “fattening” than higher carbohydrate diets. This means that low carb diets should add less body fat to people than higher carbohydrate diets do. This is true in the most basic sense in that when you overconsume calories (Calorie IN more than Calorie OUT). You do store at least some of the excess calories as body fat. But studies don’t support that view that low-carb diets are less “fattening” than higher carbohydrate diets. It turns out that excess carbohydrates are relatively difficult to store as body fat, at least compared to fats.
In one study where people were overfed carbohydrates and fats, fats were stored ~20% more efficiently than carbs 24. In another study where people were overfed carbohydrates, there was a very minimal conversion of carbohydrates to stored body fat, indicating that it is very inefficient to turn carbohydrates into body fat 25.
Furthermore, low-carb diets are not necessary for weight loss, nor are they alone sufficient for weight loss. Carbs don’t necessarily control body fat after all. Over the last several decades there have been dozens of scientific studies comparing low-carb diets to other diets to examine their efficacy 26. There are plenty of studies whose results do not support the idea that carbohydrates per se control body fat. For example, in one study of 4,451 people, there was a lower risk of being obese or overweight if you consumed a moderate to high carbohydrate diet when compared to a lower carbohydrate diet 27. That study found consuming a low-carbohydrate (approximately <47% energy) diet is associated with greater likelihood of being overweight or obese among healthy, free-living adults 27.
Another study found that there was no real association between BMI and daily carbohydrate intake, suggesting that if carbohydrates did control body fat, it would be a relatively minor effect 28.
Ultimately, science tells us that carbohydrates are not more fattening than fats; in fact, it would make more sense to eat a few too many carbohydrates than a few too many fats. Indeed, this is what you see when you follow people who over-consume carbohydrates versus fats – they tend to gain a little less body fat 29.
Are low-carb diets are better for weight loss than other diets?
The majority of the clinical trials that have examined whether low-carb diets are better than other diets for fat loss show that low-carb diets result in the same amount of weight loss as other diets 30.
When you tightly control people’s diets and measure virtually every part of their metabolism, it is apparent that low-carb diets are not better for weight loss 31. They might be slightly worse for body fat loss than low-fat diets. This holds true even if you go to very low levels of carbohydrate intake 32.
Furthermore, when people adopt a low-carb diet in the real world and over more extended periods, they still see very similar results for weight-loss.
The primary findings from these studies have been:
- Low-carb diets are not necessary for weight loss. Virtually all types of diets can and do result in weight loss when there is a negative energy balance (i.e. an energy deficit).
- From a body fat mass perspective, low-carb diets may result in inferior fat mass reductions in shorter term diets.
- Adherence to low-carb diets is no better or worse compared to most other forms of dieting.
- Low-carb diets often result in more immediate water weight loss and glycogen depletion than moderate-carb diets.
In conclusion, although the idea that carbohydrates control body fat has been popular in the media, there is little scientific evidence to support it. Unless you have extreme levels of carbohydrate intake (Calorie IN more than Calorie OUT), there is no real link between carbohydrates and body fat. From scientific studies, it turns out that carbohydrates are less fattening than dietary fat. When followed in the real-world, low-carb diets can be useful for weight loss, but they are not any more effective than other low calorie diets.
Very low-carb diets can often result in a state called ketosis. This occurs when dietary carbohydrates are low enough, or fat is high enough, such that the body begins producing ketones at a level that allows them to accumulate.
It is often touted that being in a state of ketosis increases fat loss, but there is no good evidence to suggest that is true. In fact, one recent study showed that fat loss is similar, if not inferior, in a state of ketosis 33. If you choose to adopt a low-carb diet, ketosis may be a result of that process, but should not be the primary focus.
Furthermore, there is some evidence that if someone is an athlete engaging in higher intensity, higher volume exercise, ketogenic diets should be avoided as they can impair performance 34, 35.
Very low carbohydrate diets can come with unwanted and potentially dangerous side effects when followed for extended periods. For example, cardiac dysfunction, impairment of physical activity, hair loss, nausea, digestive issues, and lipid abnormalities are all common side effects.
How many carbs should you eat a day to lose weight?
For otherwise healthy individuals with no underlying medical conditions, there does not appear to be a truly minimal amount of carbohydrates that need to be consumed daily.
Your daily recommendations for carb intake are based on two primary criteria:
- Your total daily calorie requirements (your basal metabolic rate [BMR] or resting metabolic rate [RMR])
- Your intensity or volume of physical activity.
Higher total daily calorie needs come with higher recommendations for total daily carb intake, while lower total daily calorie needs come with lower recommendations. Furthermore, as your body relies heavily on carbohydrate intake for moderate to higher intensity physical activity, carb recommendations will increase as your total volume and intensity of activity increase.
Your total daily calorie intake can be estimated using the Mifflin-St Jeor formula above. However, there are also online tools that can be used that can help you determine how many calories you should consume daily. Such as the free online Basal Metabolic Rate (BMR) calculator here: https://www.nasm.org/resources/calorie-calculator
Or the Body Weight Planner (https://www.niddk.nih.gov/health-information/weight-management/body-weight-planner).
The Body Weight Planner allows you to make personalized calorie and physical activity plans to reach a goal weight within a specific time period and to maintain it afterwards.
After that, the number of carbs grams per unit of body weight can be estimated based on current guidelines from the American College of Sports Medicine and the Academy of Nutrition and Dietetics. These recommendations are generalized as follows 36:
- Light Activity: 3-5 g carb/kg/day
- Moderate Activity (1 hour of moderate exercise): 5-7 g carb/kg/day
- High Activity (1-3 hours of intense, endurance exercise): 6-10 g carb/kg/day
- Very High (4-5 hours of intense, endurance exercise): 8-12 g carb/kg/day
It is often recommended that more moderate carbohydrate intakes (1 to 3 g/kg/day) are consumed even in the context of weight loss.
Your muscles need carbs to fuel and recover from your workouts. At least 40% of your total daily calories should come from good carbs. Eat carbs 60 to 90 minutes prior to your workout, and then eat a combo of carbs and protein (2:1 ratio) within an hour after you finish.
Although many nutrition labels count all carbohydrates toward calorie intake, the truth is not all carbohydrates provide a meaningful number of calories as the human body does not digest and extract energy from all forms of carbohydrates.
In most situations, dietary fiber is considered a non-digestible carb and does not contribute to the total carbohydrate intake. As such, in many cases, fiber is subtracted from total carb intake. The grams of fiber is often subtracted from the total carbs grams to yield a total of usable carbs grams. For example, a food label may list 34 g total carbohydrate consisting of 4 g fiber and 6 g added sugar. By subtracting dietary fiber (4 grams of fiber) from total carbohydrates (34 grams) = 30 grams of usable carbs.
Protein
Protein is an essential nutrient that you need throughout life. Proteins are the building blocks of life. Protein is in every cell in your body. The basic structure of protein is a chain of amino acids 37. A protein is a chain of amino acids bound to one another via peptide bonds (chemical bond linking amino acids together to form a protein). When someone eats protein, it is broken down into its amino acids.
Your body needs protein to make, maintain, repair and renew bones, muscles, cartilage, hormones, enzymes, neurotransmitters, vitamins, blood and skin cells 21, 38, 39. Proteins provide energy (calories) if necessary, the others are fat and carbohydrates. Proteins do everything from fighting infections to helping cells divide. Protein is also important for growth and development in children, teens, and pregnant women.
Excess or deficiency of protein can lead to disease, resulting in nervous system defects, metabolic problems, organ failure, and even death 37. Clinical symptoms of inadequate intake of essential amino acids may include depression, anxiety, insomnia, fatigue, weakness, and growth stunting in the young. These symptoms are mostly caused by a lack of protein synthesis in the body because of the lack of essential amino acids 39. Kwashiorkor and marasmus are examples of more severe clinical disorders caused by malnutrition and inadequate intake of essential amino acids as a macronutrient 39.
High protein diets can promote weight loss via increased insulin sensitivity, fatty acid oxidation, appetite suppression, and feeling full. However, caution is necessary for people with diabetes who have gout because protein can elevate niacin levels, which may exacerbate gout-related symptoms.
The protein in your food is broken down into parts called amino acids during digestion. Your body needs a number of amino acids in large enough amounts to maintain good health. While there are hundreds of amino acids, humans use only 20 amino acids 37, 39.
Amino acids are classified into three groups 37:
- Essential amino acids. Essential amino acids cannot be made by your body, and must be supplied by food. Essential amino acids do not need to be eaten at every meal. The balance over the whole day is more important. There are 9 essential amino acids:
- Histidine
- Isoleucine
- Leucine
- Lysine
- Methionine
- Phenylalanine
- Threonine
- Tryptophan
- Valine
- Nonessential amino acids. Nonessential amino acids are made by your body from essential amino acids or in the normal breakdown of proteins. There are 5 amino acids that are termed non-essential amino acids:
- Alanine
- Asparagine
- Aspartic acid
- Glutamic acid
- Serine
- Conditionally Essential amino acids. Conditionally Essential amino acids are needed in times of illness, stress, starvation or inborn errors of metabolism. A healthy body can make conditionally essential amino acids under normal physiologic conditions. There are 6 amino acids that are called conditionally essential amino acids:
- Arginine
- Cysteine
- Glutamine
- Glycine
- Proline
- Tyrosine
You get protein (amino acids) in your diet from animal and plant-based foods such as meat, fish, eggs, dairy products, nuts, and certain grains, beans, peas, and lentils 40. Proteins from meat and other animal products are complete proteins. This means they supply all of the amino acids your body can’t make on its own. Most plant proteins are incomplete. So you should eat different types of plant proteins every day to get all nine essential amino acids your body needs. For example, pairing protein sources like rice and beans, hummus, pita bread, or oatmeal topped with almond butter. Regarding volume, it may be necessary to eat more plant-based foods to get a similar amount of protein and amino acid profile provided by animal-based proteins 41.
- Animal protein – protein-containing foods from animals are meat, chicken, fish, eggs and dairy products. Meat and poultry foods should be lean or low-fat, like 93% lean ground beef, pork loin, and skinless chicken breasts. Choose seafood options that are higher in healthy fatty acids called omega-3s fatty acid and lower in methylmercury, such as salmon, anchovies, and trout. And stay away from processed meats or artificial (fake) meat.
- Vegetable protein – protein-containing foods from plants include tofu, nuts, seeds, lentils, dried beans and peas, and soy milk.
Good protein choices include:- Soy protein
- Beans
- Nuts
- Fish
- Lean chicken with no skin
- Lean beef
- Pork
- Salmon
- Anchovies
- Trout
- Low-fat dairy products
It is important to get enough dietary protein. You need to eat protein every day, because your body doesn’t store it the way it stores fats or carbohydrates. Furthermore, protein foods provide nutrients important for maintaining your health and body. How much protein you need depends on your age, sex, height, weight, health, and level of physical activity. The amount can also depend on whether or not you are pregnant or breastfeeding.
The recommended protein intake is 0.8 to 1 gram per kilogram of body weight per day 42. For strength training athletes adequate protein intake should range between 1.2 and 1.7 grams of protein per kilogram of body weight per day or 0.5 to 0.8 grams per pound of body weight 43, 44, 45, 46.
For healthy children ages 1 to 3 approximately 5 to 20% and children ages 4 to 18 approximately 10 to 30% of daily energy intake should come from protein. The daily recommended intake of protein for healthy adults is 10% to 35% of your daily energy intake based on the adequate amount needed for nitrogen equilibrium 8. One gram of protein supplies 4 calories. Therefore, if you consume 2,000 calories per day, this would work out to be between 200 to 700 calories of protein per day, you could eat 100 grams of protein, or 400 calories from protein, which would supply 20% of your total daily calories.
The recommended daily intakes (RDIs) can also be calculated by your body weight. The Academy of Nutrition and Dietetics recommends that the average individual should consume 0.8 grams of protein per kilogram or 0.35 grams per pound of body weight per day for general health. So a person that weighs 75 kg (165 pounds) should consume an average of 60 grams of protein per day. Since there are approximately four calories per gram of protein, 60 grams of protein would result in the intake of 240 calories.
How much protein do I need?
How much protein you need depends on your age, sex, height, weight, health, and level of physical activity. The amount can also depend on whether or not you are pregnant or breastfeeding. The recommended protein intake is 0.8 to 1 gram per kilogram of body weight per day 42. For strength training athletes adequate protein intake should range between 1.2 and 1.7 grams of protein per kilogram of body weight per day or 0.5 to 0.8 grams per pound of body weight 43, 44, 45, 46.
How to calculate your daily protein needs:
Convert body weight in pounds to kilograms (round to the nearest 10th). Multiply weight in kilograms by the range that best fits your activity levels.
Let’s look at an example:
- Convert pounds into kilograms 150lbs / 2.2 = 68.2kg
The recommended protein intake is 0.8 to 1 gram per kilogram of body weight per day
- 68.2kg (0.8g grams of protein per kilogram) = 54.6g
- 68.2kg (1g grams of protein per kilogram) = 68.2g
For strength training athletes adequate protein intake should range between 1.2 and 1.7 grams of protein per kilogram of body weight per day.
- 68.2kg (1.2g grams of protein per kilogram) = 81.8g
- 68.2kg (1.7g grams of protein per kilogram) = 115.9g
Here are some practical protein equivalents in common foods. One ounce (30 grams) of most protein-rich foods contains 7 grams of protein. An ounce (30 grams) equals:
- 1 oz (30 g) of meat fish or poultry
- 1 large egg has six grams of protein
- ¼ cup (60 milliliters) tofu
- ½ cup (65 grams) cooked beans or lentils
- 1 cup of dry beans has about 16 grams of protein
- 1 cup of milk has eight grams of protein
- 1 cup of soy milk has about seven grams of protein
Low fat dairy is also a good source of protein. An eight ounce container of yogurt has about 11 grams of protein
Most Americans eat enough protein in their diet but need to select leaner varieties of meat and poultry. Americans may also need to increase the variety of protein foods selected and choose meats less often. However, if you are vegetarian or vegan, the advice to eat meat, poultry, and seafood does not apply to you. Vegetarian protein options include beans, peas, lentils, nuts, seeds, and soy products.
What counts as an ounce-equivalent in the protein foods group?
The following examples count as 1 ounce-equivalent from the protein foods group 38:
- 1 ounce of meat, poultry, or fish
- ¼ cup cooked beans
- 1 egg
- 1 tablespoon of peanut butter
- ½ ounce of nuts or seeds
- ¼ cup (about 2 ounces) of tofu
- 1 ounce tempeh, cooked
The table below lists amounts that count as 1 ounce-equivalent in the protein foods group towards your daily recommended amount.
Table 2. Daily protein foods general recommendations by age
| Daily Protein Recommendation* in Ounce-Equivalents | ||
|---|---|---|
| Toddlers | 12 to 23 months | 2 ounce-equivalent |
| Children | 2-3 yrs 4-8 yrs | 2 to 4 ounce-equivalent 3 to 5½ ounce-equivalent |
| Girls | 9-13 yrs 14-18 yrs | 4 to 6 ounce-equivalent 5 to 6½ ounce-equivalent |
| Boys | 9-13 yrs 14-18 yrs | 5 to 6½ ounce-equivalent 5½ to 7 ounce-equivalent |
| Women | 19-30 yrs 31-59 yrs 60+ yrs | 5 to 6½ ounce-equivalent 5 to 6 ounce-equivalent 5 to 6 ounce-equivalent |
| Men | 19-30 yrs 31-59 yrs 60+ yrs | 6½ to 7 ounce-equivalent 6 to 7 ounce-equivalent 5½ to 6½ ounce-equivalent |
How much protein do you need for optimal muscle maintenance?
The recommended protein intake is 0.8 to 1 gram per kilogram of body weight per day 42. For strength training athletes adequate protein intake should range between 1.2 and 1.7 grams of protein per kilogram of body weight per day or 0.5 to 0.8 grams per pound of body weight 43, 44, 45, 46, 47, 48. That’s because your skeletal muscle is made up of 75 percent water and 20 percent protein, with the remainder from other materials including fat, glycogen, inorganic salts, and minerals 49. Given the protein content of your skeletal muscle, it is not surprising resistance trained athletes emphasize the importance of dietary protein in their meal plans 50. This is also reflected in the scientific literature with significant attention given to protein focused nutritional interventions to facilitate resistance training induced adaptations 51, including manipulation of total daily dietary protein intake 52, protein dosage per meal 53, 54, 55, protein quality 56 and protein distribution 57.
Higher-protein diets have been shown to 58, 59, 47, 48:
- Promote gains in muscle mass, especially when paired with resistance training;
- Spare muscle mass loss during caloric restriction; and
- Reduce the natural loss of muscle mass that accompanies aging.
Protein quality is also important to the gain and maintenance of muscle mass 60. Protein quality is a function of protein digestibility, amino acid content, and the resulting amino acid availability to support metabolic function 60. Whey protein is one of the highest-quality proteins given its amino acid content (high essential, branched-chain, and leucine amino acid content) and rapid digestibility. Consumption of whey protein has a strong ability to stimulate muscle protein synthesis 60. In fact, whey protein has been found to stimulate muscle protein synthesis to a greater degree than other proteins such as casein and soy.
A recent meta-analysis suggested dietary protein supplementation enhances resistance training induced gains in muscle mass and strength, at least when dietary protein intake is suboptimal (<1.6 g per kg body weight daily) 61, resistance training alone provides a far greater stimulus than whey protein supplementation 54.
How to calculate your daily protein needs:
Convert body weight in pounds to kilograms (round to the nearest 10th). Multiply weight in kilograms by the range that best fits your activity levels.
Let’s look at an example:
- Convert pounds into kilograms 150lbs / 2.2 = 68.2kg
The recommended protein intake is 0.8 to 1 gram per kilogram of body weight per day
- 68.2kg (0.8g grams of protein per kilogram) = 54.6g
- 68.2kg (1g grams of protein per kilogram) = 68.2g
For strength training athletes adequate protein intake should range between 1.2 and 1.7 grams of protein per kilogram of body weight per day.
- 68.2kg (1.2g grams of protein per kilogram) = 81.8g
- 68.2kg (1.7g grams of protein per kilogram) = 115.9g
Muscle mass is built when the net protein balance is positive: that is muscle protein synthesis exceeds muscle protein breakdown. Research shows muscle protein turnover is the greatest after working out. Additionally, it has been shown that muscle mass increases over time when resistance exercise (i.e. weight lifting, body weight exercises, etc) is combined with nutrient intake.
However, as you age, you need to increase your protein intake 43. Around 50 years of age, you need to increase the protein in your diets to 1 gram per kilogram of your body weight to maintain muscle mass 43. People that exercise regularly also need to eat more protein than the recommended daily intake 43.
Several studies performed by the group of Philip and others showed that protein supplementation did not further increase muscle strength among individuals who consumed adequate amounts of dietary protein 46, 62, 44, 63. However, with the aim of maximizing performance, individuals seeking to gain muscle mass are likely to consume more protein with the misconceived belief that large quantities of protein consumption might generate more muscle protein 64.
To increase muscle mass in combination with physical activity, it is recommended that a person that lifts weights regularly or is training for a running or cycling event eat a range of 1.2 to 1.7 grams of protein per kilogram of body weight per day, or 0.5 to 0.8 grams per pound of body weight 43. Consequently, the same 75
kilogram individual should increase their protein intake to 75 grams (300 calories) to 128 grams (512 calories) in order to gain muscle mass. This level of intake can generally be met through diet alone and without additional protein and amino acid supplementation 43.
When should I consume protein?
The process of protein turnover is increased with resistance training and can remain elevated for up to 48 hours in people beginning a new resistance training program 43. Therefore it is important to provide enough energy including protein so there is a sufficient pool of amino acids available to repair and build new muscle. You do not want to exercise on an empty stomach. In fact, exercising in an unfed state leads to an increase in protein loss making it more difficult for your body to both repair and build muscle 43. Your body can only use approximately 20–40 g of protein per meal. For best results, eat around this much protein every 3 to 4 hours.
Research suggests there are several benefits to pre-exercise protein supplementation 43. Pre-exercise protein supplementation helps to improve body composition by increasing resting energy expenditure up to 48 hours after exercise 43. This is important because it suggests that pre-exercise protein ingestion will not only help increase lean muscle mass and strength, but will also simultaneously reduce fat mass 43. However, the most scientifically supported and most significant benefits of consuming protein prior to exercise may be improved recovery and hypertrophy. This is thought to occur because of improved amino acid delivery 43.
Make sure you have a healthy diet that meets the current protein intake recommendations and then use supplements to add anything else you might need. A good diet will not make a mediocre athlete into a champion, but poor food choices can turn a champion into a mediocre athlete. The International Olympic Committee (IOC) position stand is that “the use of supplements does not compensate for poor food choices and an inadequate diet”. Reinforcing this importance of food, researchers have found that athletes eating a diet rich in nitrates from vegetables (not supplements) for just 10 days were able to enhance their exercise performance, compared to when they were eating their usual diet 65.
Protein supplement
Protein supplementation has been shown to improve muscle building with regular exercise training. Protein supplementation should contain a high amount of the amino acid leucine, which is responsible for muscle protein synthesis. Whey protein is a great option for leucine. Eating less protein may not be enough to rebuild muscles, and eating more doesn’t usually give you more benefits.
Whey protein is beneficial in supporting muscle adaptations due to its rapid absorption rate in addition to casein that has a slower and more sustained rate of amino acid absorption over a few hours 43. Branched chain amino acids are similarly beneficial and have been shown to aid in recovery from exercise with respect to not only protein synthesis but also aiding in replacing our muscle glycogen and delaying fatigue associated with exercise.
Protein supplementation after exercise may have a more profound impact on skeletal muscle hypertrophy. Several studies have demonstrated that protein ingestion following an acute bout of resistance training stimulates muscle protein synthesis for up to three hours 43. In contrast, failing to eat after exercise
may limit protein synthesis and therefore limit potential progress in lean muscle tissue development. Research actually suggests there may be an “anabolic window” such that protein intake within an hour of exercise has the greatest influence on resistance training adaptations 43.
Generally, naturally occurring animal proteins contain 2:1:1 ratio of leucine, isoleucine and valine. These proteins have been identified as providing optimal support of muscle adaptations with exercise training. In order to meet the recommended RDA a consumption of approximately 45 mg/kg/day of leucine and 22.5 mg/kg/day of isoleucine and valine is suggested 43.
What is the best protein powder supplement?
Creatine monohydrate is generally safe and can help you build more muscle mass 66, 67, 68, 69, 70, 71, 72. Always check with your doctor before starting any supplement.
Creatine (N-[aminoiminomethyl]-N-methyl glycine) is an amino acid–like compound that is produced in your liver, kidney, pancreas, and possibly the brain from the biosynthesis of the essential amino acids methionine, glycine, and arginine, or obtained from dietary sources 73. The primary dietary sources are high-protein foods including meat, fish, and poultry. Once synthesized or ingested, creatine is transferred from the plasma through the intestinal wall into other tissues by specific creatine transporters located in skeletal muscles, the kidney, heart, liver, and brain.
Creatine as a dietary supplement is a tasteless, crystalline powder that readily dissolves in liquids and is marketed as creatine monohydrate or as a combination with phosphorous 74. The majority of creatine (95%) is stored in skeletal muscle (fast twitch, type 2): two-thirds in a phosphorylated form and one-third as free creatine 75. Creatine serves as an energy substrate for the contraction of skeletal muscle. The intention of creatine supplementation is to increase resting phosphocreatine levels in muscles, as well as free creatine, with the goal of postponing fatigue, even briefly, for sports-enhancing results 66.
Creatine is one of the most widely used dietary supplements. Athletes, body builders, and military personnel use creatine to enhance muscle mass and increase strength. Creatine is also used as an ergogenic aid to improve performance of high-intensity exercise of short duration 76, 77, 78. Creatine’s popularity as a dietary supplement was further increased by a 2006 study demonstrating its positive effect on cognitive and psychomotor performance 79.
Experiments among athletes and military personnel indicate that creatine taken at levels commonly available in supplements produces minimal, if any, side effects 78, 80. Using evidence from well-designed, randomized controlled human clinical trials of creatine, Shao and Hathcock 80 concluded that chronic intake of 5 g/ day of creatine was safe and posed no significant health risks.
Muscle creatine concentrations are increased by 20% with creatine monohydrate supplementation 75. Creatine monohydrate supplements increase lean body mass, as well as strength, power and effectiveness in short-duration, high-intensity exercises 81. The increase in body mass may be a result of the increase in intracellular water related to the osmotic properties of creatine 82. Studies on creatine monohydrate supplementation have shown short-duration improvements in sports performance and strength: specifically, in maximum-intensity exercises, muscle power, number of repetitions, muscle endurance, speed and total strength 83.
The use of creatine monohydrate can yield increases in power during short sprints of maximum intensity, which can be even more evident when repeated sprints are accompanied by short recovery periods 71. Furthermore, with creatine monohydrate supplementation, effects are also observed in muscle glycogen stores 82. This is important because the availability of muscle glycogen is the main determinant of sports performance in resistance exercises, and its depletion can lead to muscle fatigue 84. In addition, creatine monohydrate is one of the few sports foods supplements or ergogenic aids (substance used for the purpose of enhancing performance) with health claims authorised by the EFSA and the European Commission (EC), due to its evident effects on the health and sports performance of athletes 85, 86.
The approved health claims are ‘Creatine increases physical performance in repeated bursts of high-intensity exercise in the short term’ and ‘Daily creatine consumption can enhance the effect of resistance training on muscle strength in adults over the age of 55’. These health claims refer to the 3-g dose of creatine monohydrate 86. Resistance training should be performed at least three times per week for several weeks, at an intensity of at least 65–75% of one repetition maximum (1RM). The target population is adults over the age of 55, who are engaged in regular resistance training 86. Creatine in combination with resistance training and improvement in muscle strength 86.
Is creatine safe?
There have been reports that creatine may impair liver and kidney function. Creatine has also been linked to an increased risk of compartment syndrome, a condition where pressure builds in a muscle compartment and prevents blood flow. People at risk of kidney problems should check with their doctor before using creatine and be carefully monitored while using it.
There are no data documenting the safety of creatine in children or adolescents. The American Academy of Pediatrics and the American College of Sports Medicine warn that teens should not use performance-enhancing supplements, including creatine, because of the possible health risks 87.
Do performance-enhancing dietary supplements work?
Some bodybuilders and athletes use dietary supplements to try to improve their strength, muscle mass, and energy. However, many of these types of products contain harmful ingredients. Also, for some substances, including glutamine, choline, methoxyisoflavone, quercetin, zinc/magnesium aspartate, nitric oxide, and L-arginine, there’s no clear evidence that they improve athletic performance. Studies have looked at a variety of supplements used for bodybuilding or to improve physical performance, including glutamine, choline, methoxyisoflavone, quercetin, zinc/magnesium aspartate, nitric oxide, and L-arginine 88, 89, 90, 72, 91, 92. There’s no clear evidence these supplements improve athletic performance 88.
The results of studies on beta-alanine, an amino acid found in food and dietary supplements, are mixed but generally don’t show that it improves athletic performance significantly 93.
Are bodybuilding supplements safe?
Dangerous hidden ingredients are an increasing problem in products promoted for bodybuilding, the U.S. Food and Drug Administration (FDA) warns 94, 95, 96. Consumers may unknowingly take products laced with prescription drug ingredients, controlled substances, and other ingredients.
- Bodybuilding supplements often are adulterated with anabolic steroids that are modified variants of male hormones designed to increase muscle mass.
- Liver injury from taking bodybuilding dietary supplements has increased in recent years. Bodybuilding products are the most common cause of liver injury linked to herbal and dietary supplement use.
- Products containing the stimulants beta-methylphenethylamine (BMPEA) or 1,3-dimethylamylamine (DMAA) an an amphetamine derivative can cause serious health problems.
- Supplements labeled as containing the herb Acacia rigidula often contain beta-methylphenethylamine (BMPEA), although BMPEA isn’t in the herb and isn’t a dietary ingredient.
- 1,3-dimethylamylamine (DMAA) containing products marketed as dietary supplements are illegal. In 2013, the FDA began taking action to remove these products from the market 96. However, DMAA is still found in some products marketed as supplements, including under different names, such as geranium oil.
- Some dietary supplements may interact with drugs or other supplements. Some vitamins and minerals are harmful at high doses. Talk with your health care provider before using a dietary supplement for bodybuilding or endurance.
Fat
You need to eat some fat even when you are trying to lose weight. The human body needs small amounts (3 to 6 grams) of essential fatty acids (Omega-6 and Omega-3 fatty acids). Fat is important for many body processes. Fat helps your body absorb nutrients and move nutrients around your body. Some fat is necessary as a carrier for the fat-soluble vitamins A, D, E, and K. Fat is the main source of energy storage in your body, fat contributes to cellular structure and function, fat keeps you warm, and protects your organs 97, 98, 99. Fat also helps with hormone production. Therefore your diet should not be devoid of fat. However, because fat is calorically dense (1 gram of fat has 9 calories of energy), it is often decreased on weight-loss diets to reduce energy intake.
Fat needs will vary by individual and will depend largely on your body composition goals and body types. For example, dietary fat recommendations are slightly higher in competitive athletes than non-athletes to promote health, maintain healthy hormone function, and maintain energy balance. Typical recommendations for athletes are 30 to 50% of total energy intake.
There are 4 main types of fats:
- Unsaturated fats are those that are liquid at room temperature. The two kinds of unsaturated fats are monounsaturated fat and polyunsaturated fat. Both of these unsaturated fats are typically liquid at room temperature. Unsaturated fats are in fish, such as salmon, trout and herring, and plant-based foods such as avocados, olives and walnuts. Liquid vegetable oils, such as soybean oil, corn oil, safflower oil, canola oil, olive oil, peanut oil, canola oil and sunflower oil, also contain unsaturated fats. Eaten in moderation, both kinds of unsaturated fats may help improve your blood cholesterol when used in place of saturated and trans fats. You want to include as many unsaturated fats in your diet because they can decrease bad cholesterol, contain high amounts of antioxidants such as Vitamin E, and contain essential omega-3 and omega-6 fatty acids. Unsaturated fats are typically classified by how many hydrogen bonds they have in their structure: either 1 (mono) or two or more (poly).
- Monounsaturated fats. Monounsaturated fat is a type of unsaturated fat. Monounsaturated fats are liquid at room temperature but start to harden when chilled. Monounsaturated fats is one of the healthy fats, along with polyunsaturated fat. Monounsaturated fats are good for your health in several ways:
- Monounsaturated fats can help lower your LDL (bad) cholesterol level. Cholesterol is a soft, waxy substance that can cause clogged, or blocked, arteries (blood vessels). Keeping your LDL level low reduces your risk for heart disease and stroke.
- Eating plant foods high in monounsaturated fats, particularly extra virgin olive oil and tree nuts, may benefit heart health and blood sugar regulation. Monounsaturated fats from plants may lower bad cholesterol and raise good cholesterol. They also may improve the control of blood sugar levels. Replacing saturated fats with monounsaturated fats in your diet may lower the level of bad cholesterol and triglycerides in your blood. Triglycerides are fat cells that circulate in the bloodstream and are stored in the body’s fat cells. A high level of triglycerides in the blood increases the risk of diseases of the heart and blood vessels.
- Monounsaturated fats help develop and maintain your cells.
- Monounsaturated fats are found in plant foods, such as nuts, avocados, and vegetable oils. Monounsaturated fats are found in red meats and dairy products. About half the fats in these foods are saturated and half monounsaturated. Many plants and plant oils are high in monounsaturated fats but low in saturated fats. These include:
- Oils from olives, peanuts, canola seeds, safflower seeds, and sunflower seeds.
- Avocadoes.
- Pumpkin seeds.
- Sesame seeds.
- Almonds.
- Cashews.
- Peanuts and peanut butter.
- Pecans.
- Polyunsaturated fats. Polyunsaturated fat is a type of unsaturated fat. Polyunsaturated fats are liquid at room temperature but start to harden when chilled. Polyunsaturated fats include omega-3 and omega-6 fats. These are essential fatty acids that your body needs for brain function and cell growth. Your body does not make essential fatty acids, so you must get them from food. Polyunsaturated fats can help lower your LDL (bad) cholesterol. Cholesterol is a soft, waxy substance that can cause clogged or blocked arteries (blood vessels). Having low LDL cholesterol reduces your risk for heart disease. Polyunsaturated fats is one of the healthy fats, along with monunsaturated fat. Polyunsaturated fat is found in plant and animal foods, such as salmon, vegetable oils, and some nuts and seeds.
- Omega-3 fatty acids are good for your heart in several ways. They help:
- Reduce triglycerides, a type of fat in your blood
- Reduce the risk of developing an irregular heartbeat (arrhythmia)
- Slow the buildup of plaque, a substance comprising fat, cholesterol, and calcium, which can harden and clog your arteries
- Slightly lower your blood pressure
- Sources of omega-3 fatty acids include:
- Fish such as salmon, anchovies, mackerel, herring, sardines and tuna.
- Oils from canola seeds, soybeans, walnuts and flaxseed.
- Soybeans.
- Chia seeds.
- Flaxseed.
- Walnuts.
- Omega-6 fatty acids may help:
- Control your blood sugar
- Reduce your risk for diabetes
- Lower your blood pressure
- Sources of omega-6 fatty acids include:
- Corn oil.
- Cottonseed oil.
- Peanut oil.
- Soybean oil.
- Sunflower oil.
- Omega-3 fatty acids are good for your heart in several ways. They help:
- Saturated fats. Saturated fats are those that are solid at room temperature. Examples include margarine, butter, whole fat dairy products, the fat marbling in meats, and coconut oil. Saturated fats don’t need to be avoided entirely, but diets high in saturated fats can increase bad cholesterol and triglycerides, increasing the risk for heart disease. The Dietary Guidelines for Americans suggest that less than 10% of calories a day should be from saturated fats. The American Heart Association recommends that saturated fats only make up 5 to 6% of your daily calories. For a 2,000 calorie diet, that is a total of 100 calories, or 11 grams a day. Foods high in saturated fats include:
- Foods baked or fried using saturated fats.
- Meats, including beef, lamb, pork as well as poultry, especially with skin.
- Lard.
- Dairy products like butter and cream.
- Whole or 2% milk.
- Whole-milk cheese or yogurt.
- Oils from coconuts, palm fruits, or palm kernels.
- Trans fats. Trans fatty acids are unhealthy fats that form when vegetable oil goes through a process called hydrogenation. This leads the fat to harden and become solid at room temperature. Hydrogenated fats, partially hydrogenated oils (PHOs) or “trans fats,” are often used to keep some foods fresh for a long time. Trans fats are unsaturated fats that are artificially turned into saturated fats and increase heart disease and stroke risk by raising bad LDL cholesterol and decreasing good HDL cholesterol levels. High LDL (bad) cholesterol along with low HDL (good) cholesterol levels can cause cholesterol to build up in your arteries (blood vessels). This increases your risk for heart disease and stroke. Trans fats have also been known to increase the risk of developing type 2 diabetes. Trans fats are most commonly found in fried foods, frozen baked products such as pizza, non-dairy coffee creamers, vegetable shortenings, some margarines, crackers, cookies, snack foods, and other foods made with or fried in partially hydrogenated oils (PHOs). Because of the health risks from trans fats, the United States Food and Drug Administration (FDA) has banned food manufacturers from adding partially hydrogenated oils (PHOs) to foods. Although the food industry has greatly reduced the use of trans fat in recent years, trans fat may still be found in many fried, packaged, or processed foods. There are very small amounts of naturally occurring trans fat in meats and dairy from grazing animals, such as cows, sheep and goats. You should avoid foods made with hydrogenated and partially hydrogenated oils (such as hard butter and margarine). They may contain high levels of trans fatty acids. It is important to read nutrition labels on foods. This will help you know what kinds of fats, and how much, your food contains.
How much fat do I need?
To prevent any fatty acid deficiencies it is recommended that you consume at minimum 1g of fat per kg of body weight per day. According to the Dietary Guidelines for Americans 22, fats should make up 20 to 35% of your total daily calorie intake. For those attempting to lose body fat, 0.5 to 1 fat per kg of body weight per day should be consumed per day to avoid essential fatty acid deficiency. For healthy children ages 1 to 3, ages 4 to 18, and adults, approximately 30 to 40%, 25 to 15%, and 20 to 35% of daily energy intake should come from fat, respectively 21. Approximately 5 to 10% of your daily fat energy intake should consist of Omega−6 fatty acids (linoleic acid) and 0.6 to 1.2% of Omega−3 fatty acids (alpha-linolenic acid, eicosapentaenoic acid [EPA] and docosahexaenoic acid [DHA]) 8. Both omega−6 fatty acids (linoleic acid) and omega−3 fatty acids (alpha-linolenic acid, eicosapentaenoic acid [EPA] and docosahexaenoic acid [DHA]) are considered essential fatty acids, meaning that they must be obtained from your diet 100. Apha-linolenic acid can be converted into eicosapentaenoic acid (EPA) and then to docosahexaenoic acid (DHA), but the conversion (which occurs primarily in your liver) is very limited, with reported rates of less than 15% 101, 102. Eicosapentaenoic acid (EPA) and docosahexaenoic acid (DHA) are essential fatty acids, meaning the body can’t produce them and they must come from your diet 103. Therefore, consuming eicosapentaenoic acid (EPA) and docosahexaenoic acid (DHA) directly from foods and/or dietary supplements is the only practical way to increase levels of these fatty acids in your body.
Eicosapentaenoic acid (EPA) and docosahexaenoic acid (DHA) are omega-3 fatty acids found in varying amounts in seafood such as cold-water fish like salmon, tuna, herring, and mackerel, as well as in fish oil supplements and seaweed. Eating 8 ounces per week of seafood may help reduce the risk for heart disease.
Some researchers propose that the relative intakes of omega-6s and omega-3s, the omega-6/omega-3 ratio, may have important implications for the cause of many chronic diseases, such as heart and blood vessels disease (cardiovascular disease) and cancer 104, but the optimal ratio, if any, has not been defined 105. Others have concluded that the omega-6/omega-3 ratios are too nonspecific and are insensitive to individual fatty acid levels 106, 107, 108.. Most agree that raising EPA and DHA blood levels is far more important than lowering linoleic acid or arachidonic acid levels 102.
For someone who weighs 150lbs (68kg), this would equate to 34-68g fat per day. Using both of these references you can calculate your daily fat needs:
To calculate your daily fat needs:
- Convert body weight in pounds to kilograms (round to the nearest 10th). Multiply weight in kilograms by 1.
Let’s look at an example:
- Convert pounds into kilograms 150lbs / 2.2 = 68.2kg
The recommended fat intake is 1 gram per kilogram of body weight per day
- 68.2kg (1g grams of fat per kilogram) = 68.2g of fat per day
Weight loss diets that are moderate to low in fat (20 to 30% of calories) are called “balanced deficit” diets because they maintain a reasonable balance among macronutrients similar to that recommended in MyPlate, DASH, and the Dietary Guidelines for Americans 22, 109. They tend to achieve most of the caloric deficit by reducing fat from the typical level in North American Diets of about 34% or more of calories to 20 to 30% fat, 15% protein, and 55 to 65% of calories from carbohydrates. Some examples of low fat diets are the Weight Watchers Diet (25% fat, 20% protein, and 55% carbohydrate, with 26 grams of dietary fiber), Jenny Craig, the National Cholesterol Education Program Step 1 diet (25% fat), diets based on the MyPlate, the DASH diet, the Shape up and Drop 10 diet of Shape Up! America and the Nutrisystem diet 1. Popular diet books using this approach include The Biggest Loser Diet, The Mayo Clinic Diet and The Engine 2 Die 1. These dietary patterns have been extensively reviewed and appear to be effective for weight reduction on low calorie diets for most individuals 1.
Very low-fat diets such as the Pritikin Diet 110, the Ornish Diet 111 and The Spark Solution Diet 112 have been advocated not only for weight reduction, but also for improving cardiovascular risk profiles. The Ornish Diet 111, which is very low in fat (13% of calories) and saturated fat, very high in carbohydrate (81% of calories) and very high in fiber (38 grams), is part of a program that includes nonsmoking, exercise and behavior modification. The Ornish Diet 111 was shown to reduce some cardiovascular risk factors in a limited long term study. For those who can adhere to the Ornish regime it may be helpful. However, it may not be appropriate for all populations, such as diabetics.
What are Healthy fats?
Healthy fats include:
- Monounsaturated fats
- Polyunsaturated fats (omega-3 and omega-6).
The healthier fats are unsaturated fats. They can be found in sunflower oil, safflower oil, peanut and olive oils, poly- and mono-unsaturated margarine spreads, nuts, seeds and avocado. These are much better for you than the saturated fat found in butter, cream, fatty meats, sausages, biscuits, cakes and fried foods.
Foods that contain healthy monounsaturated fats include:
- Avocados and their oils/spreads
- Unsalted nuts such as almonds, cashews and peanuts and their butters/spreads
- Olives and their oils/spreads
- Cooking oils made from plants or seeds, including: olive, canola, peanut, sunflower, soybean, sesame and safflower.
Foods that contain healthy polyunsaturated fats (omega-3 and omega-6) include:
- Oily fish like salmon, mackerel and sardines
- Tahini (sesame seed spread)
- Linseed (flaxseed) and chia seeds
- Soybean, sunflower, safflower, canola oil and margarine spreads made from these oils
- Pine nuts, walnuts and brazil nuts.
It is important to choose foods with the healthiest type of fat such as avocados, olives, nuts and seeds, and use healthy oils for cooking, for example, olive, canola, sunflower, peanut and soybean oil.
Reduce the amount of highly processed food you eat such as baked goods including cakes, biscuits and pastries, along with processed meat, and fried and takeaway foods. These foods are high in saturated and trans fats, added sugar and salt, and are not part of a heart-healthy eating pattern. Try to have these foods only sometimes and in small amounts.
Many Americans eat more fat than they need, which can lead to weight gain and heart disease.
What are Unhealthy fats?
Unhealthy fats include:
- Saturated fat
- Trans fat
Foods rich in unhealthy fats include:
- Animal fats including butter, ghee and lard along with the visible fat/skin on meat
- Hydrogenated plant oils like copha, vegetable shortening and some margarines
- Coconut oil
- Processed foods such as baked goods (cakes, biscuits and pastries), processed meat ( bacon, sausages, salami) and fried and takeaway foods.
Replace foods rich in saturated and trans fats with foods rich in healthy unsaturated fats as part of a healthy diet.
It is important to choose foods with the healthiest type of fat such as avocados, olives, nuts and seeds, and use healthy oils for cooking, for example, olive, canola, sunflower, peanut and soybean oil.
Reduce the amount of highly processed food you eat such as baked goods including cakes, biscuits and pastries, along with processed meat, and fried and takeaway foods. These foods are high in saturated and trans fats, added sugar and salt, and are not part of a heart-healthy eating pattern. Try to have these foods only sometimes and in small amounts.
Many Americans eat more fat than they need, which can lead to weight gain and heart disease.
How to build muscles faster?
Muscle building also called muscle hypertrophy is defined as an increase in skeletal muscle size is the process of increasing muscle size, density, and shape, typically through weightlifting and resistance training 113, 114, 115, 116, 117, 118, 119. Research has shown that in order to increase muscle mass, stress must be put on the body, leading to increased hormone release, and increased flow of nutrients into the muscle, and with rest, muscles will grow 120, 121, 122, 123, 50, 124, 125, 126.
To get a bigger muscle, you can:
- Use a reps-and-rest cycle. Aim for 6–12 reps per set, with 60–90 seconds of rest between sets.
- Lift heavy weight. Lifting too light a weight won’t lead to the same definition gains.
- Vary your exercises. This will help you work different muscle fibers.
- Progressively increase the resistance over time.
- Muscle growth is typically experienced after 6 to 7 weeks of resistance training 127. Muscle growth is more common in fast-twitch than in slow-twitch muscles. Type 2A fibers exhibit the greatest growth, more so than type 2B and type 1 fibers.
- Eat a healthy diet rich in macronutrients, especially protein 58, 59.
However, gaining lean body weight is a slow process that takes months and years rather than days and weeks. Most muscle tissue is made up of different kinds of proteins. When you lift heavy loads, your muscles tear and your body experiences metabolic stress 128. In response to this, your body tells the proteins to increase, and the muscles slowly grow 128. Then, to keep growing your muscles, you have to keep increasing weightlifting volumes over time 128. A beginner new to weightlifting who uses full body workouts three times a week can expect to build 1/2 to 1 pound per week or 6 to 12 pounds of muscle in 3 months. An experienced lifter can build 1/4 to 1/2 pound per week or 3 to 6 pounds of muscle in 3 months.
There are several ways you can train to make your muscles bigger. Most hypertrophy training plans focus on lifting heavier loads for a smaller number of reps and sets. However, different bodies might respond differently to the same programs, so there is usually some trial and error when finding your optimal training plan.
According to the National Academy of Sports Medicine (NASM), muscle building training can sometimes result in overuse injuries like tendonitis or tendinosis or low-grade muscle tears, especially when you don’t properly rest and recover 128. Lifters who try to lift too much or have poor form can get more serious acute injuries like ruptured discs, ligament tears, fractures, or high-grade muscle tears 128.
Most of these risks can be avoided if you follow a structured program from a qualified trainer who knows your capabilities 128. In fact, muscle building is a more advanced form of strength training. According to the Optimum Performance Training Model (OPT Model), a 5-phased fitness training system developed by Dr. Mike Clark to guide National Academy of Sports Medicine (NASM) personal trainers to help their clients improve their performance, training, and recovery 129. The Optimum Performance Training Model (OPT Model) is based on human movement science principles, including biomechanics, kinesiology, and exercise physiology. It combines a variety of exercises, including:
- Flexibility training
- Cardiorespiratory training
- Core training
- Balance training
- Plyometric training
- Speed, agility, and quickness training
- Resistance training
- Stabilization endurance training
The Optimum Performance Training Model (OPT Model) progresses people through 5 phases 129:
- Phase 1 Stabilization and Endurance. Stabilization and Endurance is the foundation of the entire OPT Model. Before you start building training, you should have good stability, muscle endurance, and optimal movement patterns to prevent injury. During this first phase, you will perform 12 to 20 repetitions per set, your movement speed will slow down, and the intensity/weight used for exercises reduced to promote muscular endurance and ensure correct form and technique. Phase 1 is a great starting point for those who are new to training and is an opportune time to do questionnaires and fitness assessments to determine goals, establish baselines for training, and identify any movement compensations, respectively. And, for more experienced clients, Stabilization and Endurance phase is a great to include in their program to add different stresses and challenges to their body and will also become a critical phase to cycle back through between training periods in the other phases. Reinforcing correct movements in this phase can lead to strength gains — even with lighter weights — because of enhanced joint and postural control, and coordination. When progressing in this phase, a primary focus is on increasing proprioceptive demand (controlled instability) of the exercises, rather than just increasing the amount of weight you use.
- Phase 2 Strength Endurance. The Strength Endurance Phase gives you the chance to acclimate to heavier weights and higher training intensities. Workouts in the Strength Endurance Phase use superset techniques in which you will follow a more traditional strength exercise such as a bench press with an exercise that has similar biomechanical motions but requires more stabilization to perform (like a stability ball push-up). The Strength Endurance Phase is the logical next step from Phase 1 for increasing the intensity of your workouts. Sets increase to 2 to 4, repetitions will stay high (8-12 per exercise / 16-24 per superset). The supersets combined with decreased rest periods will elevate the challenge considerably leading not only to noticeable improvements in your strength and endurance but more significant your calorie expenditure too.
- Phase 3 Muscular Development/Hypertrophy. Phase 3 of the OPT Model is all about building strength and developing muscle. Muscular Development/Hypertrophy training is ideal for the adaptation of maximal muscle growth, by focusing on higher volumes of work at moderate-to-high intensity levels and with minimal rest periods between exercise sets. These training variables contribute to cellular changes that result in an overall increase in muscle size. If caloric intake is appropriate, the increased intensities and training volumes, and decreased rest periods experienced in this phase also make it great for those who aspire to change their body composition through fat/weight loss. Typically, workouts in this phase involve performing 3 to 6 sets of 6 to 12 reps per resistance exercise at intensities ranging from 75 to 85% of your one-rep max (the heaviest weight you can lift for just one go or for a single lift) or 1RM. You’ll typically be lifting at 85 to 100% of your one-rep max (1RM), so knowing your limits ensures your workouts remain challenging yet safe. And, don’t make the mistake of thinking your max on one lift applies to another – your bench press one-rep max (1RM) might be worlds apart from your back squat. Go here for a free online One Rep Max (1RM) calculator (https://www.nasm.org/resources/one-rep-max-calculator). You can also use the Standard One-Rep Max (1RM) table below. The “standard” one-rep max (1RM) values can differ based on age, gender, weight, training history, and other factors. Below is a generalized range for an average adult male, assuming he’s in decent shape but not necessarily an elite athlete.
- Phase 4 Maximal Strength. Phase 4 is geared towards enhancing your ability to produce maximal muscular force. Accomplishing this requires maximal efforts and lifting near-max/maximal loads during resistance training—ranging anywhere from 85 to 100% of your one-rep max for 1 to 5 repetitions. While similar to Muscular Development training in scope, developing maximal strength largely depends on neuromuscular adaptations resulting from consistently and progressively overloading muscles with higher intensities (loads). Because you will be lifting very heavy weights (near-max/maximal loads) in this phase, longer rest periods between exercise sets and higher volumes of training are usually required to optimize strength gains.
- Phase 5 Power. The 5th phase of the OPT Model focuses on using high force and high velocity exercises to increase power. One method to improve power is to perform supersets with contrasting loads. Like the supersets outlined and used in Phase 2 of the OPT Model, supersets in 5th phase will consist of two biomechanically similar exercises performed back-to-back. The first exercise should challenge near-max/maximal strength for 1 to 5 reps, and the second exercise should involve and challenge moving relatively low loads as fast and explosively as possible for 8 to 10 reps. The rationale for this sequence is to activate and tap into as many muscle fibers as possible with the maximal lift, while utilizing explosive exercises directly after to improve how quickly and efficiently those muscle fibers contract. Keeping with the upper body exercise theme used previously, an example Phase 5 superset is performing a bench press followed by a medicine ball chest pass.
Table 3. Standard One-Rep Maximum (1RM)
| Experience Level | Deadlift (kg) | Bench press kg) | Squat |
|---|---|---|---|
| Beginner | 60-100 | 40-70 | 50-85 |
| Intermediate | 100-140 | 70-100 | 85-125 |
| Advanced | 140-180 | 100-130> | 125-170 |
| Elite | 180 | 130 | 170 |
Footnote: Always consult with a fitness professional to set realistic and safe goals.
[Source 130 ]The Optimum Performance Training Model (OPT Model) should be thought of as a staircase, guiding you through different physical adaptation levels. This journey will involve going up and down the stairs, stopping at different steps, and moving to various heights, depending on your goals, needs, and abilities.
Table 4. Optimum Performance Training Model (OPT Model)
| Summary of the Optimum Performance Training Model (OPT Model) | |||
|---|---|---|---|
| Level | Phase | Primary Adaptations | Primary Methods of Progression |
| Stabilization | 1. Stabilization Endurance Training |
|
|
| Strength | 2. Strength Endurance Training |
|
|
| 3. Hypertrophy Training (Muscular Development Training) |
|
| |
| 4. Maximal Strength training |
|
| |
| Power | 5. Power Training |
|
|
To build muscle, you can:
- Train consistently: Train 2 or 3 times per week to give your muscles time to recover. Commit to a regular training routine and don’t take weeks off.
Make your workouts short and intense rather than long and leisurely. - Eat a protein-rich diet: Eat lean protein sources like chicken, fish, lean meat, and plant-based protein powder. The recommended protein intake is 0.8 to 1 gram per kilogram of body weight per day 42. For strength training athletes adequate protein intake should range between 1.2 and 1.7 grams of protein per kilogram of body weight per day or 0.5 to 0.8 grams per pound of body weight 43, 44, 45, 46. Try to eat protein within 30 minutes of a workout.
- Get enough rest: Your body releases growth hormones during sleep and rest, which helps muscles grow and repair.
- Do resistance training: Use weights, resistance bands, or your own body weight to build muscle. You can try:
- Compound exercises that work multiple muscle groups, like squats and bench presses
- Body weight exercises like pushups, pullups, lunges, and planks
- Progress your strength training: Increase the amount of weight you lift.
- Find a qualified training partner: A gym instructor or personal trainer can help you do exercises correctly and reduce your risk of injury.
- Mix in cardio: Short, sharp cardio can help burn fat.
You can expect to see noticeable muscle growth after 8 to 12 weeks, but it depends on many factors, including: nutrition, intensity, frequency, age, genetics, and sex.
The science behind muscle building
It is hypothesized that there are 3 three main mechanisms involved in the process of inducing muscle hypertrophy to resistance exercise 131, 132, 133, 134. These are:
- Muscular Damage
- Metabolic Stress
- Muscular tension.
Muscle fibers
Muscle fibers are single muscle cells that help your body perform a specific physical function 135. Like muscles themselves, not all muscle fibers are the same. There are 7 primary types of skeletal muscle fibers, including fast-twitch and slow-twitch. They each have different functions that are important to understand when it comes to movement and exercise programming.
Most experts agree that the distribution of muscle fiber types depend on the primary function of the muscle in question, as well as:
- Your Activity level. Your activity level and the types of activities that you do can affect how much you have of each muscle fiber type. For example, endurance athletes usually have a higher proportion of slow-twitch muscle fibers. And strength or power athletes usually have a higher amount of fast-twitch muscle fibers. But the exact proportion of each muscle fiber type can range from 15 to 85% of one type or the other, and the distribution also highly depends on the muscle. There’s also a theory that people who genetically have a higher percentage of slow-twitch fibers might be drawn to endurance activities, and people with more fast-twitch are drawn to power-based activities 136.
- Your Age. Muscle fiber type is also heavily influenced by the aging process. The percentage of type 2 fast-twitch muscle fibers tend to decline with age. People usually reach peak muscle mass by the age of 30, which means they have a higher percentage of type 2 fast-twitch muscle fibers. Women experience a rapid decline in muscle mass post-menopause. Men have a more gradual decline in muscle mass during and after their 40s. That means that as most people age, they have a higher number of slow-twitch type 1 muscle fibers. However, humans still need to have some muscle strength as they age, which is why most experts recommend that older people continue to do strength training exercises 137.
- Your Genetics.
Table 5. Muscle fiber types
| Characteristic | Slow-Twitch Type 1 | Fast-Twitch Type 2A | Fast-Twitch Type 2X or 2B |
|---|---|---|---|
| Activities | Marathons, distance running, swimming, cycling, power walking, endurance training | Powerlifting, sprinting, jumping, strength and agility training | Powerlifting, sprinting, jumping, strength and agility training |
| Muscle Fiber Size | Small | Large | Large |
| Force Production | Low | High | Very high |
| Resistance to Fatigue | Slow | Quick | Very quick |
| Contraction Speed | Slow | Quick | Very quick |
| Mitochondria | High | Medium | Low |
| Capillaries | High | Medium | Low |
| Myoglobin | High | Medium | Low |
| ATPase Level | Low | Medium | High |
| Oxidative Capacity | High | Medium | Low |
Footnotes: *ATP (adenosine triphosphate) is the body’s energy currency. ATP provides energy for your muscle cell to contract. Type 2 muscle fibers have more readily available ATP. Type 1 fibers rely on aerobic respiration (oxygen delivery) to produce ATP in the muscle cells.
** Oxidative capacity refers to how much oxygen a gram of muscle uses in an hour.
[Source 138 ]Slow-Twitch muscle fibers
Slow-twitch muscle fibers are the muscle cells responsible for endurance movements 138, 139. For example, the story of the tortoise and the hare. Slow-twitch or type 1 muscle fibers are like the tortoise. They don’t produce a lot of power, but they’re also resistant to fatigue and can contract for a long time 140. Slow-twitch type 1 muscle fibers help with a lot of your daily movements, like walking, cleaning your house, or sitting upright in a chair.
Type 1 muscle fibers get most of their energy (ATP) from aerobic respiration, meaning they need oxygen to function. The oxygen makes the muscle fibers look red, which is why slow-twitch fibers are sometimes called red fibers. Type 1 muscle fibers have a much better blood supply and ability to receive oxygen than type 2 fibers. They also have a high concentration of mitochondria which is the powerhouse of a cell where aerobic respiration takes place.
Because slow-twitch muscle fibers use oxygen to produce energy, they are more resistant to fatigue. Type 1 muscle fibers are responsible for endurance activities such as distance running, swimming, cycling, hiking, low-to-moderate intensity dancing, and walking.
Fast-Twitch muscle fibers
Fast-twitch muscle fibers are the muscle cells responsible for short, powerful movements 138, 139. Going back to the story between the tortoise and hare, your fast-twitch or type 2 fibers are like the hare. They can produce a lot more force and power for a short time, but they get fatigued fast 141, 142.
Type 2 muscle fibers are subdivided into type 2X and 2A 138.
Type 2X muscle fibers produce force that’s much greater than type 1 muscle fibers 138. However, they use anaerobic (without oxygen) metabolic pathways to get their energy (ATP) 138. That means they receive less blood flow and oxygen and can only produce force for short periods of time and are highly fatigable 143.
Type 2A muscle fibers are like a hybrid of type 1 and type 2X muscle fibers 138. Type 2A muscle fibers have elements of both type 1 and type 2X muscle fiber types. For example, type 2A muscle fibers use both aerobic and anaerobic pathways and produce a medium amount of power for a medium amount of time.
Most people have high numbers of type 2A muscle fibers that produce a medium amount of power and have medium fatigue resistance 138. Type 2A muscle fibers tend to be influenced more by training because they operate as fast-twitch fibers in untrained people and slow-twitch fibers in endurance-trained people. Rather than specifically trying to target type 2A muscle fibers with training, train for your sport or activity and allow these muscle fibers to adjust automatically 139.
When your body moves, it will use slow-twitch type 1 muscle fibers first. Then, if type 1 muscle fibers can’t produce enough force, the body will use fast-twitch type 2X and 2A muscle fibers to get more power.
So, if your fitness goals involve strength and power, you’ll want to focus on training type 2 muscle fibers. Technically, any resistance training will train both type 1and type 2 muscle fibers, but training with heavier loads at least 70% of one-repetition maximum (1RM) or lighter weights with explosive tempos are the best ways to activate and train type 2 fibers. These muscle fibers also tend to achieve muscle growth easily, which can be important for bodybuilders.
Note that 1 repetition maximum (1RM) is the heaviest weight a person can lift once while using proper form and performing a full range of motion. 1RM (1 repetition maximum) is a reliable way to measure your overall muscular strength and is often used by strength and conditioning coaches. 1RM is used to determine the appropriate load and intensity for resistance training. For example, if you want to do 5 back squats, you can calculate the weight to use by taking 85–90% of your 1RM.
Strength- and power-based activities typically use more type 2X and some 2A muscle fibers. These activities require a large amount of force to be produced at once with little need for fatigue resistance. Some activities that use type 2 muscle fibers include 138:
- Sprints. A sprint workout is a training routine that involves alternating short, high-intensity bursts of exercise with rest or low-intensity exercise. Sprinting is an anaerobic exercise that involves running at top speed for a short time. Your body can’t bring in enough oxygen quickly enough to provide energy for the movement. This produces lactic acid, which builds up in your blood and limits how long you can sprint. Sprinting helps you run faster and for longer by increasing your lactate threshold. Sprinting also builds muscle in your legs and stimulates growth throughout your body.
- Olympic weightlifting. Olympic weightlifting is an Olympic sport where athletes attempt to lift a barbell loaded with weight plates in a single lift. The two lifts in Olympic weightlifting are the snatch and the clean and jerk
- Powerlifting. Powerlifting focuses on lifting the most weight possible in three lifts: bench press, squat and deadlift.
- Plyometrics. Plyometrics are a type of exercise that uses explosive movements to build muscle power and improve physical performance. Plyometric exercises can include jumping, running, kicking, and throwing. Some examples of plyometric exercises include:
- Box jumps: Jump up and onto a box while lifting your arms for momentum, then jump back down
- Squat thrusters: Start in a high plank position, then jump your feet forward into a squat
- Jumping lunges: Stand with your feet shoulder-width apart, then jump while bringing one leg in front of you and the other behind you
- Squat jumps: Start standing on your toes, then flex your hips and jump up
To stimulate fast-twitch type 2 muscle fibers, lift higher loads (more than 70% one-repetition maximum [1RM]) at lower repetitions (1 to 12) or use lighter weight with explosive tempos. Some examples of fast-twitch stimulating exercises include 138:
- Heavy barbell squats. Heavy barbell squats are a compound exercise that involves holding a weighted barbell and performing a squat. To do a barbell squat stand with your feet shoulder-width apart, unrack the barbell, and hold it on your upper back. Keep your chest up and back straight, then hinge your hips and knees to lower your body into a squat position.
- Heavy barbell bench presses. A heavy barbell bench press is a weight training exercise that involves using a barbell to press a heavy weight upwards while lying on a bench. Remember to always have a spotter to help you lift safely.
- Medicine ball slams. A medicine ball slam is a full-body exercise that involves lifting a weighted ball overhead and slamming it into the ground. To do a medicine ball slam:
- Stand with your feet shoulder-width apart.
- Hold the ball in both hands at your torso.
- Squat down slightly.
- Inhale and press through your heels to stand up on the balls of your feet.
- Extend your knees and hips as you rise to lift the ball overhead.
- Slam the ball down between your feet with as much force as you can.
- Catch the ball on the rebound or pick it up for repetition.
- Chest pass. A chest pass is a passing technique in basketball and netball where a player holds the ball at chest level and throws it to another player, usually without the ball touching the floor.
- Box jumps. A box jump is a type of exercise that involves jumping from the ground onto an elevated surface, such as a box. Box jumps are a high-impact exercise that can help improve your lower body strength and speed, as well as your vertical jump range.
Fast-twitch fibers can also recruit slow-twitch fibers: endurance training at high-intensity intervals can be effective in improving aerobic power 144, 145.
Tapering during training programs (reducing volume and intensity), can also improve the strength and power of type 2A fibers without decreasing type 1 performance 146.
One study investigated muscle fiber changes in recreational runners training for a marathon 146. After 13 weeks of increasing mileage and a three-week tapering cycle, not only did the functions of type 1 and type 2A fibers improve, but type 2A continued to improve significantly during the tapering cycle 146.
Muscular Damage
Exercise training can result in localized damage to muscle tissue, which under certain conditions is theorized to generate a hypertrophic response 131, 147. When you perform an activity that is harder in some way than your current ability, that activity produces stress within one or more body systems that consequently requires these systems to adapt. It does this in many ways, from chemical to structural alterations, but the underlying principle remains the same 148, 149, 150, 148, 147, 151.
Stress causes an adaptation within a particular body system, which the body then responds to by reorganising and repairing itself to be better prepared for next time 152. In order to drive further adaptation, higher stress must be applied to signal to the system that an adaptation is required. The adaptation of the body system is specific to the stress applied, in other words, you adapt in a way that is directly related to the stress experienced 152. For example, calluses form on your hands as an adaptation to picking things up. They develop on your hands and not on your face because that is the area where the stress was applied. Gradual and planned increases in this cycle of stress, recovery and adaptation are what scientists refer to as progressive overload and it forms the basic principle of almost all human performance-based training around the world 152. The goal of building muscle is no different.
When you stress muscle tissue appropriately, either through the application of load, volume and time under tension, this creates a certain level of structural and systemic damage within the muscular tissue itself. As a result of that damage, the muscular system reorganises and repairs that tissue to a level above what previously existed. Muscular damage, often as a side effect, creates soreness and inflammation within the tissue and for years it was assumed that more soreness equated to more growth. Thankfully, scientists now understand that not to be the case, despite this misconception still being repeated in many places. That being said, while the level of soreness does not directly correlate to more muscular growth, the basic concept of stress, recovery and adaptation of the muscle tissue is still a factor that must be considered in the process. For years, muscular damage was the be-all and end-all of training, but we now understand several other important factors that contribute to the process of inducing muscle hypertrophy – metabolic stress and muscle tension.
Metabolic Stress
Metabolic stress is the concept of eliciting an influx of metabolic products into the muscle through manipulating reps, sets and rest time in an exercise. More commonly referred to as the “burn” or “pump”, this concept has existed for many decades in bodybuilding styles of training but has only more recently been researched and understood on a scientific level. The hypothesis that currently exists reports that increased metabolic activity in the muscle tissue (specifically metabolite accumulation) improves motor unit recruitment and drives the release of anabolic hormones accelerating muscle hypertrophy 153, 150, 154, 155, 156, 157, 158.
This concept was established through numerous studies where various set and rep range protocols were manipulated at the results closely studied. It was established that the primary driver of metabolic stress is:
- Higher volume exercises of between 10 to 12 repetitions.
- Performed at 70-80% 1RM (1 repetition maximum) for multiple sets. 1 repetition maximum (1RM) is the heaviest weight a person can lift once while using proper form and performing a full range of motion. 1RM (1 repetition maximum) is a reliable way to measure your overall muscular strength and is often used by strength and conditioning coaches. 1RM is used to determine the appropriate load and intensity for resistance training. For example, if you want to do 5 back squats, you can calculate the weight to use by taking 85–90% of your 1RM.
- With only 30 seconds to 1 minute of rest between each set.
While this might seem simple on the surface, how can this be applied on a practical level to your training? The fundamental problem with the metabolic stress model (apart from turning each workout into a hellish nightmare) is that it is very difficult to practically apply during large compound lifts, which should always form the foundation of any good program. You simply cannot perform 6-8 sets of 12 reps with only 1 minute of rest with any meaningful amount of weight (certainly not a true 80% of a 1RM which is advocated in several studies), at the very least not without compromising the form and safety of the trainee. This means that this type of training typically limits itself to isolation-based exercises that neither utilize as much muscle mass nor provide the systemic stress that compound lifts do. This reduces their overall ability to make any substantial change to muscle mass. The danger with this is when programs are designed based purely on this principle and forget to factor in the other primary factors of muscle hypertrophy, you are leaving a huge amount of untapped potential in your training, especially for beginners as well as leaving yourself open to possible injury, overtraining and chronic soreness 152.
Muscle Tension
The previously mentioned mechanisms of muscle hypertrophy cannot happen without the third being present. Increases in muscular tension are the only reliable and constant factor across all demographics that must be in place for hypertrophy to occur. Mechanically induced tension produced both by force generation and stretch is considered essential to muscle growth, and the combination of these stimuli appears to have a pronounced additive effect 159, 160, 134. More specifically, muscular tension is the contraction of the sarcomeres within the muscle tissue to produce force. Yet it should be noted that hypertrophy from muscular tension can be produced in the absence of both significant metabolic stress and muscular damage. How much muscular tension and under what conditions are where the debate lies 152.
Theoretically, muscular tension is produced whenever a muscle is under contraction, but in the gym, you typically obtain muscle tension under two conditions.
- When heavy weight is lifted for lower repetitions, or
- When lighter weights are lifted for higher repetitions but taken very close to failure.
These two events are similar in a sense that the repetitions involuntarily slow down the further through the set you move and both events can, and will, create fatigue forcing you to exert more force and effort into finishing the set 152. However, there are some less obvious differences between the two in terms of their performance.
A heavy set of say 5 at 90% 1RM (1 repetition maximum), requires more motor unit recruitment from the start of the set, due to the outright force production necessary to lift the weight in the first place. The more force you must produce, the more motor units must be recruited (particularly the larger type 2 fibres). In a lighter, but still taxing 12RM set (a repetition maximum of 12, which is the most weight you can lift and perform 12 repetitions of an exercise with proper form), the first 6 reps are submaximal, meaning that they do not require close to the maximal effort to move. However, as the set continues, you must then call into recruitment of more motor units (type 2) to complete the set. A moderate repetition scheme, like 8 to 12 repetitions per set with 60% to 80% of 1RM, is best for optimizing hypertrophic gains 161. Some research suggests that alternating between blocks of 10-12 reps at 70% and blocks of higher intensity, like 3-5 reps with 90% 1RM, can achieve similar muscular gains.
The question is then placed as to what method do you choose? Both can have significant results in the production of muscle hypertrophy and can generally be safely used by the most individuals. There are several things such as time, specific goals, and access to equipment, that all play into this. You want to choose the method that give you the most bang for your buck in the most efficient way possible.
Firstly, heavy sets feel heavy because they ARE heavy. They also give the added benefit of calling into contraction a higher number of motor units in order to move the weight. Secondly, you know that hypertrophy occurs as a result of more motor units being used, but also the ability to produce maximal force increases in those muscle fibers when they are called into contraction. In other words, the adaptation occurs in both the size of the muscle but also in its ability to produce force.
In contrast, lighter weights taken close to failure may feel difficult, and in some cases, will produce a good hypertrophic response. However, this method pales in comparison to the increase in overall force production of heavier weights completed for lower reps. The problem here is that due to the limited amount of adaptation towards more force production, the weight quickly becomes the bottleneck to continued progress. If you are getting bigger, but are not able to go up in weight, how do you continue to drive progress without now changing the rep ranges away from those best suited to continue to build muscle?
The point being made here is that a lot of time beginners looking to gain muscle will jump immediately into a highly complicated multi-factor program that is backed by “science” only to spend the next year on a hamster wheel making little to no progress. Getting the foundations right in any training regime is fundamental before you start debating the ins and outs or finer details, and anyone who has been training for any amount of time generally arrives at the same conclusion eventually.
The reality is that all you need at the beginning is a simple program that focuses on large compound lifts which utilize and progressively overload as much muscle mass as possible over the full range of motion.
Many people have wasted years in the gym only to find out that the answer was simple, not complexity. As your training progresses and goals become more clearly defined, then complexity can be added, but don’t waste precious time by trying to get complicated before you have to.
What builds muscle the most?
The best way to build muscle is to lift heavy weights and have proper nutrition. Weight training is the best way to keep the muscle mass you have and even increase your muscle mass. You’ll also need to consume more protein than your body removes to build muscle. Getting enough sleep is also important for muscle growth because your muscles recover and grow while you’re asleep. Try to get 8 to 10 hours of sleep per night. The National Sleep Foundation, an organization of doctors and researchers who specialize in sleep, recommends that adults (between the ages of 18 and 64) achieve between 7 to 9 hours of sleep per night 162. If you’re older than 65, you may need a little less: seven to eight hours is recommended.
For both men and women, sleeping less than 6 hours per night could result in higher belly fat levels. A lack of sleep can elevate the sympathetic nervous system (SNS), responsible for stimulating the metabolism to produce the energy for physical activity. Insufficient sleep could boost the hormones cortisol and epinephrine (adrenaline), which help release free fatty acids that you use for energy. When there is low physical activity, the free fatty acids can deposit in the adipose (fat) tissue of your abdominal region resulting in additional belly fat 163.
Another way that insufficient sleep could lead to weight gain is through the production of specific hormones. Grehlin is a hormone responsible for stimulating hunger. Leptin performs the opposite function and tells the body when it has had enough food intake. Poor sleep is associated with leptin levels decrease and ghrelin rises, potentially resulting in an increase in appetite and over-eating 164. In addition, staying awake late into the evening allows you more opportunities for mindless snacking on calorically-dense food. Furthermore, the added fatigue from lack of sleep may also lead you to skipping out on exercising, another setback for reaching your weight loss goals.
Insufficient sleep could also impair your body’s ability to properly recover from a challenging strength training workout designed to promote muscle growth. Growth hormone (GH), an anabolic hormone responsible for repairing muscle tissue damaged during exercise, is produced during stage 3 of Non-Rapid Eye Movement (NREM) sleep; achieving optimal sleep could be helping muscles grow 165.
While sleeping, your body will experience multiple cycles of sleep, each of which can last between 70 to 120 minutes; there are three stages of Non-Rapid Eye Movement (NREM) sleep and a fourth stage of Rapid Eye Movement (REM) sleep and over the course of one night, your body goes through the sleep stages every 90 minutes or so 166.
The Sleep Stages 167:
- Stage 1. Stage 1 of the sleep cycle is the lightest phase of sleep and generally lasts about seven minutes. The sleeper is somewhat alert and can be woken up easily. During this stage, your heartbeat and breathing slow down while your muscles begin to relax. Your brain produces alpha and theta waves.
- Stage 2. In Stage 2, your brain creates brief bursts of electrical activity known as “sleep spindles” that create a distinct sawtooth pattern on recordings of brain activity. Eventually, the waves continue to slow down. Stage 2 is still considered a light phase of sleep, but the sleeper is less likely to be awakened. Heart rate and breathing slow down even more, and the body temperature drops. Stage 2 lasts around 25 minutes.
- Stage 3. Stage 3 represents your body falling into a deep sleep, where slow wave sleep occurs. Your brain produces slower delta waves, and there’s no eye movement or muscle activity. As your brain produces even more delta waves, you enter an important restorative sleep stage from which it’s difficult to be awakened. This phase of deep sleep is what helps you feel refreshed in the morning. It’s also the phase in which your body repairs muscle and tissue, encourages growth and development, and improves immune function.
- Rapid Eye Movement (REM) Sleep. About 90 minutes after falling asleep, your body enters REM (Rapid Eye Movement) sleep and is named so for the way your eyes quickly move back and forth behind your eyelids. REM sleep is thought to play a role in central nervous system (brain and spinal cord) development in infants, which might explain why infants need more REM sleep than adults. REM sleep pattern is characterized by dreaming, since your brain is very active during this stage. Physically, your body experiences faster and irregular breathing, increased heart rate, and increased blood pressure; however, your arm and leg muscles become temporarily paralyzed, stopping you from acting out your dreams. REM sleep increases with each new sleep cycle, starting at about ten minutes during the first cycle and lasting up to an hour in the final cycle. Stage 4 is the last stage before the cycle repeats. This sleep stage is critical for learning, memory, daytime concentration, and your mood.
While all sleep stages are important, Stage 3 and REM sleep have unique benefits. One to two hours of Stage 3 deep sleep per night will keep the average adult feeling restored and healthy 167. If you’re regularly waking up tired, it could be that you’re not spending enough time in that deep sleep phase. Meanwhile, REM sleep helps your brain consolidate new information and maintain your mood – both critical for daily life 167. Talk to your doctor if you feel you are not getting the restful sleep that you need.
Strength training (muscle-strengthening exercise)
Strength training or muscle-strengthening exercise is a key component of overall health and fitness for everyone. Strength training or muscle-strengthening exercise can reduce your body fat, increase lean muscle mass and burn calories more efficiently. Strength training will make you stronger, leaner and healthier.
Strength training involves lifting free weights, using stationary weight machines, resistance bands, or your own body weight such as push-ups, pull-ups and squats to make your muscles stronger. Strength training classes that incorporate some or all of the above activities will improve your balance and prevent falls.
Strength training may help you:
- build and maintain strong muscles as you get older
- continue to perform activities of daily living, such as carrying groceries or moving furniture
- keep your bones strong, which may help prevent osteoporosis and fractures.
As you incorporate strength training exercises into your fitness routine, you may notice improvement in your strength over time. As your muscle mass increases, you’ll likely be able to lift weight more easily and for longer periods of time. If you keep it up, you can continue to increase your strength, even if you’re not in shape when you begin.
Strength-training tips:
- Aim for at least 2 days per week of strengthen-training activities.
- Try to perform each exercise 8 to 12 times. If that’s too hard, the weight you are lifting is too heavy. If it’s too easy, your weight is too light.
- Try to exercise all the major muscle groups. These groups include the muscles of your legs, hips, chest, back, abdomen, shoulders, and arms.
- Don’t work the same muscles 2 days in a row. Your muscles need time to recover.
If you are just starting out, using a weightlifting machine may be safer than dumbbells. As you get fit, you may want to add free-weight exercises with dumbbells.
You do not need a weight bench or large dumbbells to do strength training at home. You can use a pair of hand weights to do bicep curls. You can also use your own body weight: for example, push-ups, pull-ups and squats.
Proper form is very important when lifting weights. You may hurt yourself if you don’t lift weights properly. You may want to schedule a session with a certified fitness professional to learn which exercises to do and how to do them safely.
If you decide to buy a home gym, check how much weight it can support to make sure it is safe for you.
- Dwyer JT, Melanson KJ, Sriprachy-anunt U, et al. Dietary Treatment of Obesity. [Updated 2015 Feb 28]. In: Feingold KR, Anawalt B, Blackman MR, et al., editors. Endotext [Internet]. South Dartmouth (MA): MDText.com, Inc.; 2000-. Available from: https://www.ncbi.nlm.nih.gov/books/NBK278991[↩][↩][↩][↩][↩][↩][↩]
- Fabricatore AN, Wadden TA, Womble LG, Sarwer DB, Berkowitz RI, Foster GD, Brock JR. The role of patients’ expectations and goals in the behavioral and pharmacological treatment of obesity. Int J Obes (Lond). 2007 Nov;31(11):1739-45. doi: 10.1038/sj.ijo.0803649[↩]
- Van Itallie T. Dietary approaches to the treatment of obesity. In: Stunkard A, editor. Obesity. Philadelphia: WB Sanders, 1980: 249-261.[↩]
- Adam-Perrot A, Clifton P, Brouns F. Low-carbohydrate diets: nutritional and physiological aspects. Obes Rev. 2006 Feb;7(1):49-58. doi: 10.1111/j.1467-789X.2006.00222.x[↩]
- Global BMI Mortality Collaboration, Di Angelantonio E, Bhupathiraju ShN, Wormser D, Gao P, Kaptoge S, Berrington de Gonzalez A, Cairns BJ, Huxley R, Jackson ChL, Joshy G, Lewington S, Manson JE, Murphy N, Patel AV, Samet JM, Woodward M, Zheng W, Zhou M, Bansal N, Barricarte A, Carter B, Cerhan JR, Smith GD, Fang X, Franco OH, Green J, Halsey J, Hildebrand JS, Jung KJ, Korda RJ, McLerran DF, Moore SC, O’Keeffe LM, Paige E, Ramond A, Reeves GK, Rolland B, Sacerdote C, Sattar N, Sofianopoulou E, Stevens J, Thun M, Ueshima H, Yang L, Yun YD, Willeit P, Banks E, Beral V, Chen Zh, Gapstur SM, Gunter MJ, Hartge P, Jee SH, Lam TH, Peto R, Potter JD, Willett WC, Thompson SG, Danesh J, Hu FB. Body-mass index and all-cause mortality: individual-participant-data meta-analysis of 239 prospective studies in four continents. Lancet. 2016 Aug 20;388(10046):776-86. doi: 10.1016/S0140-6736(16)30175-1[↩]
- Action on obesity: Comprehensive care for all. Royal College of Physicians 10 Sep 2015. https://www.rcplondon.ac.uk/file/1283/download[↩]
- Panuganti KK, Nguyen M, Kshirsagar RK, et al. Obesity (Nursing) [Updated 2020 Dec 8]. In: StatPearls [Internet]. Treasure Island (FL): StatPearls Publishing; 2021 Jan-. Available from: https://www.ncbi.nlm.nih.gov/books/NBK568702[↩][↩]
- Trumbo P, Schlicker S, Yates AA, Poos M; Food and Nutrition Board of the Institute of Medicine, The National Academies. Dietary reference intakes for energy, carbohydrate, fiber, fat, fatty acids, cholesterol, protein and amino acids. J Am Diet Assoc. 2002 Nov;102(11):1621-30. doi: 10.1016/s0002-8223(02)90346-9. Erratum in: J Am Diet Assoc. 2003 May;103(5):563.[↩][↩][↩][↩]
- Adams KF, Schatzkin A, Harris TB, et al. Overweight, obesity, and mortality in a large prospective cohort of persons 50 to 71 years old. N Engl J Med. 2006;355:763–78. doi: 10.1056/NEJMoa055643[↩]
- Field AE, Barnoya J, Colditz G. Epidemiology and health and economic consequences of obesity. In: Wadden TA, Stunkard AJ, editors. Handbook of Obesity Treatment. New York: The Guilford Press; 2002. pp. 3–18.[↩]
- 2013 AHA/ACC/TOS guideline for the management of overweight and obesity in adults: a report of the American College of Cardiology/American Heart Association Task Force on Practice Guidelines and The Obesity Society. J Am Coll Cardiol. 2014 Jul 1;63(25 Pt B):2985-3023. doi: 10.1016/j.jacc.2013.11.004. Erratum in: J Am Coll Cardiol. 2014 Jul 1;63(25 Pt B):3029-3030.[↩]
- Thomas, D. M., Bouchard, C., Church, T., Slentz, C., Kraus, W. E., Redman, L. M., Martin, C. K., Silva, A. M., Vossen, M., Westerterp, K., & Heymsfield, S. B. (2012). Why do individuals not lose more weight from an exercise intervention at a defined dose? An energy balance analysis. Obesity reviews : an official journal of the International Association for the Study of Obesity, 13(10), 835–847. https://doi.org/10.1111/j.1467-789X.2012.01012.x[↩]
- Aim for Healthy Weight. https://www.nhlbi.nih.gov/health/educational/lose_wt/index.htm[↩]
- Slentz CA, Duscha BD, Johnson JL, Ketchum K, Aiken LB, Samsa GP, Houmard JA, Bales CW, Kraus WE. Effects of the amount of exercise on body weight, body composition, and measures of central obesity: STRRIDE–a randomized controlled study. Arch Intern Med. 2004 Jan 12;164(1):31-9. doi: 10.1001/archinte.164.1.31[↩]
- Velthuis-te Wierik EJ, Westerterp KR, Van den Berg H. Effect of a moderately energy-restricted diet on energy metabolism and body composition in non-obese men. Int J Obes Relat Metab Disord. 1995;19:318–24.[↩]
- U.S. Department of Agriculture and U.S. Department of Health and Human Services. Dietary Guidelines for Americans, 2020-2025. 9th Edition. December 2020. https://www.dietaryguidelines.gov/sites/default/files/2021-03/Dietary_Guidelines_for_Americans-2020-2025.pdf[↩]
- Mifflin MD, St Jeor ST, Hill LA, Scott BJ, Daugherty SA, Koh YO. A new predictive equation for resting energy expenditure in healthy individuals. Am J Clin Nutr. 1990 Feb;51(2):241-7. doi: 10.1093/ajcn/51.2.241[↩]
- American Dietetic Association (ADA). Adult Weight Management Guideline: Major Recommendations. ADA Evidence Analysis Library 2014. https://www.andeal.org/vault/pq132.pdf[↩]
- Clinical Guidelines on the Identification, Evaluation, and Treatment of Overweight and Obesity in Adults–The Evidence Report. National Institutes of Health, 6: 51S-179S. https://doi.org/10.1002/j.1550-8528.1998.tb00690.x[↩]
- American College of Cardiology/American Heart Association Task Force on Practice Guidelines, Obesity Expert Panel, 2013. Expert Panel Report: Guidelines (2013) for the management of overweight and obesity in adults. Obesity (Silver Spring). 2014 Jul;22 Suppl 2:S41-410. doi: 10.1002/oby.20660[↩][↩][↩]
- Morris AL, Mohiuddin SS. Biochemistry, Nutrients. [Updated 2023 May 1]. In: StatPearls [Internet]. Treasure Island (FL): StatPearls Publishing; 2024 Jan-. Available from: https://www.ncbi.nlm.nih.gov/books/NBK554545[↩][↩][↩][↩][↩][↩]
- Dietary Guidelines for Americans. https://www.dietaryguidelines.gov/[↩][↩][↩]
- Cummings JH, Stephen AM. Carbohydrate terminology and classification. Eur J Clin Nutr. 2007 Dec;61 Suppl 1:S5-18. doi: 10.1038/sj.ejcn.1602936[↩]
- Horton TJ, Drougas H, Brachey A, Reed GW, Peters JC, Hill JO. Fat and carbohydrate overfeeding in humans: different effects on energy storage. Am J Clin Nutr. 1995 Jul;62(1):19-29. doi: 10.1093/ajcn/62.1.19[↩]
- Minehira K, Vega N, Vidal H, Acheson K, Tappy L. Effect of carbohydrate overfeeding on whole body macronutrient metabolism and expression of lipogenic enzymes in adipose tissue of lean and overweight humans. Int J Obes Relat Metab Disord. 2004 Oct;28(10):1291-8. doi: 10.1038/sj.ijo.0802760[↩]
- Hall KD. A review of the carbohydrate-insulin model of obesity. Eur J Clin Nutr. 2017 Mar;71(3):323-326. doi: 10.1038/ejcn.2016.260. Epub 2017 Jan 11. Erratum in: Eur J Clin Nutr. 2017 May;71(5):679. doi: 10.1038/ejcn.2017.21[↩]
- Merchant AT, Vatanparast H, Barlas S, Dehghan M, Shah SM, De Koning L, Steck SE. Carbohydrate intake and overweight and obesity among healthy adults. J Am Diet Assoc. 2009 Jul;109(7):1165-72. doi: 10.1016/j.jada.2009.04.002[↩][↩]
- Yunsheng Ma, Barbara Olendzki, David Chiriboga, James R. Hebert, Youfu Li, Wenjun Li, MaryJane Campbell, Katherine Gendreau, Ira S. Ockene, Association between Dietary Carbohydrates and Body Weight, American Journal of Epidemiology, Volume 161, Issue 4, 15 February 2005, Pages 359–367, https://doi.org/10.1093/aje/kwi051[↩]
- Do Carbohydrates Control Body Fat? https://blog.nasm.org/do-carbohydrates-control-body-fat[↩]
- Nordmann AJ, Nordmann A, Briel M, Keller U, Yancy WS Jr, Brehm BJ, Bucher HC. Effects of low-carbohydrate vs low-fat diets on weight loss and cardiovascular risk factors: a meta-analysis of randomized controlled trials. Arch Intern Med. 2006 Feb 13;166(3):285-93. doi: 10.1001/archinte.166.3.285. Erratum in: Arch Intern Med. 2006 Apr 24;166(8):932.[↩]
- Hall KD, Bemis T, Brychta R, et al. Calorie for Calorie, Dietary Fat Restriction Results in More Body Fat Loss than Carbohydrate Restriction in People with Obesity. Cell Metab. 2015 Sep 1;22(3):427-36. doi: 10.1016/j.cmet.2015.07.021[↩]
- Hall KD, Chen KY, Guo J, et al. Energy expenditure and body composition changes after an isocaloric ketogenic diet in overweight and obese men. Am J Clin Nutr. 2016 Aug;104(2):324-33. doi: 10.3945/ajcn.116.133561[↩]
- Hall KD, Chen KY, Guo J, Lam YY, Leibel RL, Mayer LE, Reitman ML, Rosenbaum M, Smith SR, Walsh BT, Ravussin E. Energy expenditure and body composition changes after an isocaloric ketogenic diet in overweight and obese men. Am J Clin Nutr. 2016 Aug;104(2):324-33. doi: 10.3945/ajcn.116.133561[↩]
- Burke, L.M. (2021), Ketogenic low-CHO, high-fat diet: the future of elite endurance sport?. J Physiol, 599: 819-843. https://doi.org/10.1113/JP278928[↩]
- Burke LM, Ross ML, Garvican-Lewis LA, Welvaert M, Heikura IA, Forbes SG, Mirtschin JG, Cato LE, Strobel N, Sharma AP, Hawley JA. Low carbohydrate, high fat diet impairs exercise economy and negates the performance benefit from intensified training in elite race walkers. J Physiol. 2017 May 1;595(9):2785-2807. doi: 10.1113/JP273230[↩]
- How Many Carbs Should You Eat a Day to Lose Weight? https://blog.nasm.org/how-many-carbs-should-you-eat-a-day-to-lose-weight[↩]
- LaPelusa A, Kaushik R. Physiology, Proteins. [Updated 2022 Nov 14]. In: StatPearls [Internet]. Treasure Island (FL): StatPearls Publishing; 2024 Jan-. Available from: https://www.ncbi.nlm.nih.gov/books/NBK555990[↩][↩][↩][↩]
- Protein Foods. https://www.myplate.gov/eat-healthy/protein-foods[↩][↩]
- Lopez MJ, Mohiuddin SS. Biochemistry, Essential Amino Acids. [Updated 2024 Apr 30]. In: StatPearls [Internet]. Treasure Island (FL): StatPearls Publishing; 2024 Jan-. Available from: https://www.ncbi.nlm.nih.gov/books/NBK557845[↩][↩][↩][↩]
- Pasiakos SM, Agarwal S, Lieberman HR, Fulgoni VL 3rd. Sources and Amounts of Animal, Dairy, and Plant Protein Intake of US Adults in 2007-2010. Nutrients. 2015 Aug 21;7(8):7058-69. doi: 10.3390/nu7085322[↩]
- O’Neil CE, Keast DR, Fulgoni VL, Nicklas TA. Food sources of energy and nutrients among adults in the US: NHANES 2003–2006. Nutrients. 2012 Dec 19;4(12):2097-120. doi: 10.3390/nu4122097[↩]
- Acheson KJ. Diets for body weight control and health: the potential of changing the macronutrient composition. Eur J Clin Nutr. 2013 May;67(5):462-6. doi: 10.1038/ejcn.2012.194[↩][↩][↩][↩]
- Protein Intake for Optimal Muscle Maintenance. https://www.acsm.org/docs/default-source/files-for-resource-library/protein-intake-for-optimal-muscle-maintenance.pdf[↩][↩][↩][↩][↩][↩][↩][↩][↩][↩][↩][↩][↩][↩][↩][↩][↩][↩][↩]
- Hector A. J., Phillips S. M. Protein recommendations for weight loss in elite athletes: a focus on body composition and performance. International Journal of Sport Nutrition and Exercise Metabolism . 2018;28(2):170–177. doi: 10.1123/ijsnem.2017-0273[↩][↩][↩][↩][↩]
- Passariello C. L., Marchionni S., Carcuro M., et al. The Mediterranean athlete’s nutrition: are protein supplements necessary? Nutrients . 2020;12(12):p. 3681. doi: 10.3390/nu12123681[↩][↩][↩][↩]
- Stokes T., Hector A., Morton R., McGlory C., Phillips S. Recent perspectives regarding the role of dietary protein for the promotion of muscle hypertrophy with resistance exercise training. Nutrients . 2018;10(2):p. 180. doi: 10.3390/nu10020180[↩][↩][↩][↩][↩]
- Areta J.L., Burke L.M., Ross M.L., Camera D.M., West D.W., Broad E.M., Jeacocke N.A., Moore D.R., Stellingwerff T., Phillips S.M., et al. Timing and distribution of protein ingestion during prolonged recovery from resistance exercise alters myofibrillar protein synthesis. J. Physiol. 2013;591:2319–2331. doi: 10.1113/jphysiol.2012.244897[↩][↩]
- Cribb P.J., Williams A.D., Carey M.F., Hayes A. The effect of whey isolate and resistance training on strength, body composition, and plasma glutamine. Int. J. Sport Nutr. Exerc. Metab. 2006;16:494–509. doi: 10.1123/ijsnem.16.5.494[↩][↩]
- Frontera WR, Ochala J. Skeletal muscle: a brief review of structure and function. Calcif Tissue Int. 2015 Mar;96(3):183-95. doi: 10.1007/s00223-014-9915-y[↩]
- Mitchell L, Hackett D, Gifford J, Estermann F, O’Connor H. Do Bodybuilders Use Evidence-Based Nutrition Strategies to Manipulate Physique? Sports (Basel). 2017 Sep 29;5(4):76. doi: 10.3390/sports5040076[↩][↩]
- Morton RW, McGlory C, Phillips SM. Nutritional interventions to augment resistance training-induced skeletal muscle hypertrophy. Front Physiol. (2015) 6:245. doi: 10.3389/fphys.2015.00245[↩]
- Tarnopolsky MA, Atkinson SA, MacDougall JD, Chesley A, Phillips S, Schwarcz HP. Evaluation of protein requirements for trained strength athletes. J Appl Physiol. (1992) 73:1986–95. doi: 10.1152/jappl.1992.73.5.1986[↩]
- Moore DR, Robinson MJ, Fry JL, Tang JE, Glover EI, Wilkinson SB, et al. Ingested protein dose response of muscle and albumin protein synthesis after resistance exercise in young men. Am J Clin Nutr. (2009) 89:161–8. doi: 10.3945/ajcn.2008.26401[↩]
- Witard OC, Jackman SR, Breen L, Smith K, Selby A, Tipton KD. Myofibrillar muscle protein synthesis rates subsequent to a meal in response to increasing doses of whey protein at rest and after resistance exercise. Am J Clin Nutr. (2014) 99:86–95. doi: 10.3945/ajcn.112.055517[↩][↩]
- Macnaughton LS, Wardle SL, Witard OC, McGlory C, Hamilton DL, Jeromson S, et al. The response of muscle protein synthesis following whole-body resistance exercise is greater following 40 g than 20 g of ingested whey protein. Physiol Rep. (2016) 4:e12893. doi: 10.14814/phy2.12893[↩]
- Devries MC, Phillips SM. Supplemental protein in support of muscle mass and health: advantage whey. J Food Sci. (2015) 80(Suppl. 1):A8–15. doi: 10.1111/1750-3841.12802[↩]
- Areta JL, Burke LM, Ross ML, Camera DM, West DW, Broad EM, et al. Timing and distribution of protein ingestion during prolonged recovery from resistance exercise alters myofibrillar protein synthesis. J Physiol. (2013) 591:2319–31. doi: 10.1113/jphysiol.2012.244897[↩]
- Devries MC, Phillips SM. Supplemental protein in support of muscle mass and health: advantage whey. J Food Sci. 2015 Mar;80 Suppl 1:A8-A15. Doi: 10.1111/1750-3841.12802[↩][↩]
- Spendlove J., Mitchell L., Gifford J., Hackett D., Slater G., Cobley S., O’Connor H. Dietary intake of competitive bodybuilders. Sports Med. 2015;45:1041–1063. doi: 10.1007/s40279-015-0329-4[↩][↩]
- Devries MC, Phillips SM. Supplemental protein in support of muscle mass and health: advantage whey. J Food Sci. 2015 Mar;80 Suppl 1:A8-A15. doi: 10.1111/1750-3841.12802[↩][↩][↩]
- Morton RW, Murphy KT, McKellar SR, Schoenfeld BJ, Henselmans M, Helms E, et al. A systematic review, meta-analysis and meta-regression of the effect of protein supplementation on resistance training-induced gains in muscle mass and strength in healthy adults. Br J Sports Med. (2018) 52:376–84. doi: 10.1136/bjsports-2017-097608[↩]
- Finger D., Goltz F. R., Umpierre D., Meyer E., Rosa L. H. T., Schneider C. D. Effects of protein supplementation in older adults undergoing resistance training: a systematic review and meta-analysis. Sports Medicine . 2015;45(2):245–255. doi: 10.1007/s40279-014-0269-4[↩]
- Morton R. W., Murphy K. T., McKellar S. R., et al. A systematic review, meta-analysis and meta-regression of the effect of protein supplementation on resistance training-induced gains in muscle mass and strength in healthy adults. British Journal of Sports Medicine . 2018;52(6):376–384. doi: 10.1136/bjsports-2017-097608[↩]
- Phillips S. M., Van Loon L. J. C. Dietary protein for athletes: from requirements to optimum adaptation. Journal of Sports Sciences . 2011;29(1):S29–S38. doi: 10.1080/02640414.2011.619204[↩]
- Porcelli S, Pugliese L, Rejc E, Pavei G, Bonato M, Montorsi M, La Torre A, Rasica L, Marzorati M. Effects of a Short-Term High-Nitrate Diet on Exercise Performance. Nutrients. 2016 Aug 31;8(9):534. doi: 10.3390/nu8090534[↩]
- Butts J, Jacobs B, Silvis M. Creatine Use in Sports. Sports Health. 2018 Jan/Feb;10(1):31-34. Doi: 10.1177/1941738117737248[↩][↩]
- Bird SP. Creatine supplementation and exercise performance: a brief review. J Sports Sci Med. 2003 Dec 1;2(4):123-32. https://pmc.ncbi.nlm.nih.gov/articles/PMC3963244[↩]
- Cooke WH, Grandjean PW, Barnes WS. Effect of oral creatine supplementation on power output and fatigue during bicycle ergometry. J Appl Physiol (1985). 1995 Feb;78(2):670-3. doi: 10.1152/jappl.1995.78.2.670[↩]
- Rawson ES, Gunn B, Clarkson PM. The effects of creatine supplementation on exercise-induced muscle damage. J Strength Cond Res. 2001 May;15(2):178-84.[↩]
- Ellery SJ, Walker DW, Dickinson H. Creatine for women: a review of the relationship between creatine and the reproductive cycle and female-specific benefits of creatine therapy. Amino Acids. 2016 Aug;48(8):1807-17. doi: 10.1007/s00726-016-2199-y[↩]
- Molina Juan L, Sospedra I, Perales A, González-Díaz C, Gil-Izquierdo A, Martínez-Sanz JM. Analysis of health claims regarding creatine monohydrate present in commercial communications for a sample of European sports foods supplements. Public Health Nutr. 2021 Jan 20;24(4):1-9. doi: 10.1017/S1368980020005121[↩][↩]
- Candow DG, Chilibeck PD, Forbes SC. Creatine supplementation and aging musculoskeletal health. Endocrine. 2014 Apr;45(3):354-61. doi: 10.1007/s12020-013-0070-4[↩][↩]
- Institute of Medicine (US) Committee on Nutrition, Trauma, and the Brain; Erdman J, Oria M, Pillsbury L, editors. Nutrition and Traumatic Brain Injury: Improving Acute and Subacute Health Outcomes in Military Personnel. Washington (DC): National Academies Press (US); 2011. 10, Creatine. Available from: https://www.ncbi.nlm.nih.gov/books/NBK209321[↩]
- Stricker PR. Other ergogenic agents. Clin Sports Med. 1998 Apr;17(2):283-97. doi: 10.1016/s0278-5919(05)70081-8[↩]
- Butts J, Jacobs B, Silvis M. Creatine Use in Sports. Sports Health. 2018 Jan/Feb;10(1):31-34. doi: 10.1177/1941738117737248[↩][↩]
- Bemben MG, Lamont HS. Creatine supplementation and exercise performance: recent findings. Sports Med. 2005;35(2):107-25. doi: 10.2165/00007256-200535020-00002[↩]
- Branch JD. Effect of creatine supplementation on body composition and performance: a meta-analysis. Int J Sport Nutr Exerc Metab. 2003 Jun;13(2):198-226. doi: 10.1123/ijsnem.13.2.198[↩]
- Institute of Medicine (US) Committee on Dietary Supplement Use by Military Personnel; Greenwood MRC, Oria M, editors. Use of Dietary Supplements by Military Personnel. Washington (DC): National Academies Press (US); 2008. Available from: https://www.ncbi.nlm.nih.gov/books/NBK3977[↩][↩]
- McMorris T, Harris RC, Howard AN, Langridge G, Hall B, Corbett J, Dicks M, Hodgson C. Creatine supplementation, sleep deprivation, cortisol, melatonin and behavior. Physiol Behav. 2007 Jan 30;90(1):21-8. doi: 10.1016/j.physbeh.2006.08.024[↩]
- Shao A, Hathcock JN. Risk assessment for creatine monohydrate. Regul Toxicol Pharmacol. 2006 Aug;45(3):242-51. doi: 10.1016/j.yrtph.2006.05.005[↩][↩]
- Burke LM. Practical Issues in Evidence-Based Use of Performance Supplements: Supplement Interactions, Repeated Use and Individual Responses. Sports Med. 2017 Mar;47(Suppl 1):79-100. doi: 10.1007/s40279-017-0687-1[↩]
- Rawson ES, Miles MP, Larson-Meyer DE. Dietary Supplements for Health, Adaptation, and Recovery in Athletes. Int J Sport Nutr Exerc Metab. 2018 Mar 1;28(2):188-199. doi: 10.1123/ijsnem.2017-0340[↩][↩]
- Kreider RB, Kalman DS, Antonio J, Ziegenfuss TN, Wildman R, Collins R, Candow DG, Kleiner SM, Almada AL, Lopez HL. International Society of Sports Nutrition position stand: safety and efficacy of creatine supplementation in exercise, sport, and medicine. J Int Soc Sports Nutr. 2017 Jun 13;14:18. doi: 10.1186/s12970-017-0173-z[↩]
- Maughan RJ, Greenhaff PL, Hespel P. Dietary supplements for athletes: emerging trends and recurring themes. J Sports Sci. 2011;29 Suppl 1:S57-66. doi: 10.1080/02640414.2011.587446[↩]
- European Comission (2018) EU Register on Nutrition and Health Claims. Brussels: European Commission.[↩]
- EFSA NDA Panel (EFSA Panel on Dietetic Products, Nutrition and Allergies), 2016. Scientific opinion on creatine in combination with resistance training and improvement in muscle strength: evaluation of a health claim pursuant to Article 13(5) of Regulation (EC) No 1924/2006. EFSA Journal 2016; 14(2):4400, 17 pp. doi:10.2903/j.efsa.2016.4400[↩][↩][↩][↩]
- Herriman M, Fletcher L, Tchaconas A, Adesman A, Milanaik R. Dietary Supplements and Young Teens: Misinformation and Access Provided by Retailers. Pediatrics. 2017 Feb;139(2):e20161257. doi: 10.1542/peds.2016-1257[↩]
- Bodybuilding and Performance Enhancement Supplements: What You Need To Know. https://www.nccih.nih.gov/health/bodybuilding-and-performance-enhancement-supplements[↩][↩]
- Alvares TS, Conte-Junior CA, Silva JT, Paschoalin VM. L-arginine does not improve biochemical and hormonal response in trained runners after 4 weeks of supplementation. Nutr Res. 2014 Jan;34(1):31-9. doi: 10.1016/j.nutres.2013.10.006[↩]
- Austin KG, McLellan TM, Farina EK, McGraw SM, Lieberman HR. Soldier use of dietary supplements, including protein and body building supplements, in a combat zone is different than use in garrison. Appl Physiol Nutr Metab. 2016 Jan;41(1):88-95. doi: 10.1139/apnm-2015-0387[↩]
- Navarro VJ, Barnhart H, Bonkovsky HL, Davern T, Fontana RJ, Grant L, Reddy KR, Seeff LB, Serrano J, Sherker AH, Stolz A, Talwalkar J, Vega M, Vuppalanchi R. Liver injury from herbals and dietary supplements in the U.S. Drug-Induced Liver Injury Network. Hepatology. 2014 Oct;60(4):1399-408. doi: 10.1002/hep.27317[↩]
- Ronis MJJ, Pedersen KB, Watt J. Adverse Effects of Nutraceuticals and Dietary Supplements. Annu Rev Pharmacol Toxicol. 2018 Jan 6;58:583-601. doi: 10.1146/annurev-pharmtox-010617-052844[↩]
- Bellinger PM. β-Alanine supplementation for athletic performance: an update. J Strength Cond Res. 2014 Jun;28(6):1751-70. doi: 10.1519/JSC.0000000000000327[↩]
- U.S. Food and Drug Administration website. BMPEA in Dietary Supplements. https://www.fda.gov/food/information-select-dietary-supplement-ingredients-and-other-substances/bmpea-dietary-supplements[↩]
- U.S. Food and Drug Administration website. Tainted Body Building Products. https://www.fda.gov/drugs/medication-health-fraud/tainted-body-building-products[↩]
- U.S. Food and Drug Administration website. DMAA in Products Marketed as Dietary Supplements. https://www.fda.gov/food/information-select-dietary-supplement-ingredients-and-other-substances/dmaa-products-marketed-dietary-supplements[↩][↩]
- Del Razo Olvera FM, Melgarejo Hernández MA, Mehta R, Aguilar Salinas CA. Setting the Lipid Component of the Diet: A Work in Process. Adv Nutr. 2017 Jan 17;8(1):165S-172S. doi: 10.3945/an.116.013672[↩]
- Tvrzicka E, Kremmyda LS, Stankova B, Zak A. Fatty acids as biocompounds: their role in human metabolism, health and disease–a review. Part 1: classification, dietary sources and biological functions. Biomed Pap Med Fac Univ Palacky Olomouc Czech Repub. 2011 Jun;155(2):117-30. doi: 10.5507/bp.2011.038[↩]
- Jacobs DR, Tapsell LC. Food synergy: the key to a healthy diet. Proc Nutr Soc. 2013 May;72(2):200-6. doi: 10.1017/S0029665112003011[↩]
- Jones PJH, Papamandjaris AA. Lipids: cellular metabolism. In: Erdman JW, Macdonald IA, Zeisel SH, eds. Present Knowledge in Nutrition. 10th ed. Washington, DC: Wiley-Blackwell; 2012:132-48.[↩]
- Harris WS. Omega-3 fatty acids. In: Coates PM, Betz JM, Blackman MR, et al., eds. Encyclopedia of Dietary Supplements. 2nd ed. London and New York: Informa Healthcare; 2010:577-86.[↩]
- Omega-3 Fatty Acids, https://ods.od.nih.gov/factsheets/Omega3FattyAcids-HealthProfessional[↩][↩]
- Jones PJH, Rideout T. Lipids, sterols, and their metabolites. In: Ross AC, Caballero B, Cousins RJ, Tucker KL, Ziegler TR, eds. Modern Nutrition in Health and Disease. 11th ed. Baltimore, MD: Lippincott Williams & Wilkins; 2014.[↩]
- Simopoulos AP. The importance of the omega-6/omega-3 fatty acid ratio in cardiovascular disease and other chronic diseases. Exp Biol Med (Maywood). 2008 Jun;233(6):674-88. doi: 10.3181/0711-MR-311[↩]
- Wang C, Chung M, Lichtenstein A, Balk E, Kupelnick B, DeVine D, et al. Effects of omega-3 fatty acids on cardiovascular disease. Summary, evidence report/technology assessment no. 94. https://archive.ahrq.gov/downloads/pub/evidence/pdf/o3cardio/o3cardio.pdf[↩]
- Stanley JC, Elsom RL, Calder PC, Griffin BA, Harris WS, Jebb SA, Lovegrove JA, Moore CS, Riemersma RA, Sanders TA. UK Food Standards Agency Workshop Report: the effects of the dietary n-6:n-3 fatty acid ratio on cardiovascular health. Br J Nutr. 2007 Dec;98(6):1305-10. doi: 10.1017/S000711450784284X[↩]
- Harris WS, Davidson MH. RE: Plasma phospholipid fatty acids and prostate cancer risk in the SELECT trial. J Natl Cancer Inst. 2014 Apr;106(4):dju019. doi: 10.1093/jnci/dju019[↩]
- Fritsche KL. Too much linoleic acid promotes inflammation-doesn’t it? Prostaglandins Leukot Essent Fatty Acids. 2008 Sep-Nov;79(3-5):173-5. doi: 10.1016/j.plefa.2008.09.019[↩]
- Very Low-Calorie Diets. https://www.govinfo.gov/content/pkg/GOVPUB-HE20-PURL-LPS78142/pdf/GOVPUB-HE20-PURL-LPS78142.pdf[↩]
- Pritikin M, McGrady PM. The Pritikin Program for Diet and Exercise. New York: Bantum Books, 1980.[↩]
- Ornish D. Can lifestyle changes reverse coronary heart disease? World Rev Nutr Diet. 1993;72:38-48. doi: 10.1159/000422326[↩][↩][↩]
- Hand B and Romine S. The Spark Solution. HarperOne, 2014.[↩]
- Resistance Training Recommendations to Maximize Muscle Hypertrophy in an Athletic Population: Position Stand of the IUSCA. https://journal.iusca.org/index.php/Journal/article/view/81/140[↩]
- Booth FW, Thomason DB. Molecular and cellular adaptation of muscle in response to exercise: perspectives of various models. Physiol Rev. 1991;71(2):541–585. doi: 10.1152/physrev.1991.71.2.541[↩]
- Ratamess NA, Alvar BA, Evetoch TK, Housh TJ, Kibler WB, Kraemer WJ. Progression models in resistance training for healthy adults. Med Sci Sports Exerc. 2009;41(3):687–708. doi: 10.1249/MSS.0b013e3181915670[↩]
- Refalo MC, Helms ER, Robinson ZP, Hamilton DL, Fyfe JJ. Similar muscle hypertrophy following eight weeks of resistance training to momentary muscular failure or with repetitions-in-reserve in resistance-trained individuals. J Sports Sci. 2024 Jan;42(1):85-101. https://www.tandfonline.com/doi/full/10.1080/02640414.2024.2321021[↩]
- Hickmott LM, Chilibeck PD, Shaw KA, Butcher SJ. The Effect of Load and Volume Autoregulation on Muscular Strength and Hypertrophy: A Systematic Review and Meta-Analysis. Sports Med Open. 2022 Jan 15;8(1):9. doi: 10.1186/s40798-021-00404-9[↩]
- Refalo MC, Helms ER, Trexler ET, Hamilton DL, Fyfe JJ. Influence of Resistance Training Proximity-to-Failure on Skeletal Muscle Hypertrophy: A Systematic Review with Meta-analysis. Sports Med. 2023 Mar;53(3):649-665. doi: 10.1007/s40279-022-01784-y[↩]
- Wackerhage H, Schoenfeld BJ, Hamilton DL, Lehti M, Hulmi JJ. Stimuli and sensors that initiate skeletal muscle hypertrophy following resistance exercise. J Appl Physiol (1985). 2019 Jan 1;126(1):30-43. doi: 10.1152/japplphysiol.00685.2018[↩]
- Haun CT, Vann CG, Roberts BM, Vigotsky AD, Schoenfeld BJ, Roberts MD. A Critical Evaluation of the Biological Construct Skeletal Muscle Hypertrophy: Size Matters but So Does the Measurement. Front Physiol. 2019 Mar 12;10:247. doi: 10.3389/fphys.2019.00247[↩]
- Brechue WF, Abe T. The role of FFM accumulation and skeletal muscle architecture in powerlifting performance. Eur J Appl Physiol. (2002) 86:327–36. doi: 10.1007/s00421-001-0543-7[↩]
- Siahkouhian M, Hedayatneja M. Correlations of anthropometric and body composition variables with the performance of young elite weightlifters. J Hum Kinet. (2010) 25:125–31. doi: 10.2478/v10078-010-0040-3[↩]
- Alway SE, MacDougall JD, Sale DG, Sutton JR, McComas AJ. Functional and structural adaptations in skeletal muscle of trained athletes. J Appl Physiol. (1988) 64:1114–20. doi: 10.1152/jappl.1988.64.3.1114[↩]
- Hackett D.A., Johnson N.A., Chow C.M. Training practices and ergogenic aids used by male bodybuilders. J. Strength Cond. Res. 2013;27:1609–1617. doi: 10.1519/JSC.0b013e318271272a[↩]
- Sartori, R., Romanello, V. & Sandri, M. Mechanisms of muscle atrophy and hypertrophy: implications in health and disease. Nat Commun 12, 330 (2021). https://doi.org/10.1038/s41467-020-20123-1[↩]
- Schoenfeld, Brad J. The Mechanisms of Muscle Hypertrophy and Their Application to Resistance Training. Journal of Strength and Conditioning Research 24(10):p 2857-2872, October 2010. | DOI: 10.1519/JSC.0b013e3181e840f3[↩]
- 15 – Therapeutic Exercise. David X. Cifu, Braddom’s Physical Medicine and Rehabilitation (Sixth Edition), Elsevier, 2021, Pages 291-315.e4, ISBN 780323625395 https://doi.org/10.1016/B978-0-323-62539-5.00015-1[↩]
- Defining Muscular Hypertrophy & Growth Training Best Practices. https://blog.nasm.org/sports-performance/defining-muscular-hypertrophy-and-training-growth-best-practices[↩][↩][↩][↩][↩][↩]
- The Optimum Performance Training® Model. https://www.nasm.org/certified-personal-trainer/the-opt-model[↩][↩][↩]
- One Rep calculator. https://www.nasm.org/resources/one-rep-max-calculator[↩]
- Evans WJ. Effects of exercise on senescent muscle. Clin Orthop Relat Res. 2002 Oct;(403 Suppl):S211-20. doi: 10.1097/00003086-200210001-00025[↩][↩]
- Jones DA, Rutherford OM. Human muscle strength training: the effects of three different regimens and the nature of the resultant changes. J Physiol. 1987 Oct;391:1-11. doi: 10.1113/jphysiol.1987.sp016721[↩]
- Shinohara M, Kouzaki M, Yoshihisa T, Fukunaga T. Efficacy of tourniquet ischemia for strength training with low resistance. Eur J Appl Physiol Occup Physiol. 1998;77(1-2):189-91. doi: 10.1007/s004210050319[↩]
- Vandenburgh HH. Motion into mass: how does tension stimulate muscle growth? Med Sci Sports Exerc. 1987 Oct;19(5 Suppl):S142-9.[↩][↩]
- Tihanyi J., Apor P., Fekete G. Force-Velocity-Power Characteristics and Fiber Composition in Human Knee Extensor Muscles. Eur. J. Appl. Physiol. Occup. Physiol. 1982;48:331–343. doi: 10.1007/BF00430223[↩]
- Lievens E, Klass M, Bex T, Derave W. Muscle fiber typology substantially influences time to recover from high-intensity exercise. J Appl Physiol (1985). 2020 Mar 1;128(3):648-659. doi: 10.1152/japplphysiol.00636.2019[↩]
- Miljkovic N, Lim JY, Miljkovic I, Frontera WR. Aging of skeletal muscle fibers. Ann Rehabil Med. 2015 Apr;39(2):155-62. doi: 10.5535/arm.2015.39.2.155[↩]
- Fast-Twitch Vs. Slow-Twitch Muscle Fiber Types + Training Tips. https://blog.nasm.org/fitness/understanding-fast-twitch-vs-slow-twitch-mucle-fibers[↩][↩][↩][↩][↩][↩][↩][↩][↩][↩]
- Plotkin DL, Roberts MD, Haun CT, Schoenfeld BJ. Muscle Fiber Type Transitions with Exercise Training: Shifting Perspectives. Sports (Basel). 2021 Sep 10;9(9):127. doi: 10.3390/sports9090127[↩][↩][↩]
- Tesch P.A., Karlsson J. Muscle Fiber Types and Size in Trained and Untrained Muscles of Elite Athletes. J. Appl. Physiol. (1985) 1985;59:1716–1720. doi: 10.1152/jappl.1985.59.6.1716[↩]
- Serrano N., Colenso-Semple L.M., Lazauskus K.K., Siu J.W., Bagley J.R., Lockie R.G., Costa P.B., Galpin A.J. Extraordinary Fast-Twitch Fiber Abundance in Elite Weightlifters. PLoS ONE. 2019;14:e0207975. doi: 10.1371/journal.pone.0207975[↩]
- Trappe S., Luden N., Minchev K., Raue U., Jemiolo B., Trappe T.A. Skeletal Muscle Signature of a Champion Sprint Runner. J. Appl. Physiol. (1985) 2015;118:1460–1466. doi: 10.1152/japplphysiol.00037.2015[↩]
- Smerdu V., Karsch-Mizrachi I., Campione M., Leinwand L., Schiaffino S. Type IIx Myosin Heavy Chain Transcripts Are Expressed in Type IIb Fibers of Human Skeletal Muscle. Am. J. Physiol. 1994;267:C1723–C1728. doi: 10.1152/ajpcell.1994.267.6.C1723[↩]
- Powers SK, and Howley ET. (2012). Exercise Physiology: Theory and Application to Fitness and Performance, (8th Edition). New York, NY: McGraw Hill.[↩]
- Vanhatalo A, Poole DC, DiMenna FJ, Bailey SJ, Jones AM. Muscle fiber recruitment and the slow component of O2 uptake: constant work rate vs. all-out sprint exercise. Am J Physiol Regul Integr Comp Physiol. 2011 Mar;300(3):R700-7. doi: 10.1152/ajpregu.00761.2010[↩]
- Trappe S, Harber M, Creer A, Gallagher P, Slivka D, Minchev K, Whitsett D. Single muscle fiber adaptations with marathon training. J Appl Physiol (1985). 2006 Sep;101(3):721-7. doi: 10.1152/japplphysiol.01595.2005[↩][↩][↩]
- Hill M, Goldspink G. Expression and splicing of the insulin-like growth factor gene in rodent muscle is associated with muscle satellite (stem) cell activation following local tissue damage. J Physiol. 2003 Jun 1;549(Pt 2):409-18. doi: 10.1113/jphysiol.2002.035832[↩][↩]
- Vierck J, O’Reilly B, Hossner K, Antonio J, Byrne K, Bucci L, Dodson M. Satellite cell regulation following myotrauma caused by resistance exercise. Cell Biol Int. 2000;24(5):263-72. doi: 10.1006/cbir.2000.0499[↩][↩]
- Allen DG, Whitehead NP, Yeung EW. Mechanisms of stretch-induced muscle damage in normal and dystrophic muscle: role of ionic changes. J Physiol. 2005 Sep 15;567(Pt 3):723-35. doi: 10.1113/jphysiol.2005.091694[↩]
- Toigo M, Boutellier U. New fundamental resistance exercise determinants of molecular and cellular muscle adaptations. Eur J Appl Physiol. 2006 Aug;97(6):643-63. doi: 10.1007/s00421-006-0238-1[↩][↩]
- Sinha-Hikim I, Cornford M, Gaytan H, Lee ML, Bhasin S. Effects of testosterone supplementation on skeletal muscle fiber hypertrophy and satellite cells in community-dwelling older men. J Clin Endocrinol Metab. 2006 Aug;91(8):3024-33. doi: 10.1210/jc.2006-0357[↩]
- The Fitness Zone. https://fitness.edu.au/the-fitness-zone/muscle-hypertrophy-a-practical-guide[↩][↩][↩][↩][↩][↩]
- Pierce JR, Clark BC, Ploutz-Snyder LL, Kanaley JA. Growth hormone and muscle function responses to skeletal muscle ischemia. J Appl Physiol (1985). 2006 Dec;101(6):1588-95. doi: 10.1152/japplphysiol.00585.2006[↩]
- Rooney KJ, Herbert RD, Balnave RJ. Fatigue contributes to the strength training stimulus. Med Sci Sports Exerc. 1994 Sep;26(9):1160-4.[↩]
- Schott J, McCully K, Rutherford OM. The role of metabolites in strength training. II. Short versus long isometric contractions. Eur J Appl Physiol Occup Physiol. 1995;71(4):337-41. doi: 10.1007/BF00240414[↩]
- Smith RC, Rutherford OM. The role of metabolites in strength training. I. A comparison of eccentric and concentric contractions. Eur J Appl Physiol Occup Physiol. 1995;71(4):332-6. doi: 10.1007/BF00240413[↩]
- Suga T, Okita K, Morita N, Yokota T, Hirabayashi K, Horiuchi M, Takada S, Takahashi T, Omokawa M, Kinugawa S, Tsutsui H. Intramuscular metabolism during low-intensity resistance exercise with blood flow restriction. J Appl Physiol (1985). 2009 Apr;106(4):1119-24. doi: 10.1152/japplphysiol.90368.2008[↩]
- Tesch PA, Colliander EB, Kaiser P. Muscle metabolism during intense, heavy-resistance exercise. Eur J Appl Physiol Occup Physiol. 1986;55(4):362-6. doi: 10.1007/BF00422734[↩]
- Goldspink G. Gene expression in skeletal muscle. Biochem Soc Trans. 2002 Apr;30(2):285-90.[↩]
- Hornberger TA, Chien S. Mechanical stimuli and nutrients regulate rapamycin-sensitive signaling through distinct mechanisms in skeletal muscle. J Cell Biochem. 2006 Apr 15;97(6):1207-16. doi: 10.1002/jcb.20671[↩]
- Schoenfeld BJ, Grgic J, Van Every DW, Plotkin DL. Loading Recommendations for Muscle Strength, Hypertrophy, and Local Endurance: A Re-Examination of the Repetition Continuum. Sports (Basel). 2021 Feb 22;9(2):32. doi: 10.3390/sports9020032[↩]
- How Much Sleep Do You Really Need? https://www.thensf.org/how-many-hours-of-sleep-do-you-really-need[↩]
- Kenney, W., Wilmore, J. And Costill, D. (2015) Physiology of Sport and Exercise, 6th edition. Human Kinetics: Champaign, IL.[↩]
- Taheri S, Lin L, Austin D, Young T, Mignot E. Short sleep duration is associated with reduced leptin, elevated ghrelin, and increased body mass index. PLoS Med. 2004 Dec;1(3):e62. doi: 10.1371/journal.pmed.0010062[↩]
- Chennaoui M, Arnal PJ, Sauvet F, Léger D. Sleep and exercise: a reciprocal issue? Sleep Med Rev. 2015 Apr;20:59-72. doi: 10.1016/j.smrv.2014.06.008[↩]
- Bushman, Barbara A. Ph.D., FACSM. Exercise and Sleep. ACSM’s Health & Fitness Journal 17(5):p 5-8, September/October 2013. | DOI: 10.1249/FIT.0b013e3182a05fce[↩]
- What Are the Sleep Stages? https://www.thensf.org/what-are-the-sleep-stages/[↩][↩][↩]


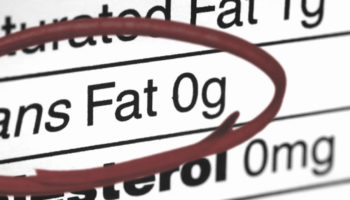