Diet, Food & Fitness

Histamine

histamine

What is histamine

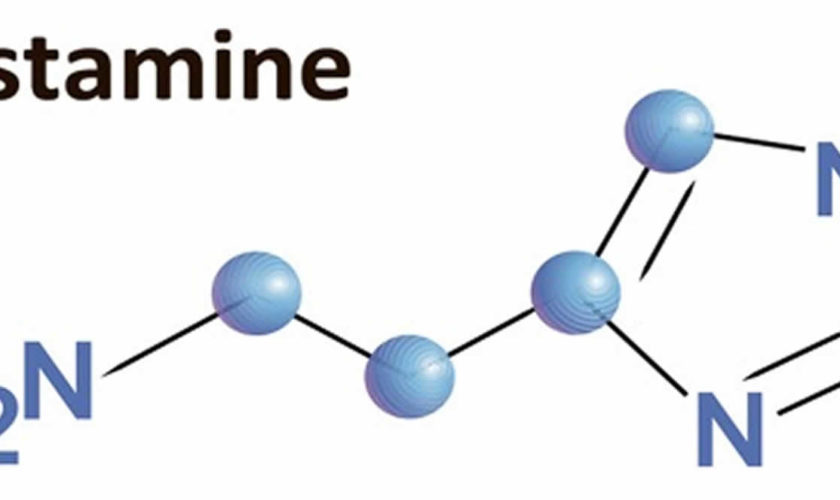
Histamine is a biogenic amine (2-[4-imidazolyl]ethylamine) and is synthesized by the pyridoxal phosphate (vitamin B-6)–containing L-histidine decarboxylase from the amino acid histidine 1). Histamine is synthesized by mast cells, basophils, platelets, histaminergic neurons, and enterochromaffine cells, where it is stored intracellularly in vesicles and released on stimulation 2). Histamine is a potent mediator of numerous biologic reactions. Besides the well-known triggering of degranulation of mast cells by crosslinking of the FcεRI receptor by specific allergens, several other nonimmunologic stimuli, such as neuropeptides, complement factors (i.e, C3a and C5a), cytokines, hyperosmolarity, lipoproteins, adenosine, superoxidases 3), hypoxia, chemical and physical factors (e.g, extreme temperatures, traumas) 4), or alcohol and certain food and drugs, may activate mast cells.

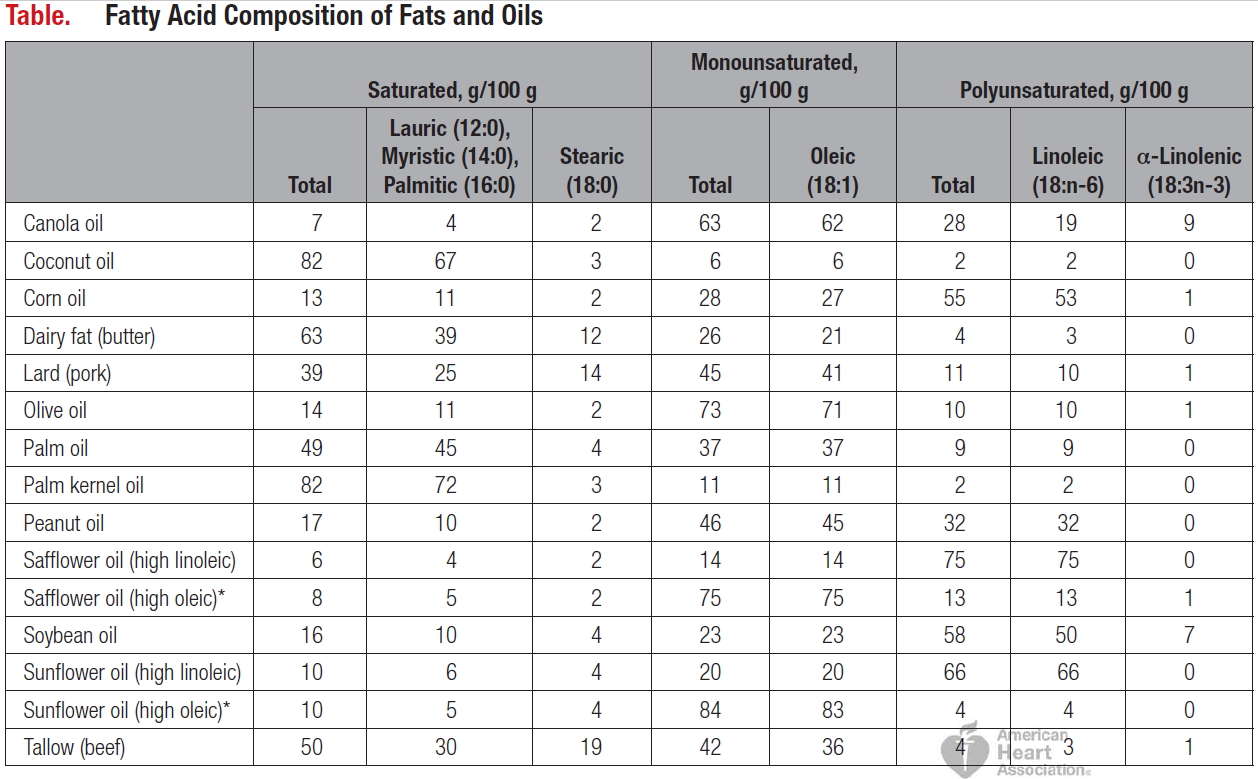
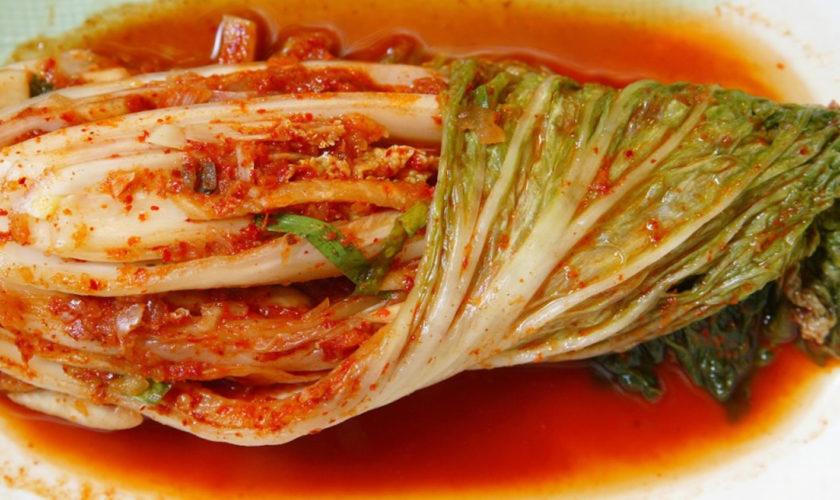
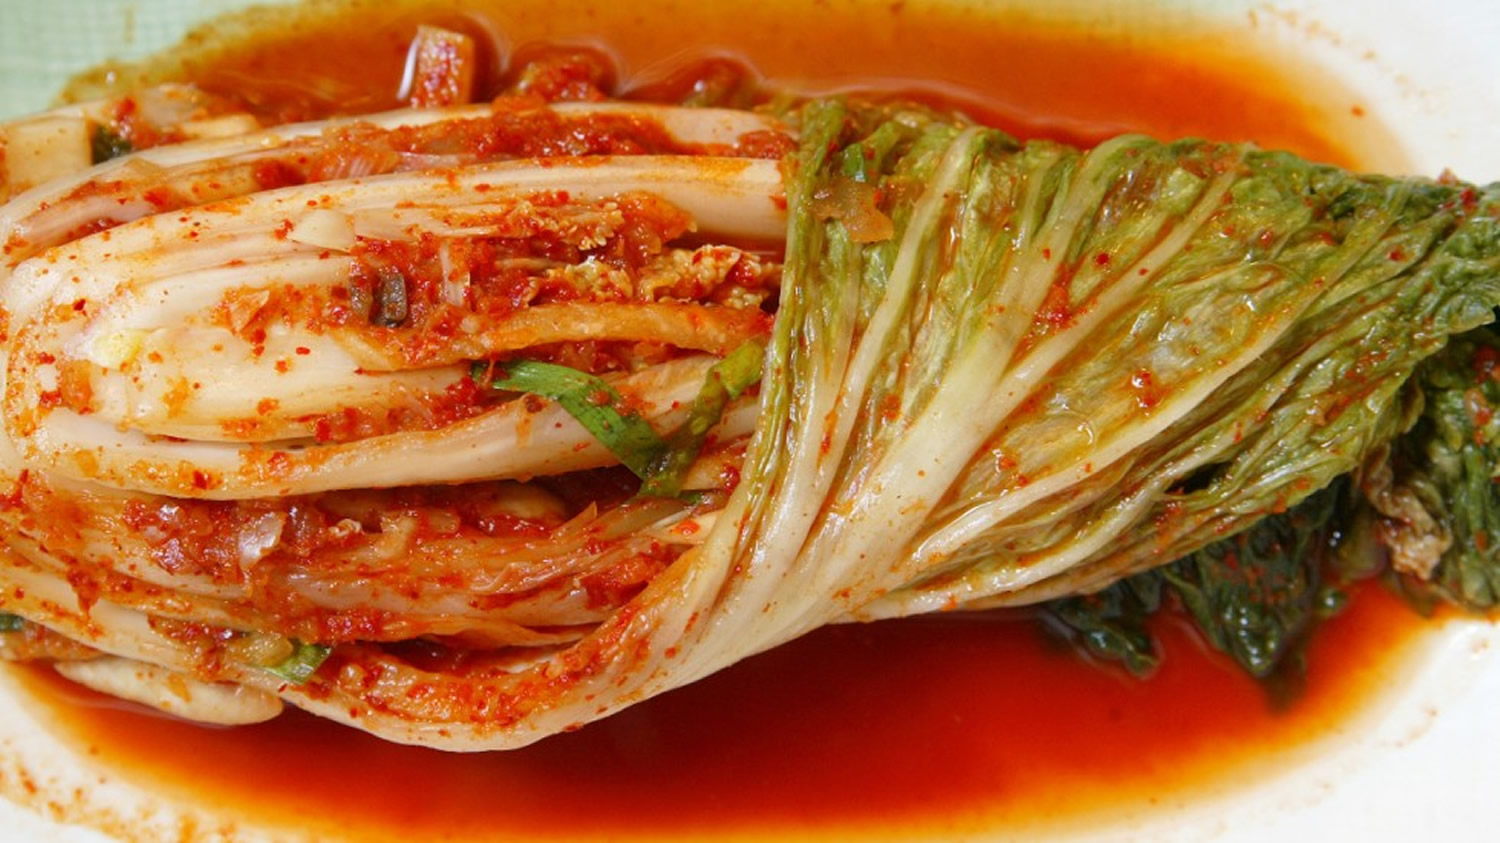
Due to microbial contamination, food and beverages sometimes contain varying amounts of histamine in relevant amounts. Therefore, spoiled or fermented foods can contain high levels of histamine. In particular, food that undergoes microbial ripening, such as cheese, salami, sauerkraut, or red wine, can contain high levels of histamine (see Tables 3 and 4 below) 5). Histamine intolerance belongs to the group of non-IgE-mediated hypersensitivity-like reactions, and is known as a pharmacological food intolerance. Currently, no valid in vitro tests can prove histamine intolerance; thus, a double-blind, placebo-controlled food challenge test remains the gold standard for diagnostic workup of non-IgE-mediated food intolerance 6).

Histamine producing cells and stimuli that trigger histamine release

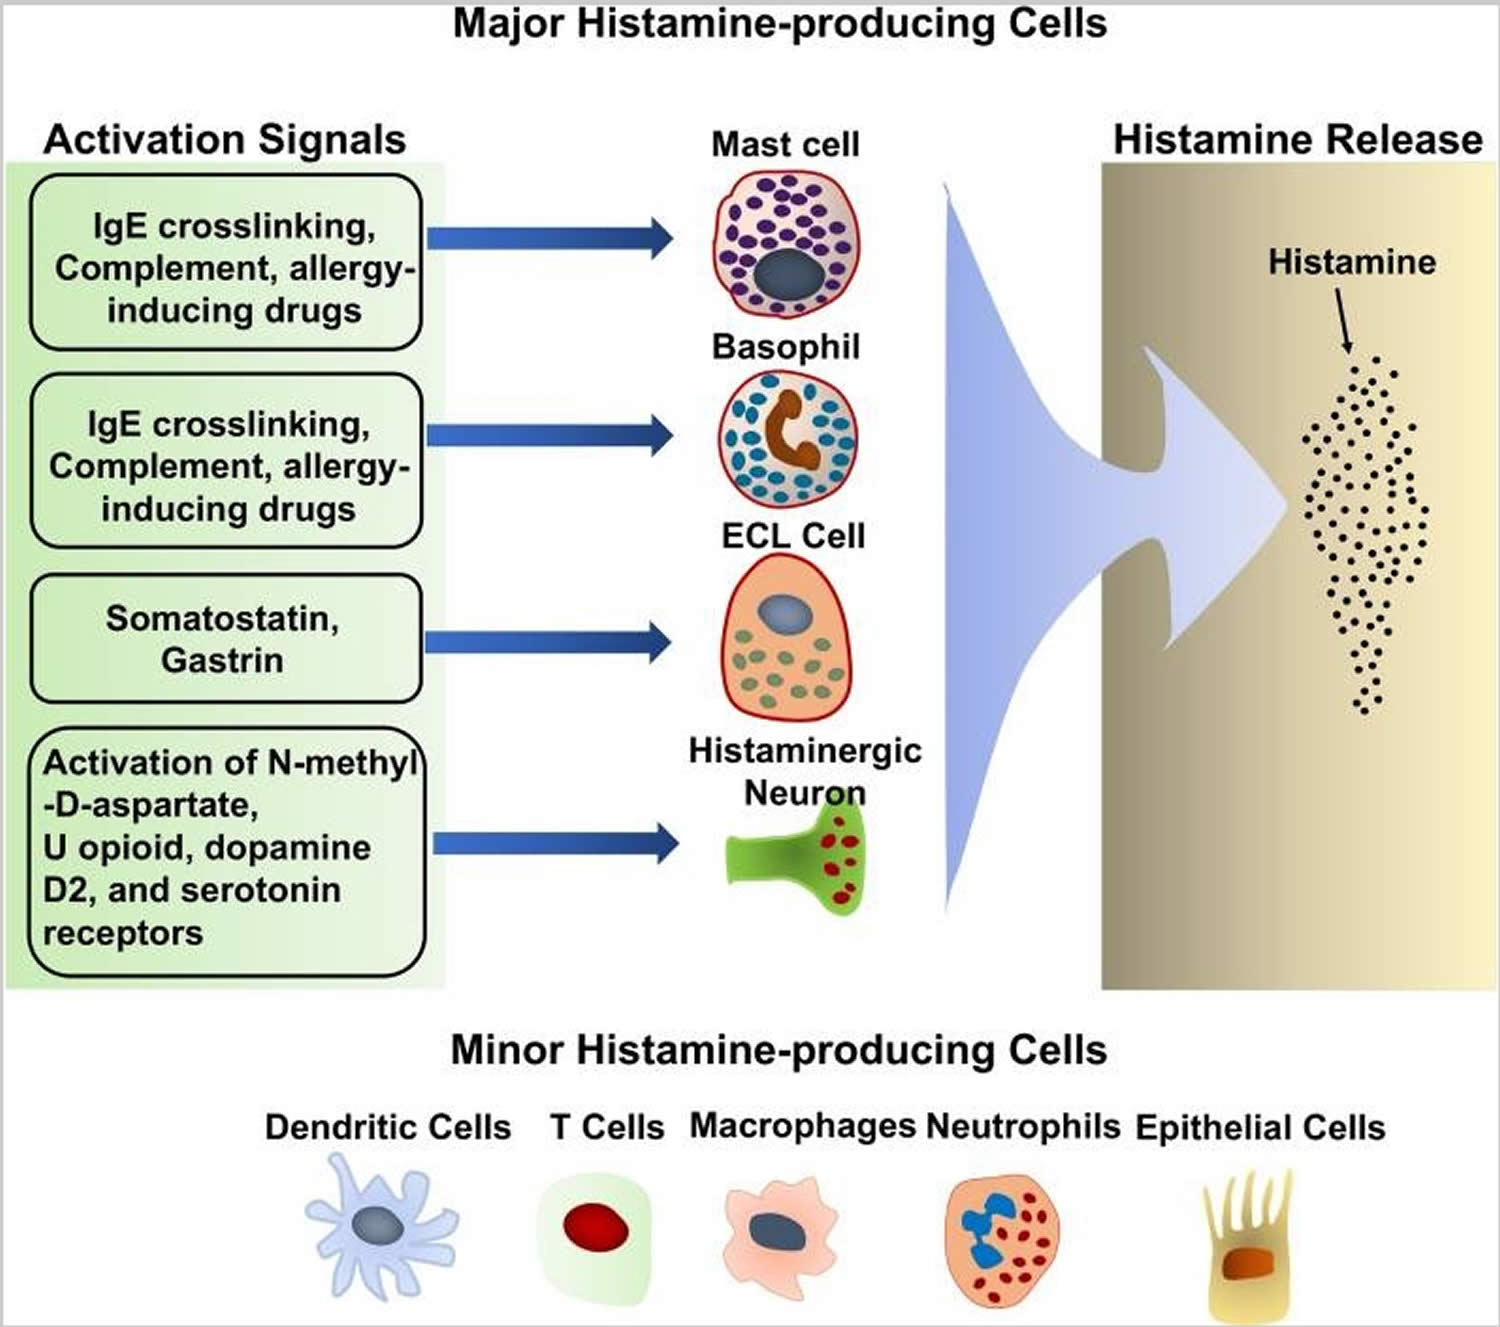
Histamine is synthesized primarily by mast cells, basophils, histaminergic neurons in the basal ganglia of the brain and enterochromaffin-like cells in the stomach 7). These cells produce large amounts of histamine and are thought to be the major histamine-producing cells (Figure ​1). They continuously synthesize histamine, which is then linked to the carboxyl group of heparin and stored in intracellular granules until the cells receive the appropriate activating stimulus. Upon external stimulation, these cells degranulate, releasing the stored histamine. Stimuli that trigger histamine release by these major histamine-producing cells have been reviewed extensively 8). Antigen crosslinking of antigen-specific IgE bound to the high-affinity IgE receptor, FcεRI, on the mast cell and basophil surface is the most robust stimulus that triggers histamine release by these cells 9). Substance P and allergy-inducing drugs that bind to G-protein-coupled receptors can also trigger basophils and mast cells to release histamine via different signaling pathway 10). In addition, complement components, such as the C3a and C5a “anaphylatoxins,” have also been shown to induce histamine release by mast cells 11). Many cytokines, including IL-3, IL-18, IL-33, GM-CSF, and SCF, promote histamine synthesis 12). In general, cytokines alone do not induce histamine release although it remains controversial whether IL-33 can have this effect. Some reports describe that IL-33 stimulates histamine release 13), while other reports dispute this 14). It is suggested that IL-33 alone does not induce histamine release by basophils, but enhances histamine release in response to IgE/FcεRI crosslinking 15).

Additional histamine-producing cells have also been identified, including T cells 16), dendritic cells 17), macrophages 18), and epithelial cells 19) (Figure ​1). In contrast to mast cells and basophils, these cells produce relative small quantities of histamine and do not store it in their cytoplasm 20). The small amounts of histamine that they produced are released without external stimulation 21). The biological significance of the small amounts of histamine produced by these minor histamine-producing cells remains unclear. Cell type-specific deletion of the Hdc gene, which encodes HDC (histidine decarboxylase), an enzyme essential for histamine synthesis, would shed light on the role of histamine synthesis and secretion by the minor histamine-producing cells.

Figure 1. Histamine-producing cells and stimuli that trigger histamine release

Histamine-producing cells

[Source 22)]

What does histamine do?

Histamine exerts its effects by binding to its 4 receptors [histamine 1 receptor (H1R), H2R, H3R, and and H4R] on target cells in various tissues (see Figure 2 and Table 1). Histamine causes smooth muscle cell contraction, vasodilatation (blood vessels to dilate), increased vascular permeability and mucus secretion, tachycardia (increase heart rate), alterations of blood pressure, and arrhythmias (abnormal heart rates or rhythms), and histamine stimulates gastric acid secretion and nociceptive nerve fibers. In addition, histamine has been known to play various roles in neurotransmission, immunomodulation, hematopoiesis (red blood cell formation), wound healing, day-night rhythm, and the regulation of histamine- and polyamine-induced cell proliferation and angiogenesis in tumor models 23) and intestinal ischemia 24).

Figure 2. Histamine effects

Histamine effects

[Source 25)]

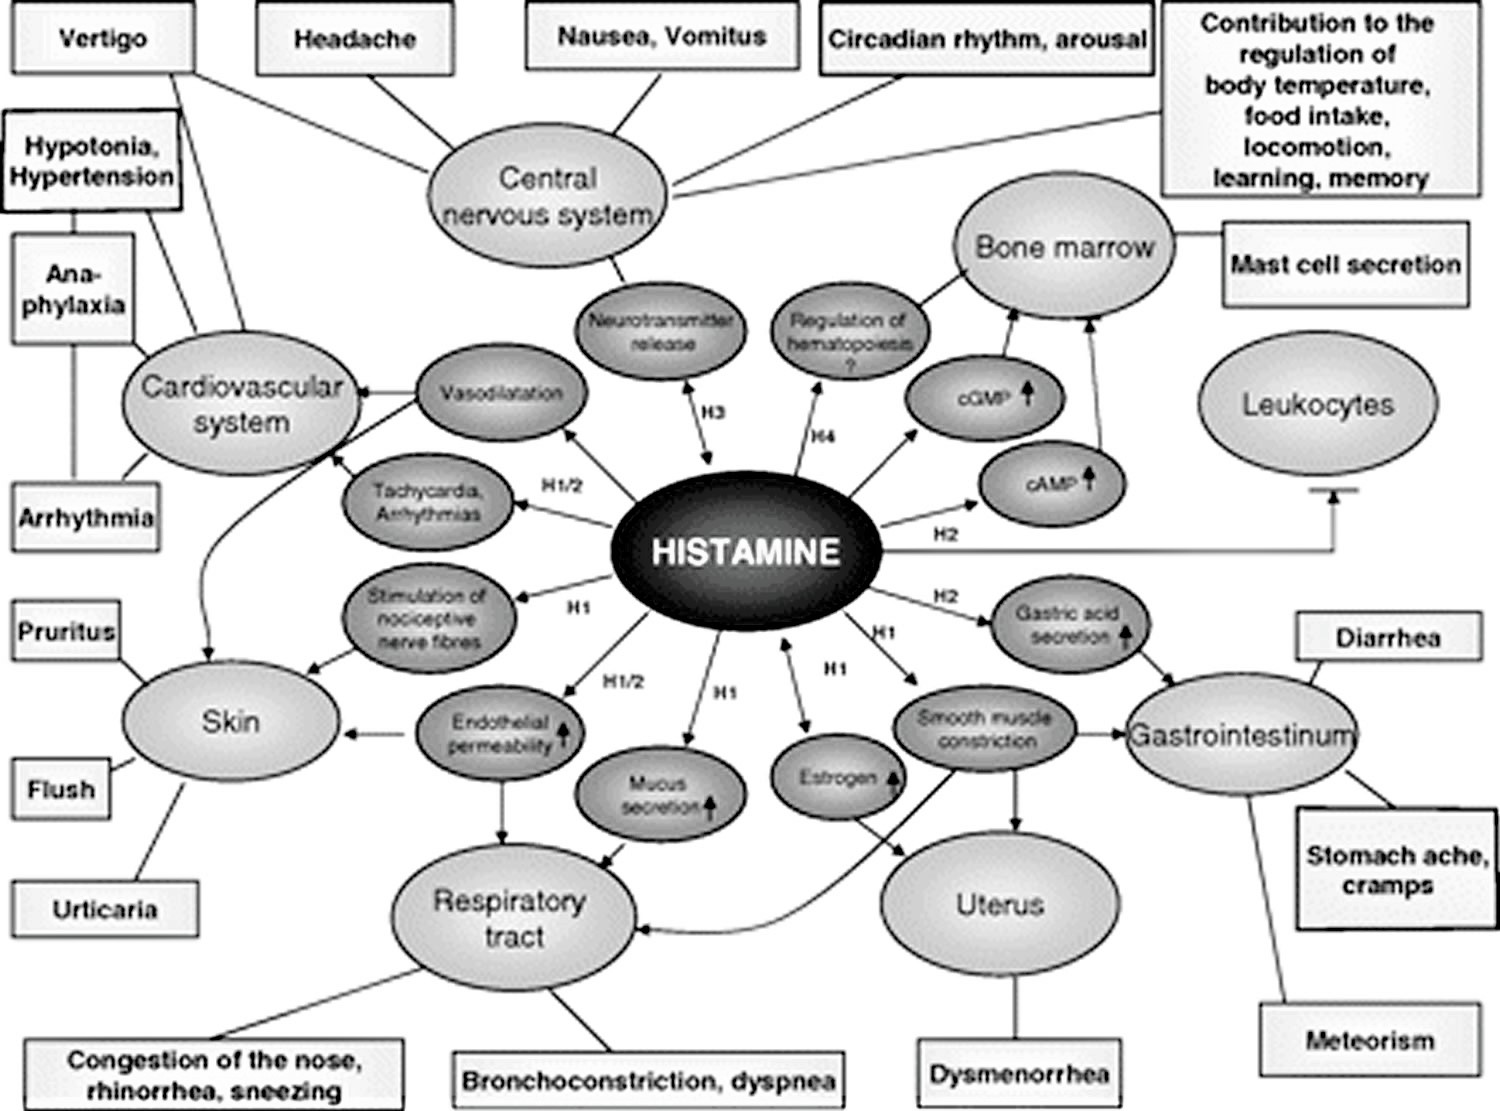
Table 1. Histamine effects according to plasma histamine concentration (ng/mL or nanogram per mililiter)

HistamineClinical effect
0–1Reference
1–2↑ Gastric acid secretion ↑ Heart rate
3–5Tachycardia, headache, flush, urticaria, pruritus
6–8↓ Arterial pressure
7–12Bronchospasm
≈100Cardiac arrest
[Source 26)]

Histamine metabolism

Histamine can be metabolized in 2 ways (Figure 2 and Table 2):

  1. By oxidative deamination by diamine oxidase (DAO) (former name: histaminase) or
  2. By ring methylation by histamine-N-methyltransferase 27).

Whether histamine is catabolized by diamine oxidase (DAO) or histamine-N-methyltransferase is supposed to depend on the localization of histamine. The diamine oxidase (DAO) protein is stored in plasma membrane–associated vesicular structures in epithelial cells and is secreted into the circulation on stimulation 28). Therefore, it has been proposed that diamine oxidase (DAO) may be responsible for scavenging extracellular histamine (e.g, after ingestion of histamine-rich food) after mediator release. Conversely, histamine-N-methyltransferase, the second most important enzyme inactivating histamine, is a cytosolic protein 29), which can convert histamine only in the intracellular space of cells 30). Thus, the enzymes do not seem to compete for the substrate, although they have a similar affinity for histamine and they are expressed in some overlapping tissues. Histamine-N-methyltransferase has a slightly higher affinity for histamine [Michaelis-Menten constant (kM): 6–13 μmol/L] than does diamine oxidase (DAO) (kM: 20 μmol/L). In mammals, diamine oxidase (DAO) expression is restricted to specific tissues; the highest activities are shown for small bowel and colon 31) and for placenta and kidney 32). Lower diamine oxidase (DAO) activity has been discussed as a potential indicator of intestinal mucosa damage in inflammatory and neoplastic diseases 33) and in persons undergoing chemotherapy 34). Histamine-N-methyltransferase is widely expressed in human tissues; the greatest expression is in kidney and liver, followed by spleen, colon, prostate, ovary, spinal cord cells, bronchi, and trachea35). Histamine-N-methyltransferase is regarded as the key enzyme for histamine degradation in the bronchial epithelium 36).

Figure 2. Histamine metabolism

Histamine metabolism

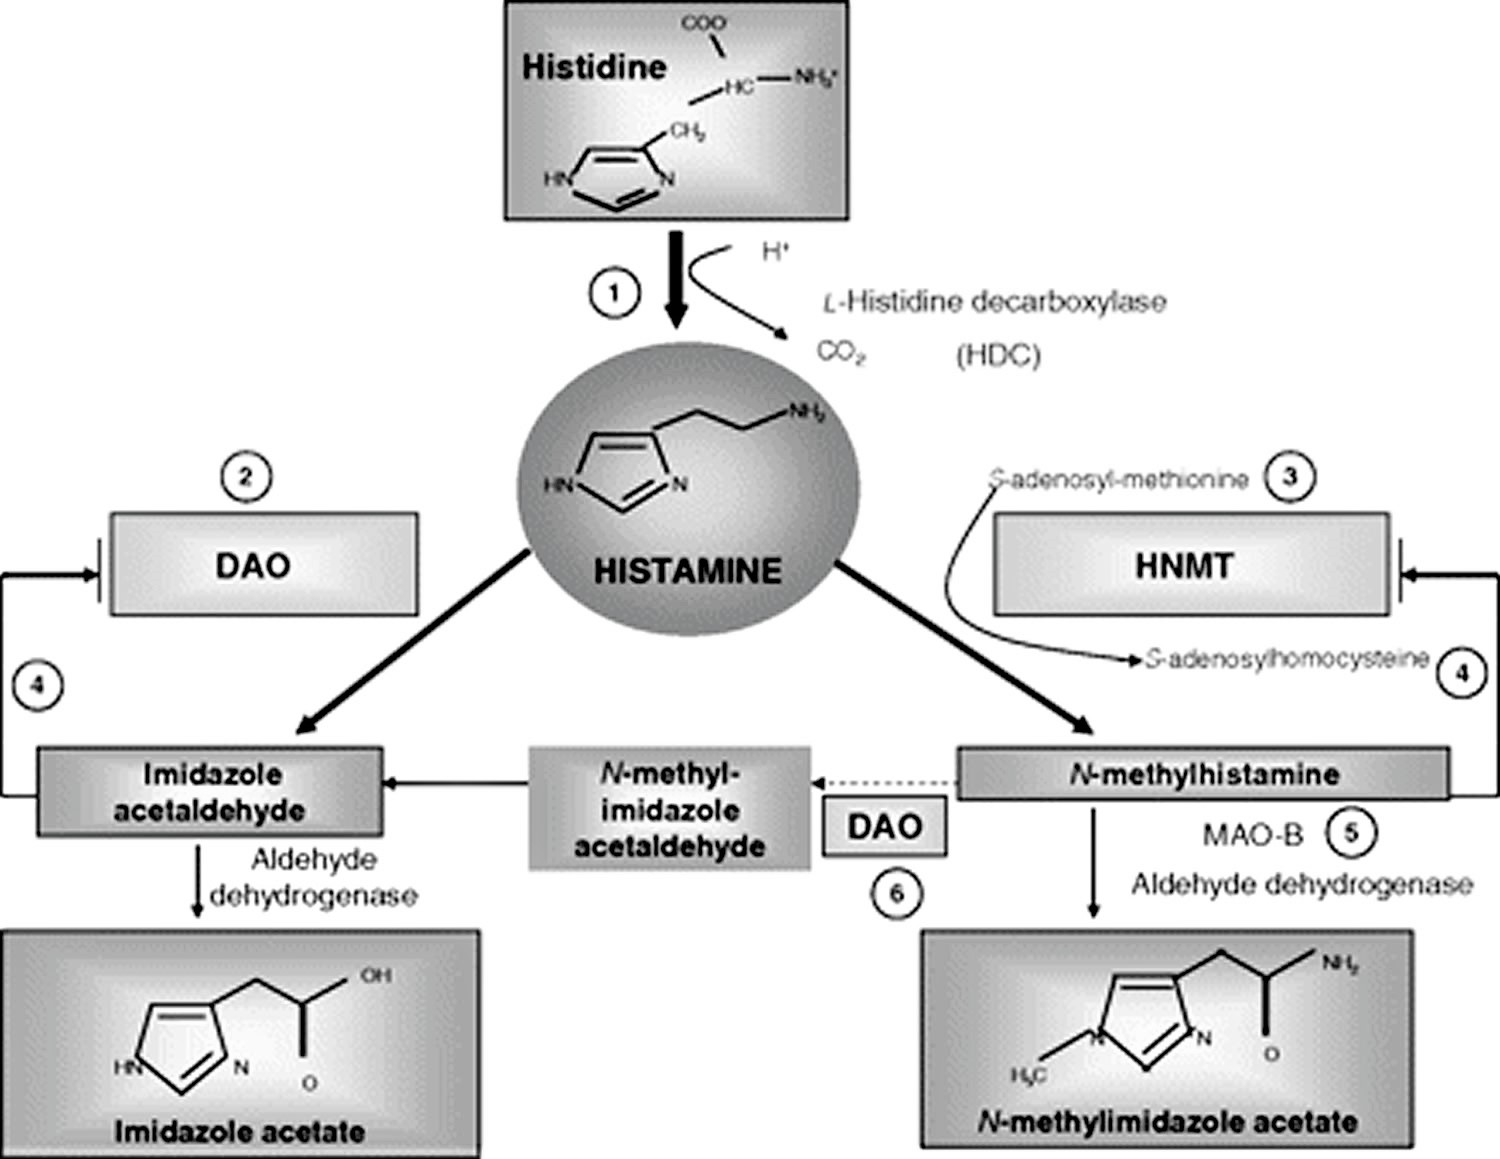
Footnotes: Summary of the histamine metabolism. The biogenic amine histamine is synthesized by decarboxylation of the amino acid histidine catalyzed by l-histidine decarboxylase (HDC) (1). Histamine can be metabolized by extracellular oxidative deamination of the primary amino group by diamine oxidase (DAO) (2) or intracellular methylation of the imidazole ring by histamine-N-methyltransferase (HNMT) (3). Therefore, insufficient enzyme activity caused by enzyme deficiency or inhibition may lead to accumulation of histamine. Both enzymes can be inhibited by their respective reaction products in a negative feedbackloop (4). N-Methylhistamine is oxidatively deaminated to N-methyl-imidazole acetaldehyde by monoamine oxidase B (MAO B) (5) or by DAO (6). Because the methylation pathway takes place in the cytosolic compartment of cells, MAO B (5) has been suggested to catalyze this reaction in vivo 37).

[Source 38)]

Table 2. Characteristics of the histamine-degrading enzymes diamine oxidase (DAO) and histamine N-methyl-transferase (HNMT)

DAOHNMT
Gene
    Gene map locusChromosome 7q35Chromosome 2q22
    Gene10 kbp, 5 exons, 4 introns35 kbp, 6 exons
    Associated with SNPsInflammatory and neoplastic gastrointestinal diseases such as food allergy, gluten-sensitive enteropathy, Crohn disease, ulcerative colitis, and colon adenomaAsthma
ProteinSoluble homodimeric glycoprotein of MR 200 000 with subunits of 70–125 kDa; 750 amino acid residuesSoluble, cytosolic protein of MR 33 000 with subunits of 29–34 kDa; 292 amino acid residues
Enzyme
    GroupCopper-containing amine oxidasesMethyltransferases
    Active formHomodimer with the active-site cofactor 2,4,5-trihydroxyphenylalanine quinone (Topa quinone)Monomer with a 2-domain structure
    Enzyme kinetics (km)Histamine, 20 μmol/LHistamine, 6–13 μmol/L
Putrescine, 350 μmol/LS-adenosyl-l-methionine, 6–10 μmmol/L
Spermidine, 3 mmol/L
    Optimum pH7.27.5–9.0
    InhibititorsCopper-chelating agents, eg cyanide Carbonylgroup reagents, eg, aminoguanidine, semibarbacideReaction products: N-methylhistamine, S-adenosyl-l-homocysteine
Sulphydryl groups: p-chloromercuriobenzoate
    Major expressionIntestine, kidney, placentaHighest: kidney and liver; considerable: spleen, colon, prostate, ovary, spinal cord cells, trachea, and bronchi; to a smaller amount, nearly ubiquitous expression
    StoragePlasma membrane–associated vesicular structures in epithelial cells, secretion into the circulation upon stimulationCytosolic compartment of the cells
    FunctionExtracellular scavenger of histamine and other diamines by oxidative deamination of the primary amino group of histamineIntracellular histamine inactivation by methylation of the imidazole ring

Abbreviations:

SNPs = single-nucleotide polymorphisms; kbp = kilobase pair; MR = molecular weight; kDa = kiloDalton; kM = Michaelis-Menten constant.

[Source 39)]

Histamine and atopic eczema

Higher basal plasma histamine concentrations 40) and increased spontaneous histamine release toward different stimuli 41) and after food challenges 42) have been shown in patients with severe atopic eczema than in control subjects. In addition, reduced diamine oxidase (DAO) activities have been shown in a subgroup of atopic eczema patients 43). Thus, these patients have a significantly greater occurrence of chronic headache, dysmenorrhea, flushing, gastrointestinal symptoms, and intolerance to alcohol and food than do control subjects. Reduction of both the symptoms of histamine intolerance and the severity score of atopic dermatitis has been shown in a subgroup of patients with atopic eczema and low diamine oxidase (DAO) serum activity who were following a histamine-free diet for 2 week 44). Orally ingested histamine has been shown to aggravate eczema in atopic eczema patients in a double-blind, placebo-controlled provocation 45). A feedback inhibition of diamine oxidase (DAO) through its degradation product imidazole acetic acid 46) or substrate inhibition 47) caused by the elevated histamine concentrations in atopic eczema may be a pathomechanism of a reduced histamine degradation capacity in a subgroup of patients with atopic eczema.

Histamine and sexual steroids

In the female genital tract, histamine is mainly produced by mast cells, endothelial cells, and epithelial cells in the uterus and ovaries. Histamine-intolerant women often suffer from headache that is dependent on their menstrual cycle and from dysmenorrhea. Besides the conctractile action of histamine, these symptoms may be explained by the interplay of histamine and hormones. Histamine has been shown to stimulate, in a dose-dependent manner, the synthesis of estradiol via H1R (histamine 1 receptor); meanwhile, only a moderate effect on progesterone synthesis was observed 48). The painful uterine contractions of primary dysmenorrhea are mainly caused by an increased mucosal production of prostaglandin F2α stimulated by estradiol and attenuated by progesterone. Thus, histamine may augment dysmenorrhea by increasing estrogen concentrations. And, in reverse, estrogen can influence histamine action. A significant increase in weal and flare size in response to histamine has been observed to correspond to ovulation and peak estrogen concentrations 49). In pregnancy, diamine oxidase (DAO) is produced at very high concentrations by the placenta 50), and its concentration may become 500 times that when the woman is not pregnant 51). This increased diamine oxidase (DAO) production in pregnant women may be the reason why, in women with food intolerance, remissions frequently occur during pregnancy 52).

Histamine and drugs

The effect of drugs as specific diamine oxidase (DAO) inhibitors and their capacity to induce histamine intolerance have been shown in various studies with human placental diamine oxidase (DAO) and in animal experiments53). A clinically relevant activity via histamine release or inhibition of DAO has been observed for various drugs 54). Therefore, the intake of drugs, especially long-term medication, should be considered in interpretation of histamine intolerance symptoms and diamine oxidase (DAO) concentrations.

Drugs releasing histamine or inhibiting diamine oxidase (DAO)

Substance classAgent interfering with the histamine metabolism
Contrast media
Muscle relaxantsPancuronium, alcuronium, d-tubocurarine
NarcoticsThiopental
AnalgeticsMorphine, pethidine, nonsteroidal antiinflammatory drugs, acetylsalicylic acid, metamizole
Local anestheticsPrilocaine
AntihypotonicsDobutamine
Antihypertensive drugsVerapamil, alprenolol, dihydralazine
AntiarrhythmicsPropafenone
DiureticsAmiloride
Drugs influencing gut motilityMetoclopramide
AntibioticsCefuroxime, cefotiam, isoniazid, pentamidin, clavulanic acid, choroquine
MucolyticsAcetylcysteine, ambroxol
BroncholyticsAminophylline
H2-receptor antagonistsCimetidine
CytostaticsCyclophosphamide
AntidepressantsAmitriptyline
[Source 55)]

Histamine diet

Histamine and other biogenic amines are present to various degrees in many foods, and their presence increases with maturation 56). The formation of biogenic amines in food requires the availability of free amino acids, the presence of decarboxylase-positive microorganisms, and conditions allowing bacterial growth and decarboxylase activity. Free amino acids either occur as such in foods or may be liberated by proteolysis during processing or storage 57). Numerous bacteria and some yeasts display high L-histidine decarboxylase activity and thus have the capacity to form histamine. Histidine is generated from autolytic or bacterial processes 58). Therefore, high concentrations of histamine are found mainly in products of microbial fermentation, such as aged cheese 59), sauerkraut, wine 60), and processed meat 61) (see Tables 3 and 4 below) or in microbially spoiled food. Thus, histamine, tyramine, putrescine, and cadaverine serve as indicators of hygienic food quality 62). Tyramine and putrescine also may lead to intolerance reactions in combination with histamine. Possible explanations may be the inhibition of diamine oxidase (DAO) by other amines 63) or the promotion of histamine liberation from the mucosa by putrescine 64).

Intolerance of tyramine that has vasoconstrictive properties that lead to hypertensive crisis and headache has been known mostly in patients taking monoamine oxidase (MAO)–inhibiting drugs. Orally administered tyramine in doses of 200 to 800 mg has been shown to increase systolic blood pressure by 30 mm Hg in otherwise unmedicated subjects. Conversely, in patients taking MAO-inhibiting drugs, the pressor sensitivity was 7- to 56-fold that in patients not taking MAO-inhibiting drugs 65). Eight double-blind, placebo-controlled studies have investigated the effect of tyramine on migraine. Two studies showed positive results in migraine patients who were sensitive to foods that are high in tyramine (n = 45) (19) or who had wine-provoked migraine (n = 19) 66); 6 studies showed negative results with 97 67) patients. The 2 positive studies and 2 of the negative studies were regarded as inconclusive 68) because of a lack of randomization 69), questionable blinding 70), or inappropriate selection of migraine patients without a history of suspected tyramine intolerance 71). Conversely, in 2 conclusive studies of migraine patients with a positive or negative dietary history, 125 mg oral tyramine did not precipitate more headaches than did placebo.

Histamine foods

Alcohol, especially red wine, is rich in histamine and is a potent inhibitor of diamine oxidase (DAO) 72). The relation between the ingestion of wine, an increase in plasma histamine, and the occurrence of sneezing, flushing, headache, asthma attacks, and other anaphylactoid reactions and a reduction of symptoms by antihistamines has been shown in various studies 73). However, among the multitude of substances contained in wine, other biogenic amines such as tyramine 74) and sulfites 75) have been supposed to contribute to symptoms summarized as “wine intolerance” or “red wine asthma” 76). In double-blind, placebo-controlled wine tests with healthy persons 77) and in patients with chronic urticaria and wine intolerance 78), the histamine content did not influence wine tolerance. In the latter group, an increase in plasma histamine could be shown, paradoxically, after ingestion of the histamine-poor wine. In these patients, the ethanol metabolite acetaldehyde has been discussed as a histamine-releasing substance 79). However, the high percentage of responses to the placebo (87%) could be responsible for the absence of an effect in this study 80). Another randomized double-blind, placebo-controlled oral wine challenge in patients with a history of red wine–provoked asthma (n = 18) found no relation between wine tolerance and the wine’s content of histamine or other amines but did find a greater bronchoconstrictive response to wine with a high sulfite content 81). Sulfiting agents are widely used as antioxidants and preservatives in foods, beverages, and pharmaceuticals. Adverse reactions with a presumed relation to sulfites include anaphylactic shock, bronchospasm, urticaria, angioedema, nausea, abdominal pain, diarrhea, stroke, and death 82). Sulfite hypersensitivity has been reported mainly in patients with chronic asthma; the estimated prevalence is 5–10% in all patients 83). Asthmatic reactions have been attributed to reflex activation of the parasympathetic system by the irritating effect of sulfites, possibly enhanced by a deficiency of sulfite oxidase. Besides this pseudoallergic mechanism, in at least some cases of sulfite hypersensitity, an immunoglobulin E (IgE)–mediated immediate-type allergic reaction must be considered 84). Sulfites may be contained in wine, but they are also contained in foods that are poor in histamine, such as fruit juice, frozen vegetables, and lettuce. Thus, in patients reporting intolerance to wine, a careful history of reactions to other foods rich in histamine or sulfites should be taken. In patients who are suspected of having sulfite intolerance, skin testing and a double-blind, placebo-controlled challenge with capsules containing increasing doses of bisulfite or placebo should be performed.

In contrast to an IgE–mediated food allergy, in which the ingestion of even a small amount of the allergen elicits symptoms, in histamine intolerance, the cumulative amount of histamine is crucial. Besides variations in the amount of histamine in food according to storage and maturation, the quantity consumed, the presence of other biogenic amines, and the additional intake of alcohol or diamine oxidase (DAO)-blocking drugs are pivotal factors in the tolerance of the ingested food. Generally, an upper limit of 100 mg histamine/kg in foods and of 2 mg histamine/L in alcoholic beverages has been suggested 85). This threshold may be too high, considering the occurrence of histamine-mediated symptoms after oral ingestion of 75 mg histamine in 5 of 10 females without a history of histamine intolerance 86).

However, most of the positive studies for intolerant reactions to sulfite, histamine, and other biogenic amines do not fulfill the current scientific criteria for providing substantiated evidence of the clinical effect of these foods. Nevertheless, patients who have a conclusive history of adverse reactions to food, alcohol, drugs containing histamine, other biogenic amines, and sulfite but without proof of IgE exist. In such patients, a double-blind, placebo-controlled provocation of the suspected causal agents under close supervision by experienced specialists should be performed after exclusion of other causal diseases and informed consent of the patients—if the provocation is not unreasonably hazardous, considering the grade of the anaphylactoid reaction. Because of the great effort, time, and costs or because of patients’ fear of a repeated reaction, double-blind, placebo-controlled provocations often are not performed in clinical practice, even when they are indicated.

Table 3. High histamine foods

Food categoriesHistamineRecommended upper limit for histamineTyramine
mg/kgmg/Lmg/kgmg/Lmg/kgmg/L
Fish (frozen/smoked or salted/canned)200ND
    Mackerel1–20/1–1788/ND–210
    Herring1–4/5–121/1–479
    SardineND/14–150/3–2000
    TunaND/ND/1–402
CheeseNo recommendation
    Gouda10–90010–900
    Camembert0–10000–4000
    Cheddar0–21000–1500
    Emmental5–25000–700
    Swiss4–25000–700
    Parmesan10–5810–840
MeatNo recommendation
    Fermented sausageND–650ND–1237
    Salami1–654
    Fermented ham38–271123–618
Vegetables
    Sauerkraut0–229102–951
    Spinach30–60
    Eggplant26
    Tomato ketchup22
Red wine vinegar4
Alcohol
    White wineND–1021–8
    Red wineND–302ND–25
    Top-fermented beerND–141.1–36.4
    Bottom-fermented beerND–170.5–46.8
    Champagne670

Abbreviation: ND = not detected

[Source 87)]

Table 4. Histamine food list

Histamine food list

[Source 88)]

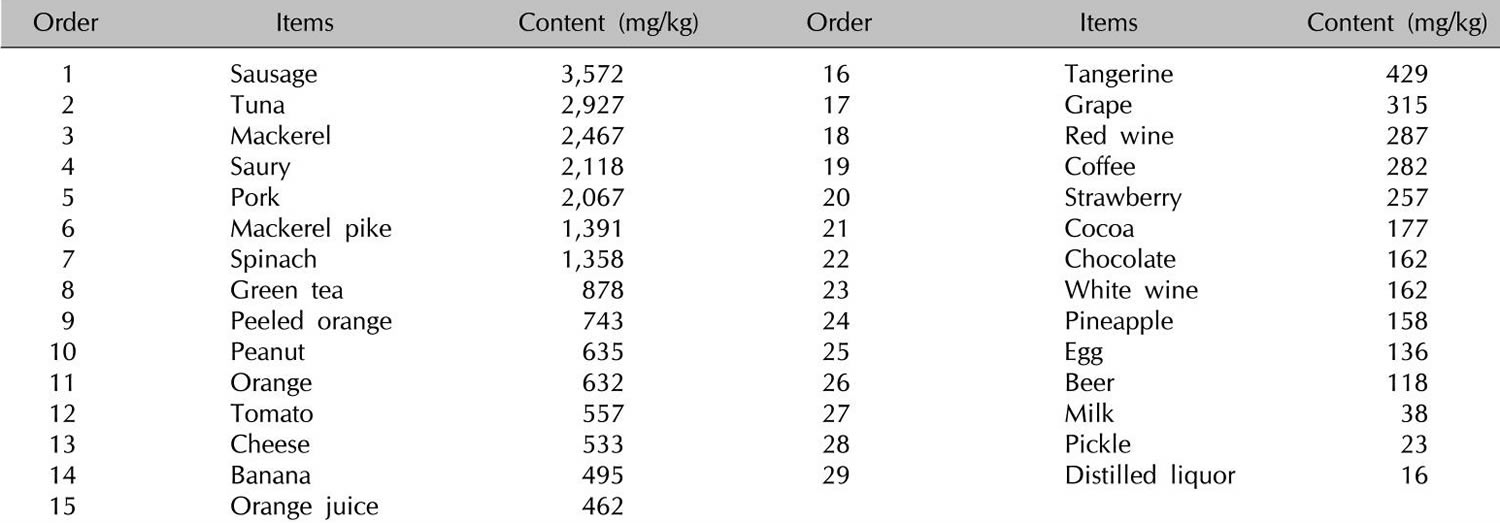
In addition to histamine-rich food, many foods such as citrus foods are considered to have the capacity to release histamine directly from tissue mast cells, even if they themselves contain only small amounts of histamine (Table 5). In vitro studies of persons with a history of pseudoallergic reactions to food have shown a fragility of duodenal mast cells with massive degranulation in the presence of histamine-releasing substances that is significantly greater than that shown by control subjects 89). However, clinical studies using oral challenge tests to support the hypothesis for the histamine-releasing capacity of foods are required 90).

Table 5. Foods with suggested histamine-releasing capacities

Plant-derivedAnimal-derivedOther
Citrus fruitFishAdditives
PapayaCrustaceansLiquorice
StrawberriesPorkSpices
PineappleEgg white
Nuts
Peanuts
Tomatoes
Spinach
Chocolate
[Source 91)]

References   [ + ]

read more

Sesame oil

sesame oil

What is sesame oil

Sesame oil is an edible vegetable oil derived from sesame seeds (Sesamum indicum). Sesame oil is used in salad and cooking oils, shortening and some margarines. Sesame oil is a key flavor ingredient in some Chinese dishes. Sesame oil keeps well and resists rancidity, due to the presence of a natural antioxidant, sesamol. Commercially, sesame oil comes in two types. One type of sesame oil is a pale yellow liquid and has a pleasant grain-like odor and somewhat nutty taste 1). Sesame oil is high in polyunsaturated fats (PUFAs), ranking fourth behind safflower, soybean and corn oil. Sesame oil is excellent for use as frying oil, in cosmetics and in food preparations. The other type of sesame oil is amber-colored and aromatic, made from pressed and toasted sesame seeds 2). This popular ingredient in ethnic cooking is not used as a cooking oil, however, because the flavor is too intense and it burns quite easily. Instead, amber-colored sesame oil is normally added as a flavoring agent in the final stages of cooking.

Oil is extracted from sesame seeds by mechanical pressing. The sesame seed may be cold pressed to give an aromatic salad oil or hot pressed to give a lower grade product. The sesame oil yield is from 50 percent to 57 percent, depending on growing conditions and seed variety.

The outstanding characteristic of sesame oil is its long shelf life due to its natural antioxidant, sesamol. This quality makes sesame oil applicable for use in the manufacture of margarine in many parts of the world where there is inadequate refrigeration. Sesame oil is also used in paints, soaps, cosmetics, perfumes, bath oils, insecticides and pharmaceuticals (vehicle for drug delivery). Poppy seed, cotton seed and rape oils are frequently added to sesame oil.

Sesame oil is rich in both MUFA (monounsaturated fatty acid) and PUFA (polyunsaturated fatty acid). Many clinical and animal studies have identified that sesame oil contains lignans 3) and is able to reduce oxidative stress and inflammation 4). Recently, scientists revealed a close relationship of inflammation with oxidative stress 5), as well as the effects of sesame oil feeding on inflammation and atherosclerosis in vivo 6).

Sesame oil allergy

As with numerous seed and nut foods, sesame oil may produce an allergic reaction, although the incidence of this effect is rare at approximately 0.1% of the population 7), 8). Reports of sesame allergy are growing in developed countries during the 21st century, with the allergic mechanism from sesame oil exposure expressed as contact dermatitis, possibly resulting from hypersensitivity to lignin-like compounds 9).

Symptoms of an allergic or allergic-type reaction

When someone comes in contact with a food allergen or added sulphites, the symptoms of an allergic or allergic-type reaction may develop quickly and rapidly progress from mild to severe. The most severe form of an allergic reaction is called anaphylaxis. Symptoms can include breathing difficulties, a drop in blood pressure or shock, which may result in loss of consciousness and even death. A person experiencing an allergic reaction may have any combination of the following signs or symptoms:

  • Skin: hives, swelling (face, lips, tongue), itching, warmth, redness;
  • Respiratory: coughing, wheezing, shortness of breath, chest pain or tightness, throat tightness, hoarse voice, nasal congestion or hay fever-like symptoms (runny, itchy nose and watery eyes, sneezing), trouble swallowing;
  • Gastrointestinal: nausea, pain or cramps, vomiting, diarrhea;
  • Cardiovascular: paler than normal skin colour/blue skin colour, weak pulse, dizziness or light headedness, loss of consciousness, shock;
  • Other: anxiety, sense of impending doom, headache, uterine cramps, metallic taste.

I have a sesame seed allergy. How can I avoid a sesame seed-related reaction?

  • Read food labels.

Other names for sesame seeds

In the past, some products have used other names for sesame on their labels. These names are not permitted without the word sesame also appearing on the label, based on the enhanced labelling requirements for food allergens, gluten sources and added sulphites. However, if you have a sesame allergy and see one of the following in the list of ingredients on a product you should not eat it.

  • Benne, benne seed and benniseed
  • Gingelly and gingelly oil
  • Seeds
  • Sesamol and sesamolina
  • Sesamum indicum
  • Sim sim
  • Til
  • Tahini (sesame paste)

Examples of foods and products that contain or often contain sesame seeds:

  • Bread (e.g., hamburger buns, multi-grains), bread crumbs and sticks, cereals, crackers, melba toast and muesli
  • Dips and spreads, e.g., hummus, chutney
  • Combination foods, e.g., flavoured rice, noodles, shish kebabs, stews and stir fries
  • Sesame oil, sesame salt (gomasio)
  • Tahina
  • Tempeh
  • Vegetarian burgers
  • Snack bars (protein bars, granola bars)

Avoid food and products that do not have an ingredient list and read labels every time you shop.

Other possible sources of sesame:

  • Some baked goods
  • Dressings, gravies, marinades, salads, sauces and soups
  • Herbs, seasonings, flavourings and spices
  • Vegetable Pâtés
  • Snack foods, e.g., crackers, sesame snap bars, granola bars
  • Vegetable oil (may contain sesame oil)

Non-food sources of sesame seeds:

  • Adhesive bandages
  • Cosmetics, hair care products, perfumes, soaps and sunscreens
  • Drugs
  • Fungicides and insecticides
  • Lubricants, ointments and topical oils
  • Pet food
  • Sesame meal, e.g., poultry and livestock feed

Note: These lists are not complete and may change. Food and food products purchased from other countries, through mail-order or the Internet, are not always produced using the same manufacturing and labelling standards as in the US.

Avoid all food and products that contain sesame and any product whose label carries a precautionary statement warning that the product might have sesame in it such as “may contain” sesame or similar wording. When provided by a manufacturer, precautionary statements are usually found after the list of ingredients or “Contains” statement if there is one.

If sesame is part of the product formulation, it must be declared in the list of ingredients or in a separate “contains” statement immediately following the list of ingredients.

  • Avoid any products that do not have an ingredient list.
  • Read labels every time you shop. Manufacturers may occasionally change their recipes or use different ingredients for varieties of the same product.

What do I do if I am not sure whether a product contains sesame seeds?

If you have a sesame seed allergy, do not eat, drink or use the product. Obtain ingredient information from the manufacturer.

Does product size affect the likelihood of an allergic reaction?

Product size does not affect the likelihood of a reaction; however, the same brand of product may be safe to consume for one product size but not another. This is because product formulation may vary between different product sizes of the same product or be produced in a different facility. Always read the ingredient lists carefully.

Is sesame oil healthy?

Yes, sesame oil is healthy and sesame oil is goof for you, because sesame oil oil has 39.7% content of monounsaturated fats (MUFAs) and 41.7% polyunsaturated fats (PUFAs) (see Table 1 below). Monounsaturated fats can have a beneficial effect on your heart when eaten in moderation and when used to replace saturated fat and trans fat in your diet. The cholesterol-lowering effect of sesame oil could be attributed to the content of monounsaturated fats (MUFAs) and polyunsaturated fats (PUFAs) in sesame oil and sesame seeds and that part of the effect is due to the replacement of mixtures of saturated fats in the diet by monounsaturated fats and polyunsaturated fats, which are the prevalent fatty acids in sesame oil and sesame seeds. The American Heart Association recommends that for good health, the majority of the fats that you eat should be monounsaturated or polyunsaturated 10), 11). Therefore, you should eat foods containing monounsaturated fats and/or polyunsaturated fats instead of foods that contain saturated fats and/or trans fats.

Replacing bad fats (saturated and trans) with healthier fats (monounsaturated and polyunsaturated) is better for your heart.

One way you can do this is by choosing healthier nontropical vegetable oils for cooking and preparing food.

Use these oils instead of solid fats (including butter, shortening, lard and hard stick margarine) and tropical oils (including palm and coconut oil), which can have a lot of saturated fat.

Cooking and salad oils that contain more monounsaturated and polyunsaturated fats and less saturated fat:

  • Canola oil
  • Corn oil
  • Olive oil
  • Peanut oil
  • Safflower oil
  • Soybean oil
  • Sunflower oil

Blends or combinations of these oils, often sold under the name “vegetable oil,” and cooking sprays made from these oils are also good choices. Some specialty oils, like avocado, grapeseed, rice bran and sesame, can be healthy choices but may cost a bit more or be harder to find. Also to make sure you’re getting the healthier oil, always read the ingredients of the oil for added antioxidants like TBHQ (Tert-butylhydroquinone).

In general, choose oils with less than 4 grams of saturated fat per tablespoon, and no partially hydrogenated oils or trans fats.

You may find that some oils have distinctive flavors, so try different types to discover which ones you like. Also, some oils are better for certain types of cooking than others, so you may want to have more than one type in your pantry.

Figure 1. Dietary Fats and Mortality Rates

dietary fats and mortality rate

Sesame oil nutrition facts

Sesame oil has 40 calories per teaspoon.

Table 1. Sesame oil nutrition

NutrientUnitValue per 100 gteaspoon 4.5 g
Approximates
Waterg00
Energykcal88440
Proteing00
Total lipid (fat)g1004.5
Carbohydrate, by differenceg00
Fiber, total dietaryg00
Sugars, totalg00
Minerals
Calcium, Camg00
Iron, Femg00
Magnesium, Mgmg00
Phosphorus, Pmg00
Potassium, Kmg00
Sodium, Namg00
Zinc, Znmg00
Vitamins
Vitamin C, total ascorbic acidmg00
Thiaminmg00
Riboflavinmg00
Niacinmg00
Vitamin B-6mg00
Folate, DFEµg00
Vitamin B-12µg00
Vitamin A, RAEµg00
Vitamin A, IUIU00
Vitamin E (alpha-tocopherol)mg1.40.06
Vitamin D (D2 + D3)µg00
Vitamin DIU00
Vitamin K (phylloquinone)µg13.60.6
Lipids
Fatty acids, total saturatedg14.20.639
Fatty acids, total monounsaturatedg39.71.786
Fatty acids, total polyunsaturatedg41.71.877
Cholesterolmg00
Other
Caffeinemg00
[Source 12)]

What are monounsaturated fats?

From a chemical standpoint, monounsaturated fats are simply fat molecules that have one unsaturated carbon bond in the molecule, this is also called a double bond. Oils that contain monounsaturated fats are typically liquid at room temperature but start to turn solid when chilled. Monounsaturated fats are found in high concentrations in olive oil, peanut oil, canola, avocados, almonds, safflower oils, hazelnuts, pecans, pumpkin seeds and sesame seeds and most nuts. Monounsaturated fats also are part of most animal fats such as fats from chicken, pork, beef, and wild game. When you dip your bread in olive oil at an Italian restaurant, you’re getting mostly monounsaturated fat. Monounsaturated fats have a single carbon-to-carbon double bond (see Figure 2 below). The result is that it has two fewer hydrogen atoms than a saturated fat and a bend at the double bond. This structure keeps monounsaturated fats liquid at room temperature. The carbon-carbon double bond found in monounsaturated or polyunsaturated fatty acids can exist in the cis or trans configuration. When the two hydrogen atoms are on opposite sides of the double bond, the configuration is called trans. When the hydrogen atoms are on the same side of the double bond, the configuration is called cis.

The discovery that monounsaturated fat could be healthful came from the Seven Countries Study during the 1960s. It revealed that people in Greece and other parts of the Mediterranean region enjoyed a low rate of heart disease despite a high-fat diet. The main fat in their diet, though, was not the saturated animal fat common in countries with higher rates of heart disease. It was olive oil, which contains mainly monounsaturated fat. This finding produced a surge of interest in olive oil and the “Mediterranean Diet” a style of eating regarded as a healthful choice today.

Although there’s no recommended daily intake of monounsaturated fats, the Institute of Medicine recommends using them as much as possible along with polyunsaturated fats to replace saturated and trans fats.

Figure 2. Monounsaturated Fatty Acids Structure

monounsaturated fatty acids structure

Figure 3. Polyunsaturated Fatty Acids Structure

polyunsaturated fatty acids structure

Which foods contain monounsaturated fats?

Most foods contain a combination of different fats.

Examples of foods high in monounsaturated fats include plant-based liquid oils such as:

  • olive oil,
  • canola oil,
  • peanut oil,
  • safflower oil and
  • sesame oil.

Other sources include avocados, peanut butter and many nuts and seeds.

How do monounsaturated fats affect my health?

Monounsaturated fats can help reduce bad cholesterol levels in your blood which can lower your risk of heart disease and stroke. They also provide nutrients to help develop and maintain your body’s cells. Oils rich in monounsaturated fats also contribute vitamin E to the diet, an antioxidant vitamin most Americans need more of.

Are monounsaturated fats better for me than saturated fats or trans fats?

Yes. While, all fats provide 9 calories per gram, monounsaturated fats and polyunsaturated fats can have a positive effect on your health, when eaten in moderation. The bad fats –saturated fats and trans fats – can negatively affect your health.

Sesame oil health benefits

Sesame oil has been shown to reduce high blood pressure and lower the amount of medication needed to control hypertension 13). Sesame oil is also capable of reducing plasma cholesterol, low-density lipoprotein (LDL) “bad” cholesterol, and triglyceride (TG) levels 14). Earlier studies of sesame oil diet-fed low-density lipoprotein receptor knockout (LDLR−/−) female mice showed that the plasma levels of total cholesterol, triglycerides, VLDL (very low density LDL) “bad” cholesterol, and LDL “bad” cholesterol were decreased, while HDL “good” cholesterol was significantly increased in these animals compared to high-fat diet-fed control animals 15). The sesame oil diet effectively prevented inflammation and atherosclerotic lesion formation in LDL-R−/− male mice 16). The ratio of saturated to unsaturated fatty acid composition in sesame oil is less 17) compared with many other oils, but the observed level of inhibition of atherosclerosis is remarkable. This extraordinary finding prompted scientists to question whether components in the sesame oil beyond simply the fatty acid composition could be responsible for the observed level of atherosclerotic inhibition.

Sesame oil contains lignans, which are known to complex cholesterol from the gut and prevent cholesterol absorption 18). The contribution of these lignans to the observed drop in plasma cholesterol is plausible. Similarly, nonsaponifiable components of sesame oil might be contributing to the prevention of cholesterol absorption. We observed a decrease in the mRNA level of CD68, a marker for monocyte/macrophages, in nonsaponifiable components of sesame oil diet-fed animals compared to high fat diet-fed animals. The decrease of CD68 in the aortic arch area containing lesions is a confirmation that the presence of foam cell-forming macrophages in nonsaponifiable components of sesame oil animals was reduced. Animal data suggest that nonsaponifiable components of sesame oil is able to inhibit atherosclerosis in animals 19).

Sesame oil uses

The outstanding characteristic of sesame oil is its long shelf life due to its natural antioxidant, sesamol. This quality makes sesame oil applicable for use in the manufacture of margarine in many parts of the world where there is inadequate refrigeration. Sesame oil is also used in paints, soaps, cosmetics, perfumes, bath oils, insecticides and pharmaceuticals (vehicle for drug delivery). Poppy seed, cotton seed and rape oils are frequently added to sesame oil.

In Ayurvedic medicine, sesame oil is used for massaging as it is believed to rid the body of heat due to its viscous nature upon rubbing 20).

In industry, sesame oil may be used as 21):

  • a solvent in injected drugs or intravenous drip solutions,
  • a cosmetics carrier oil,
  • coating stored grains to prevent weevil attacks. The oil also has synergy with some insecticides 22).

Low-grade sesame oil is used locally in soaps, paints, lubricants, and illuminants 23).

Sesame oil for cooking

Besides being used as a cooking oil in South India, sesame oil is used as a flavor enhancer in Middle Eastern, African, and Southeast Asian cuisines. Sesame oil has a distinctive nutty aroma and taste.

One type of sesame oil, a pale yellow liquid with a pleasant grain-like odor and somewhat nutty taste, is used as frying oil 24). A second type of oil, amber-colored and aromatic, is made from pressed and toasted sesame seeds and is used as a flavoring agent in the final stages of cooking 25).

Despite sesame oil’s high proportion (41%) of polyunsaturated (omega-6) fatty acids, it is least prone, among cooking oils with high smoke points, to turn rancid when kept in the open 26). This is due to the natural antioxidants, such as sesamol, present in the oil 27).

Light sesame oil has a high smoke point and is suitable for deep-frying, while dark sesame oil (from roasted sesame seeds) has a slightly lower smoke point and is unsuitable for deep-frying 28). Instead it can be used for the stir frying of meats or vegetables, sautéing, or for the making of an omelette.

Sesame oil is most popular in Asia, especially in Korea, China, and the South Indian states of Karnataka, Andhra Pradesh, and Tamil Nadu, where its widespread use is similar to that of olive oil in the Mediterranean.

  • East Asian cuisines often use roasted sesame oil for seasoning.
  • The Chinese use sesame oil in the preparation of meals.
  • In Japan, rāyu is a paste made of chili-sesame oil seasoning and used as a spicy topping on various foods, or mixed with vinegar and soy sauce and used as a dip.
  • In South India, before the advent of modern refined oils produced on a large scale, sesame oil was used traditionally for curries and gravies. It continues to be used, particularly in Tamil Nadu and Andhra Pradesh, mixed with foods that are hot and spicy as it neutralizes the heat. It is often mixed in with a special spice powder that accompanies idli and dosa as well as rice mixed with spice powders (such as paruppu podi).

Sesame oil vs olive oil

Olive oil is a key component of the Mediterranean Diet (MedDiet), being the main source of vegetable fat, especially monounsaturated fatty acids (MUFA) 29). Virgin olive oil, produced by mechanically pressing ripe olives, contains multiple bioactive and antioxidant components such as polyphenols, phytosterols and vitamin E 30), and has an acidity of <1.5%. Extra-virgin olive oil is also produced by mechanically pressing the olives but is the oil with the best quality, the most intense taste and its acidity is <1% 31). In contrast, common olive oil, obtained from a mixture of virgin and refined oil (usually more than 80% is refined), has fewer antioxidant and anti-inflammatory compounds. Since refined olive oil during the refining process loses phytochemicals, this oil is mixed with virgin olive oil to enhance the flavor, constituting the so-called common olive oil 32).

Evidence suggests that olive oil intake is inversely associated with cardiovascular disease in the Spanish general population 33) and in a cohort of Italian women 34). In the Spanish cohort of the European Prospective Investigation into Cancer and Nutrition study, total olive oil intake has been associated with a decreased risk of coronary heart disease, and also all-cause and cardiovascular mortality 35). Similarly, a lower risk of mortality was associated with regular consumption of olive oil in an Italian population after a heart attack 36) and also in an elderly population 37). A recent meta-analysis concluded that epidemiologic studies consistently found an inverse association between olive oil consumption and stroke, but there were inconsistencies between studies assessing coronary heart disease (coronary artery disease) as the end-point 38). Of note, most of the previous studies made no distinction among the different varieties of olive oil 39). Except for the European Prospective Investigation into Cancer and Nutrition-Spanish cohort that found a greater beneficial effect in coronary heart disease for the virgin olive oil variety than for the common variety 40) and similar effects for both varieties on all-cause mortality 41). This distinction is important because extra-virgin olive oil contains much higher amounts of polyphenols than common olive oil. These polyphenols may have cardiovascular benefits beyond the lipid profile. It has also been reported that olive oil intake could be beneficial in the prevention of certain cancers, such as breast cancer 42), but the evidence is weaker.

Recently, in the context of the Primary Prevention of Cardiovascular Disease with a Mediterranean Diet Supplemented with Extra-Virgin Olive Oil or Nuts Study, it has been demonstrated that persons at high cardiovascular risk, the incidence of major cardiovascular events was lower among those assigned to a Mediterranean diet supplemented with extra-virgin olive oil or nuts than among those assigned to a reduced-fat diet 43).

Table 2. Olive oil nutrition facts

NutrientUnitValue per 100 gteaspoon 4.5 g
Approximates
Waterg00
Energykcal88440
Proteing00
Total lipid (fat)g1004.5
Carbohydrate, by differenceg00
Fiber, total dietaryg00
Sugars, totalg00
Minerals
Calcium, Camg10
Iron, Femg0.560.03
Magnesium, Mgmg00
Phosphorus, Pmg00
Potassium, Kmg10
Sodium, Namg20
Zinc, Znmg00
Vitamins
Vitamin C, total ascorbic acidmg00
Thiaminmg00
Riboflavinmg00
Niacinmg00
Vitamin B-6mg00
Folate, DFEµg00
Vitamin B-12µg00
Vitamin A, RAEµg00
Vitamin A, IUIU00
Vitamin E (alpha-tocopherol)mg14.350.65
Vitamin D (D2 + D3)µg00
Vitamin DIU00
Vitamin K (phylloquinone)µg60.22.7
Lipids
Fatty acids, total saturatedg13.8080.621
Fatty acids, total monounsaturatedg72.9613.283
Fatty acids, total polyunsaturatedg10.5230.474
Cholesterolmg00
Other
Caffeinemg00
[Source 44)]

References   [ + ]

read more

Is peanut oil healthy

peanut oil

Is peanut oil healthy?

The short answer is yes, peanut oil good for you because peanut oil has 43% content of monounsaturated fats (MUFAs) and 35% polyunsaturated fats (PUFAs) (see Table 1 below). Monounsaturated fats can have a beneficial effect on your heart when eaten in moderation and when used to replace saturated fat and trans fat in your diet. The cholesterol-lowering effect of peanut oil (and peanuts) could be attributed to the content of monounsaturated fats (MUFAs) and polyunsaturated fats (PUFAs) in peanut oil and peanuts and that part of the effect is due to the replacement of mixtures of saturated fats in the diet by monounsaturated fats and polyunsaturated fats, which are the prevalent fatty acids in peanut oil and peanuts. The American Heart Association recommends that for good health, the majority of the fats that you eat should be monounsaturated or polyunsaturated 1), 2). Therefore, you should eat foods containing monounsaturated fats and/or polyunsaturated fats instead of foods that contain saturated fats and/or trans fats.

Replacing bad fats (saturated and trans) with healthier fats (monounsaturated and polyunsaturated) is better for your heart.

One way you can do this is by choosing healthier nontropical vegetable oils for cooking and preparing food.

Use these oils instead of solid fats (including butter, shortening, lard and hard stick margarine) and tropical oils (including palm and coconut oil), which can have a lot of saturated fat.

Cooking oils that contain more monounsaturated and polyunsaturated fats and less saturated fat:

  • Canola oil
  • Corn oil
  • Olive oil
  • Peanut oil
  • Safflower oil
  • Soybean oil
  • Sunflower oil

Blends or combinations of these oils, often sold under the name “vegetable oil,” and cooking sprays made from these oils are also good choices. Some specialty oils, like avocado, grapeseed, rice bran and sesame, can be healthy choices but may cost a bit more or be harder to find. Also to make sure you’re getting the healthier oil, always read the ingredients of the oil for added antioxidants like TBHQ (Tert-butylhydroquinone).

In general, choose oils with less than 4 grams of saturated fat per tablespoon, and no partially hydrogenated oils or trans fats.

You may find that some oils have distinctive flavors, so try different types to discover which ones you like. Also, some oils are better for certain types of cooking than others, so you may want to have more than one type in your pantry.

Figure 1. Dietary Fats and Mortality Rates

dietary fats and mortality rate

What are monounsaturated fats?

From a chemical standpoint, monounsaturated fats are simply fat molecules that have one unsaturated carbon bond in the molecule, this is also called a double bond. Oils that contain monounsaturated fats are typically liquid at room temperature but start to turn solid when chilled. Monounsaturated fats are found in high concentrations in olive oil, peanut oil, canola, avocados, almonds, safflower oils, hazelnuts, pecans, pumpkin seeds and sesame seeds and most nuts. Monounsaturated fats also are part of most animal fats such as fats from chicken, pork, beef, and wild game. When you dip your bread in olive oil at an Italian restaurant, you’re getting mostly monounsaturated fat. Monounsaturated fats have a single carbon-to-carbon double bond (see Figure 2 below). The result is that it has two fewer hydrogen atoms than a saturated fat and a bend at the double bond. This structure keeps monounsaturated fats liquid at room temperature. The carbon-carbon double bond found in monounsaturated or polyunsaturated fatty acids can exist in the cis or trans configuration. When the two hydrogen atoms are on opposite sides of the double bond, the configuration is called trans. When the hydrogen atoms are on the same side of the double bond, the configuration is called cis.

The discovery that monounsaturated fat could be healthful came from the Seven Countries Study during the 1960s. It revealed that people in Greece and other parts of the Mediterranean region enjoyed a low rate of heart disease despite a high-fat diet. The main fat in their diet, though, was not the saturated animal fat common in countries with higher rates of heart disease. It was olive oil, which contains mainly monounsaturated fat. This finding produced a surge of interest in olive oil and the “Mediterranean Diet” a style of eating regarded as a healthful choice today.

Although there’s no recommended daily intake of monounsaturated fats, the Institute of Medicine recommends using them as much as possible along with polyunsaturated fats to replace saturated and trans fats.

Figure 2. Monounsaturated Fatty Acids Structure

monounsaturated fatty acids structure

Figure 3. Polyunsaturated Fatty Acids Structure

polyunsaturated fatty acids structure

Which foods contain monounsaturated fats?

Most foods contain a combination of different fats.

Examples of foods high in monounsaturated fats include plant-based liquid oils such as:

  • olive oil,
  • canola oil,
  • peanut oil,
  • safflower oil and
  • sesame oil.

Other sources include avocados, peanut butter and many nuts and seeds.

How do monounsaturated fats affect my health?

Monounsaturated fats can help reduce bad cholesterol levels in your blood which can lower your risk of heart disease and stroke. They also provide nutrients to help develop and maintain your body’s cells. Oils rich in monounsaturated fats also contribute vitamin E to the diet, an antioxidant vitamin most Americans need more of.

Are monounsaturated fats better for me than saturated fats or trans fats?

Yes. While, all fats provide 9 calories per gram, monounsaturated fats and polyunsaturated fats can have a positive effect on your health, when eaten in moderation. The bad fats –saturated fats and trans fats – can negatively affect your health.

Peanut allergy peanut oil

Peanut allergy is the most common cause of deaths related to food allergy. Peanut oil is often suspected of causing reactions to meals in which a more obvious source of peanut cannot be found.

Refined peanut oil is odorless and flavorless and is commonly used in catering. Crude peanut oil, which is known to contain considerable amounts of protein is used only rarely, when a peanut flavor is deliberately required.

In vivo challenges of 60 subjects with proved peanut allergy showed no reaction to refined peanut oil, but six (10%) reacted to the crude peanut oil 3).

If refined peanut oil is used properly and is not reused after cooking peanuts, it seems to be safe for most people with peanut allergy; crude oil represents a risk 4).

Crude peanut oil caused allergic reactions in 10% of allergic subjects studied and should continue to be avoided. Refined peanut oil did not pose a risk to any of the subjects. It would be reasonable to recommend a change in labeling to distinguish refined from crude peanut oil. The confusing use of the term peanut oil should be stopped, and food labeling should distinguish between refined and crude peanut oils.

Peanut oil ingestion does not pose a risk to peanut-sensitive individuals 5). Ten peanut-sensitive patients were enrolled in a double-blind crossover trial to determine whether ingestion of peanut oil can induce adverse reactions in such individuals 6). All patients had experienced prior allergic reactions to peanut ingestion, including any of the following: generalized urticaria, angioedema, abdominal cramps, vomiting, diarrhea, bronchospasm, or shock. All patients had elevated levels of serum IgE antibodies to both crude peanut extract and the purified peanut allergen, Peanut-I, by RAST assay; binding values ranged from 2 to 26 times that of negative control serum. All patients demonstrated negative puncture skin tests to both peanut oil and olive oil (control). At 30-min intervals, patients ingested 1, 2, and 5 ml of either oil contained in 1 ml capsules while under constant observation. These quantities exceed the maximum estimated dose of peanut oil that would occur in single meals. Patients returned 2 wk later for ingestion challenge with the remaining oil. No untoward reactions were observed with either peanut oil or olive oil.

The results of this double-blind crossover trial clearly indicate that peanut oil is not allergenic to peanut-sensitive individuals 7). Individuals with peanut hypersensitivity do not need to eliminate peanut oil from their diets 8). In managing the peanut-sensitive individual, usual and reasonable advice has been to avoid peanuts and other potential sources of the allergen. This warning has commonly included an avoidance of peanut oil. However, based on the results of this study, it is not necessary to eliminate or restrict the use of peanut oil by peanut-sensitive individuals. Undue restriction of the allergic patient’s diet is not only confusing to the patient but also raises unwarranted and unnecessary anxiety.

Peanut oil bottom line

  • Most health professionals agree that refined peanut oil is unlikely to be a problem for people with peanut allergy, because almost all the proteins that cause allergic reactions are likely to be removed during the manufacturing process. However, refined peanut oil is still covered by food labeling rules and so it will be listed as ‘peanut oil’ when used in pre-packed foods.
  • Cold-pressed, or unrefined/unprocessed (crude) peanut oil can contain peanut proteins, which can cause a reaction in people who are sensitive. Remember that peanut oil is often called ‘groundnut oil’.

Does peanut oil elicit an allergic reaction?

If refined peanut oil is used properly and is not reused after cooking peanuts, it seems to be safe for most people with peanut allergy; crude oil, however, represents a risk. Cold pressed, expelled or extruded peanut oil is NOT safe for peanut allergic individuals.

Peanut oil nutrition

Monounsaturated fats – like all fats – contain 9 calories per gram.

Table 1. Peanut oil nutrition facts

NutrientUnitTbsp 14 g Value per 100 g
Approximates
Energykcal120857
Proteing00
Total lipid (fat)g14100
Carbohydrate, by differenceg00
Minerals
Sodium, Namg00
Lipids
Fatty acids, total saturatedg2.517.86
Fatty acids, total monounsaturatedg642.86
Fatty acids, total polyunsaturatedg4.99935.71
Fatty acids, total transg00
Cholesterolmg00
[Source 9)]

Peanut oil vs Canola oil

Table 2. Canola oil nutrition facts

NutrientUnitTbsp 14 g Value per 100 g
Approximates
Energykcal120857
Proteing00
Total lipid (fat)g14100
Carbohydrate, by differenceg00
Minerals
Sodium, Namg00
Lipids
Fatty acids, total saturatedg17.14
Fatty acids, total monounsaturatedg9.00164.29
Fatty acids, total polyunsaturatedg428.57
Fatty acids, total transg00
Cholesterolmg00
[Source 10)]

Peanut oil vs Vegetable oil

Table 3. Vegetable oil (soybean oil) nutrition facts

NutrientUnitTbsp 14 g Value per 100 g
Approximates
Energykcal120857
Proteing00
Total lipid (fat)g14100
Carbohydrate, by differenceg00
Fiber, total dietaryg00
Sugars, totalg00
Minerals
Calcium, Camg00
Iron, Femg00
Sodium, Namg00
Vitamins
Vitamin C, total ascorbic acidmg00
Vitamin A, IUIU00
Lipids
Fatty acids, total saturatedg2.00114.29
Fatty acids, total monounsaturatedg321.43
Fatty acids, total polyunsaturatedg857.14
Fatty acids, total transg00
Cholesterolmg00
[Source 11)]

Cooking with peanut oil

You can usually use peanut oil just like solid cooking fats. For example, use peanut oil to:

  • Make your own salad dressings, marinades, dips and sauces.
  • Grill, sauté, stir fry, bake or roast foods.
  • Coat pans to keep food from sticking.
  • Spread or drizzle on foods for flavor.
  • “Season” cast-iron cookware.
  • Substitute for butter, margarine or solid fats in recipes.

References   [ + ]

read more

Trans fat

trans fat

What is trans fat

Trans fat is also known as trans fatty acid or partially hydrogenated oils, is an unsaturated dietary fat that increases your risk of coronary heart disease (coronary artery disease). There are two broad types of trans fats found in foods: naturally-occurring and artificial trans fats. Naturally-occurring trans fats are produced in the gut of some animals (ruminants) and foods made from these animals (e.g., dairy products like milk, butter, cheese, and meat products) may contain small quantities of trans fats. Artificial trans fats (partially hydrogenated oils) are created in an industrial process that adds hydrogen to liquid vegetable oils to make them more solid, through a process called hydrogenation (a manufacturing process that adds hydrogen to vegetable oil) 1). Foods with industrially produced trans fat include those listing hydrogenated or partially hydrogenated fat on the label, such as crackers, snack foods, commercially produced baked goods, and some stick margarines. The primary dietary source for trans fats in processed food is “partially hydrogenated oils.” Look for them on the ingredient list on food packages.

Industrially produced trans fat lowers high-density lipoprotein (HDL) “good” cholesterol, raises low-density lipoprotein (LDL) “bad” cholesterol, and an elevated low-density lipoprotein (LDL) “bad” cholesterol level in your blood increases your risk of developing coronary heart disease, the leading cause of death in men and women in the U.S. 2). By removing trans fats from processed foods could prevent thousands of heart attacks and deaths each year 3). Furthermore by reducing trans fat consumption by avoiding artificial trans fat could prevent 10,000–20,000 heart attacks and 3,000–7,000 coronary heart disease deaths each year in the U.S. 4).

Human consumption of naturally occurring trans fats from ruminants is generally low and there is evidence to suggest that it does not adversely affect health 5). In contrast, consumption of industrially produced partially hydrogenated vegetable oils has been associated with an increased risk of cardiovascular disease, infertility, endometriosis, gallstones, Alzheimer’s disease, diabetes and some cancers 6). In the 1960s, following public health campaigns aimed at decreasing the use of animal fats, the food industry began using substantial amounts of partially hydrogenated vegetable oils (trans fats) in processed food 7). Trans fat use is favored by industry – and their removal resisted – because: trans fats
are cheap; trans fats are semisolid at room temperature, which makes them easier to use in baked products; trans fats have a long shelf-life; and trans fats can withstand repeated heating 8).

Figure 1. Dietary Fats and Mortality Rates

dietary fats and mortality rate

[Source 9)]

The removal of partially hydrogenated vegetable oils containing industrially produced trans fats from the food supply has been described as one of the most straightforward public health interventions for improving diet and reducing the risk of noncommunicable disease 10). In fact, the World Health Organization (WHO) has called for the elimination of trans fats from the global food supply 11). In response to the rise in the prevalence of noncommunicable diseases, of which cardiovascular disease is the most common, the United Nations hosted a high-level meeting on the topic in September 2011. The political declaration that resulted from this meeting led to the development, in consultation with Member States, of a WHO global framework for monitoring noncommunicable diseases. One core indicator is the “adoption of national policies that virtually eliminate partially hydrogenated vegetable oils in the food supply and replace [them] with polyunsaturated fatty acids” 12).

Denmark pioneered the banning of industrially-produced trans fats in food in 2003, becoming the first country in the world and a trailblazer for other governments determined to protect their public’s health from this heart disease-causing threat.

U.S. Food and Drug Administration (FDA) has taken steps to remove artificial trans fats in processed foods. In 2015, FDA determined that trans fats (partially hydrogenated oils), the major source of artificial trans fat in the food supply, are no longer “Generally Recognized as Safe,” or GRAS 13). For the majority of uses of trans fats, June 18, 2018, remains the date after which manufacturers cannot add trans fats (partially hydrogenated oils) to foods 14). However, to allow for an orderly transition in the marketplace, FDA is allowing more time for products produced prior to June 18, 2018 to work their way through distribution. FDA is extending the compliance date for these foods to January 1, 2020 15). This action balances the health benefits of removing trans fats (partially hydrogenated oils) from the food supply with the need to provide an orderly transition in the marketplace.

Why are trans fats bad for you?

Industrially produced trans fat lowers high-density lipoprotein (HDL) “good” cholesterol, raises low-density lipoprotein (LDL) “bad” cholesterol, and an elevated low-density lipoprotein (LDL) “bad” cholesterol level in your blood increases your risk of developing coronary heart disease, the leading cause of death in men and women in the U.S. 16). By removing trans fats from processed foods could prevent thousands of heart attacks and deaths each year 17). Furthermore by reducing trans fat consumption by avoiding artificial trans fat could prevent 10,000–20,000 heart attacks and 3,000–7,000 coronary heart disease deaths each year in the U.S. 18).

Consumption of industrially produced partially hydrogenated vegetable oils has been associated with an increased risk of cardiovascular disease, infertility, endometriosis, gallstones, Alzheimer’s disease, diabetes and some cancers 19).

Are there naturally occurring trans fats?

Small amounts of trans fats occur naturally in some meat and dairy products, including beef, lamb and butterfat. There have not been sufficient studies to determine whether these naturally occurring trans fats have the same bad effects on cholesterol levels as trans fats that have been industrially manufactured.

Trans fat foods

Trans fats can be found in many foods and foods that may contain artificial trans fat include fried items, savory snacks (like microwave popcorn), frozen pizzas, baked goods including cakes, pie crusts, biscuits, frozen pizza, cookies, crackers, stick margarines and other spreads, ready-to-use frosting, and coffee creamers. Food manufacturers use artificial trans fat in food products because it is inexpensive and it increases the food’s shelf life, stability, taste and texture. Many restaurants and fast-food outlets use trans fats to deep-fry foods because oils with trans fats can be used many times in commercial fryers. Several countries (e.g., Denmark, Switzerland, and Canada) and jurisdictions (California, New York City, Baltimore, and Montgomery County, MD) have reduced or restricted the use of trans fats in food service establishments.

You can determine the amount of trans fats in a particular packaged food by looking at the Nutrition Facts panel. However, products can be listed as “0 grams of trans fats” if they contain 0 grams to less than 0.5 grams of trans fat per serving. You can also spot trans fats by reading ingredient lists and looking for the ingredients referred to as “partially hydrogenated oils.”

Trans fat intake has significantly decreased in the U.S. as a result of efforts to increase awareness of its health effects, Nutrition Facts label changes, industry efforts to voluntarily reformulate foods, and some state and local governments’ restriction of its use in restaurants and other food service outlets. However, on average Americans still consume 1.3 grams (0.6% of energy) of artificial trans fat each day 20).

Table 1. Foods that contain trans fat

Trans Fat 1994-1996
(mean = 5.84 g)
Food GroupRankingPercent TotalPercent Cumulative
Cakes, cookies, crackers, pies,
bread, etc
140 (0 to 3.5 grams)40
Animal products
22161
Margarine & spreads
317 (0 to 3 grams)78
Fried potatoes
4886
Potato chips, corn chips, popcorn
5591
Household shortening
6495
[Source 21)]

Table 2. Contribution of various foods to trans fat intake in the diet

Food groupContribution (per cent of total trans fats consumed)
Cakes, cookies, crackers, bread etc.40
Animal products21
Margarine7
Fried potatoes8
Potato chips, corn chips, popcorn5
Household shortening4
Breakfast cereals and candy etc.5
[Source 22)]

Table 3. Intake of industrially produced trans-fatty acids in different countries

CountryRuminant (%)Industrially produced TFA (%)Mixed (%)% Total energy
TotalFast foodsSpreads
Australia60248–24160.6
NZ41463–16130.7
Canada198122372.2
Denmark50501
US2179172.6
Europe0.9
Europe1–2
UK181.2
Iran4.2
Indiaa0.9–1.35

aRisk Assessment Report on trans-fatty acids in Indian Diets submitted by National Institute of Nutrition, Hyderabad in October, 2009

[Source 23)]

How much trans fat is recommended in the diet?

The recommended amount of artificial trans fat is 0 (zero) gram.

The American Heart Association recommends cutting back on foods containing partially hydrogenated vegetable oils to reduce trans fat in your diet and preparing lean meats and poultry without added saturated and trans fat.

The most recent Dietary Guidelines for Americans recommend avoiding industrial trans fat and limiting intakes of trans fat from natural sources to <0.5 % of total calories. This reflects the decision of the US Food and Drug Administration (FDA) on partially hydrogenated oils, the primary dietary source of industrially produced trans fat in the US, which are no longer generally recognized as safe and the complete ban of food manufacturers from adding trans fat into their products.

In Europe, recommendations for trans fat ranged from ≤ 2 % of total calories (France, UK) to ≤ 1 % of total calories (Belgium, the Netherlands, Germany-Austria-Switzerland, Spain). Latest recommendations for Belgium, Germany-Austria-Switzerland, the Nordic countries, and Spain indicate that dietary intakes of trans fat should be as low as possible, in any case < 1 % of total calories, whereas a 2 % of total calories limit has been maintained in France (2010) and the UK (2007) 24). Most recent recommendations from professional associations in Europe (European Society of Cardiology) and the US (American Heart Association; American Diabetes Association) indicate that consumption of trans fat should be as low as possible 25).

Why did trans fats become so popular if they have such bad health effects?

Before 1990, very little was known about how trans fat can harm your health. In the 1990s, research began identifying the adverse health effects of trans fats. Based on these findings, FDA instituted labeling regulations for trans fat and consumption has decreased in the US in recent decades, however some individuals may consume high levels of trans fats based on their food choices.

How can I limit my daily of trans fats?

Read the Nutrition Facts panel on foods you buy at the store and, when eating out, ask what kind of oil foods are cooked in. Replace the trans fats in your diet with monounsaturated or polyunsaturated fats.

Read the Nutrition Facts label and ingredient list to compare foods.

  • Choose products with 0 grams trans fat.
  • Check the Ingredient List to see if there is any partially hydrogenated oil in the product.
  • Because products containing less than 0.5 grams of trans fat per serving can be labeled as having 0 grams trans fat, checking the Ingredient List is important to avoid all artificial trans fat.

When choosing foods low in trans fat, make sure they are also low in saturated fat and cholesterol: look for foods with 5% of the Daily Value or less. Foods with 20% or more of the Daily Value of these two components are high.

Use monounsaturated fat (canola and olive oil) and polyunsaturated fat (soybean, corn, and sunflower oil) in recipes that call for fat.

A good way to avoid trans fat is to eat a balanced diet rich in fruits, vegetables, whole grains, lean sources of protein, and low-fat or fat-free dairy products.

Ask your grocer to stock products free of “partially hydrogenated oil” and “shortening”.

Talk with your favorite restaurant establishment about current use of partially hydrogenated oils or changing to a menu that is 100% free of “partially hydrogenated oil” and “shortening”.

Choose restaurants that do not use partially hydrogenated oil to prepare food.

Other dietary factors that will help to lower your trans fat and fight cardiovascular disease:

  • Eat a dietary pattern that emphasizes fruits, vegetables, whole grains, low-fat dairy products, poultry, fish and nuts. Also limit red meat and sugary foods and beverages.
  • Use naturally occurring, unhydrogenated vegetable oils such as canola, safflower, sunflower or olive oil most often.
  • Look for processed foods made with unhydrogenated oil rather than partially hydrogenated or hydrogenated vegetable oils or saturated fat.
  • Use soft margarine as a substitute for butter, and choose soft margarines (liquid or tub varieties) over harder stick forms. Look for “0 g trans fat” on the Nutrition Facts label and no hydrogenated oils in the ingredients list.
  • Doughnuts, cookies, crackers, muffins, pies and cakes are examples of foods that may contain trans fat. Limit how frequently you eat them.
  • Limit commercially fried foods and baked goods made with shortening or partially hydrogenated vegetable oils. Not only are these foods very high in fat, but that fat is also likely to be trans fat.
  • Limit fried fast food. Commercial shortening and deep-frying fats are still made by hydrogenation and contain saturated and trans fats.

Consider using a food diary to keep track of what you eat. It’s a handy way to evaluate the healthy, not-so-healthy and unhealthy foods you’re making a part of your everyday diet.

Eat less of the nutrient-poor foods

The right number of calories to eat each day is based on your age and physical activity level and whether you’re trying to gain, lose or maintain your weight. You could use your daily allotment of calories on a few high-calorie foods and beverages, but you probably wouldn’t get the nutrients your body needs to be healthy. Limit foods and beverages high in calories but low in nutrients. Also limit the amount of saturated fat, trans fat and sodium you eat. Read Nutrition Facts labels carefully — the Nutrition Facts panel tells you the amount of healthy and unhealthy nutrients in a food or beverage.

As you make daily food choices, base your eating pattern on these recommendations:

  • Eat a variety of fresh, frozen and canned vegetables and fruits without high-calorie sauces or added salt and sugars. Replace high-calorie foods with fruits and vegetables.
  • Choose fiber-rich whole grains for most grain servings.
  • Choose poultry and fish without skin and prepare them in healthy ways without added saturated and trans fat. If you choose to eat meat, look for the leanest cuts available and prepare them in healthy and delicious ways.
  • Eat a variety of fish at least twice a week, especially fish containing omega-3 fatty acids (for example, salmon, trout and herring).
  • Select fat-free (skim) and low-fat (1%) dairy products.
  • Avoid foods containing partially hydrogenated vegetable oils to reduce trans fat in your diet.
  • Limit saturated fat and trans fat and replace them with the better fats, monounsaturated and polyunsaturated. If you need to lower your blood cholesterol, reduce saturated fat to no more than 5 to 6 percent of total calories. For someone eating 2,000 calories a day, that’s about 13 grams of saturated fat.
  • Cut back on beverages and foods with added sugars.
  • Choose foods with less sodium and prepare foods with little or no salt. To lower blood pressure, aim to eat no more than 2,300 milligrams of sodium per day. Reducing daily intake to 1,500 mg is desirable because it can lower blood pressure even further. If you can’t meet these goals right now, even reducing sodium intake by 1,000 mg per day can benefit blood pressure.
  • If you drink alcohol, drink in moderation. That means no more than one drink per day if you’re a woman and no more than two drinks per day if you’re a man.
  • Also, don’t smoke tobacco — and avoid secondhand smoke.

Trans fat vs Saturated fat

Saturated fats are fat molecules that are “saturated” with hydrogen molecules. They are typically solids at room temperature — think cooled bacon grease, butter, beef tallow, coconut oil, ghee or pork lard. Common sources of saturated fat include lard, butter, ghee, red meat, palm oil, whole milk and other whole-milk dairy foods, cheese, coconut oil, and many commercially prepared baked goods and other foods 26). Coconut, palm kernel, and palm oil are called oils because they come from plants. However, they are solid or semi-solid at room temperature due to their high content of short-chain saturated fatty acids. They are considered solid fats for nutritional purposes. They also are found in other animal fats, such as pork and chicken fats and in other plant fats, such as nuts. The word “saturated” here refers to the number of hydrogen atoms surrounding each carbon atom. The chain of carbon atoms holds as many hydrogen atoms as possible — it’s saturated with hydrogens.

Saturated fats occur naturally in many foods – primarily meat and dairy products. Beef, lamb, pork on poultry (with the skin on) contain saturated fats, as do butter, cream and cheese made from whole or 2 percent milk. Plant-based foods that contain saturated fats include coconut, coconut oil and cocoa butter, as well as palm oil and palm kernel oil (often called tropical oils).

According to the American Heart Association Advisory 27), cardiovascular disease was lowered by about 30 percent, similar to the effect of cholesterol-lowering statin drugs when vegetable oil replaced saturated fat in the diet. The switch to healthier oils also was associated with lower rates of death from all causes. The American Heart Association recommends aiming for a dietary pattern that achieves 5% to 6% of calories from saturated fat, that’s about 13 grams of saturated fats a day 28).

Figure 2. Saturated Fatty Acids Structure

Saturated-Fatty-Acid-structure

Figure 3. Types Fatty Acids Structure. Trans fatty acids are unsaturated fatty acids that contain at least one double bond in the trans configuration.

types-of-fats

For people who need to lower their cholesterol, the American Heart Association recommends reducing saturated fat to no more than 5 to 6 percent of total daily calories. For someone eating 2,000 calories a day, that’s about 11 to 13 grams of saturated fat.

There is good evidence that higher intakes of saturated fats and trans fats lead to increased blood cholesterol levels which may contribute to development of heart disease. Limiting the intake of saturated and tran fats, with replacement by mono- and poly-unsaturated fatty acids, should be considered by policy makers when making nutrient recommendations and developing food-based dietary guidelines at national level.

Table 4. Saturated Fat and Calorie Content of Different Forms of Selected Foods

Food CategoryAmountSaturated Fat Content (grams)% Daily Value*Calories
Cheese• Regular cheddar cheese1 ounce6.030%114
• Low-fat cheddar cheese1 ounce1.26%49
• Low-fat cottage cheese1/2 ounce0.73%81
Ground beef• Regular ground beef (25% fat)3 ounces (cooked)6.131%236
• Extra lean ground beef (5% fat)3 ounces (cooked)2.613%148
• Ground turkey 3 ounces (cooked)3 ounces (cooked)3.014%193
Milk• Whole milk (3.5% fat)1 cup4.623%146
• Low-fat (1% fat) milk1 cup1.58%102
• Fat-free milk1 cup0.00%86
Breads• Croissant (med)1 medium6.633%231
• Bagel, oat bran (4″)1 medium0.21%227
• Buttermilk biscuit (small)1 small1.26%100
Frozen desserts• Regular ice cream1/2 cup4.925%145
• Frozen yogurt, low-fat1/2 cup2.010%110
• Sherbert1/2 cup0.94%107
Table spreads• Butter1 teaspoon2.412%34
• Soft margarine with zero trans fat1 teaspoon0.74%25
• Margarine-like spread (40% fat)1 teaspoon0.32%16
Chicken• Fried chicken (leg, with skin)3 ounces (cooked)3.317%212
• Roasted chicken (breast, no skin)3 ounces (cooked)0.95%140
• Chicken nuggets6 pieces3.919%285
Fish• Fried fish3 ounces2.814%195
• Baked fish3 ounces1.58%129
• Fish sticks3 ounces2.714%232

Footnote: * % Daily Values (DV) listed in this column are based on the food amounts listed in the table. The % DV listed is based on a 2,000 calorie diet. The DV for saturated fat is 20 grams.

[Source 29)]

Table 5. Fatty acid composition of fats and oils

healthy and bad fats listFootnote: A zero value equals <0.5 g/100 g.
*Primary safflower and sunflower oils of commerce.

[Source Data from US Department of Agriculture food composition tables 30).

Here’s what you need to know about fats:

  • Eat less saturated fat, trans fat, and cholesterol.
  • Aim to consume less than 10% of total calories from saturated fat.
  • The American Heart Association recommends that adults who would benefit from lowering LDL “bad” cholesterol reduce their intake of trans fat and limit their consumption of saturated fat to 5 to 6% of total calories.
  • Eating too much saturated fat, the type of fat that is solid at room temperature, may increase risk of heart disease. Similarly, eating too much trans fat, which is made when liquid vegetable oil is processed to become solid, also may increase risk of heart disease. And, eating too much cholesterol, a fatty substance found only in animal-based products, may clog arteries. It is important to eat less than 10% of your calories from saturated fat.

What foods have healthy fats?

Most of the fat in your diet should come from food sources of polyunsaturated and monounstatured fats. Experts recommend getting between 20% and 35% of calories from total fat, with most fats coming from fish, nuts, and vegetable oils. These foods can contain monounsaturated and polyunsaturated fats—they should replace the saturated and trans fat sources you choose to cut back on.

Plant sources of polyunsaturated fatty acids are vegetable oils, including soybean oil, corn oil, canola oil, walnuts, flaxseed and safflower oil. Eicosapentaenoic acid (EPA) and docosahexaenoic acid (DHA) are omega 3 fatty acids that are contained in fish and shellfish. Plant sources that are rich in monounsaturated fatty acids include canola oil, olive oil, high oleic safflower oil, and sunflower oil and nuts.

Table 6. Common food sources of healthy fats

MonounsaturatedPolyunsaturated Omega-6Polyunsaturated Omega-3
Nuts
Vegetable oils:
Canola
Olive
High oleic safflower
Sunflower
Vegetable oils:
Soybean
Corn
Safflower
Certain fish:
Salmon
Trout
Herring
Vegetable oils:
Soybean
Canola
Walnuts
Flaxseed

References   [ + ]

read more

Cortisol

cortisol

What is cortisol

Cortisol is a steroid hormone also known as hydrocortisone that is often called the “stress hormone” because of its connection to the stress response, however, cortisol is much more than just a hormone released during stress. Cortisol is produced by the adrenal glands which sit on top of each kidney (Figures 1 and 2).

Cortisol production by the adrenal glands is regulated by the pituitary gland. The pituitary is a pea-sized gland at the base of the brain that is sometimes referred to as the “master gland” because of its wider effects on the body.

When you wake up, exercise or you’re facing a stressful event, your pituitary gland reacts. It sends a signal to the adrenal glands to produce just the right quantity of cortisol.

When released into the bloodstream, cortisol can act on many different parts of the body and can help:

  • Your body respond to stress or danger
  • Increase your body’s metabolism of fats, carbohydrates, and protein
  • Regulate metabolism, the process of how your body uses food and energy
  • Regulate blood sugar
  • Control your blood pressure
  • Control bone growth
  • Regulate immune system function and reduce inflammation and fight infection
  • Nervous system function.

Cortisol is a hormone that plays a role in the metabolism of proteins, lipids, and carbohydrates. Cortisol affects blood glucose levels, helps maintain blood pressure, and helps regulate the immune system.

Cortisol is also needed for the fight or flight response which is a healthy, natural response to perceived threats. The amount of cortisol produced is highly regulated by your body to ensure the balance is correct.

Most cortisol in the blood is bound to a protein; only a small percentage is “free” and biologically active. Free cortisol is secreted into the urine and is present in the saliva. This test measures the amount of cortisol in the blood, urine, or saliva.

Most cells within the body have cortisol receptors. Secretion of the hormone is controlled by the hypothalamus, the pituitary gland, and the adrenal gland, a combination glands often referred to as the hypothalamic pituitary axis. When the hypothalamus produces corticotrophin-releasing hormone (CRH), it stimulates the pituitary gland to release adrenal corticotrophic hormone (ACTH) (see Figure 5). These hormones, in turn, alert the adrenal glands to produce corticosteroid hormones (e.g. cortisol and corticosterone).

Cortisol is produced and secreted by the adrenal glands, two triangular organs that sit on top of the kidneys (Figure 2). Production of the hormone is regulated by the hypothalamus in the brain and by the pituitary gland, a tiny organ located below the brain (Figure 1, 3, 4 and 5). When the blood cortisol level falls, the hypothalamus releases corticotropin-releasing hormone (CRH), which directs the pituitary gland to produce ACTH (adrenocorticotropic hormone). ACTH stimulates the adrenal glands to produce and release cortisol. In order for appropriate amounts of cortisol to be made, the hypothalamus, the pituitary, and the adrenal glands must be functioning properly.

What happens when you produce too much or little cortisol?

Your body usually produces the right amount of cortisol. In a condition such as Cushing’s syndrome, it produces too much. In a condition such as Addison’s disease, it produces too little.

Symptoms of too much cortisol include:

  • weight gain, particularly around the abdomen and face
  • thin and fragile skin that is slow to heal
  • acne
  • for women, facial hair and irregular menstrual periods.

Symptoms of not enough cortisol include:

  • continual tiredness
  • nausea and vomiting
  • weight loss
  • muscle weakness
  • pain in the abdomen.

If you experience any of these symptoms, your doctor may suggest you have a blood test to measure your cortisol levels.

If your body does not produce enough cortisol, your doctor may prescribe corticosteroids for you. Corticosteroids are synthetic versions of cortisol that can be used to treat a variety of conditions including:

  • inflammatory conditions (such as asthma)
  • Addison’s disease
  • skin conditions (such as psoriasis).

Some people take anabolic steroids to build muscles, without a doctor’s prescription. This is risky. Anabolic steroids are different to corticosteroids.

Because corticosteroids are powerful medications, side effects are quite common. These may include:

  • thinning skin
  • osteoporosis
  • weight gain, especially around the face, and increased appetite
  • high blood sugar or diabetes
  • rapid mood changes, feeling irritable and anxious
  • an increased chance of infections like chickenpox or measles
  • Cushing’s syndrome
  • eye conditions, such as glaucoma and cataracts
  • depression or suicidal thoughts
  • high blood pressure.

If you experience these side effects, it is important to talk to your doctor before stopping your medication.

cortisol

Figure 1. Location of the adrenal glands on top of each kidneys

adrenal glands locationFigure 2. Adrenal gland anatomy

adrenal gland anatomy

Figure 3. The pituitary gland location

pituitary gland

Figure 4. Pituitary gland

location of the pituitary gland

Figure 5. The hypothalamus and pituitary gland (anterior and posterior) endocrine pathways and target organs

Hypothalamus hormones

Cortisol function

Cortisol is a hormone, which is mainly released at times of stress and has many important functions in your body. Having the right cortisol balance is essential for human health and you can have problems if your adrenal gland releases too much or too little cortisol.

Cortisol regulates how the body converts fats, proteins, and carbohydrates to energy. Cortisol also helps regulate blood pressure and cardiovascular function.

What does cortisol do?

The more important actions of cortisol include:

  1. Inhibition of protein synthesis in tissues, increasing the blood concentration of amino acids.
  2. Promotion of fatty acid release from adipose tissue, increasing the utilization of fatty acids and decreasing the use of glucose as energy sources.
  3. Stimulation of liver cells to synthesize glucose from non-carbohydrates, such as circulating amino acids and glycerol, increasing the blood glucose concentration.

These actions of cortisol help keep blood glucose concentration within the normal range between meals. This control is important, because a few hours without food can exhaust the supply of liver glycogen, a major source of glucose.

Negative feedback controls cortisol release. This is much like control of thyroid hormones, involving the hypothalamus, anterior pituitary gland, and adrenal cortex. The hypothalamus secretes corticotropin-releasing hormone (CRH) into the pituitary gland portal veins, which carry CRH to the anterior pituitary, stimulating it to secrete adrenal corticotrophic hormone (ACTH). In turn, ACTH stimulates the adrenal cortex to release cortisol. Cortisol inhibits the release of corticotropin-releasing hormone (CRH) and ACTH (adrenocorticotropic hormone), and as concentrations of these fall, cortisol production drops.

The set point of the feedback mechanism controlling cortisol secretion may change to meet the demands of changing conditions. For example, under stress—as from injury, disease, or emotional upset—information concerning the stressful condition reaches the brain. In response, brain centers signal the hypothalamus to release more corticotropin-releasing hormone (CRH), elevating the blood cortisol concentration until the stress subsides.

Figure 6. Negative feedback regulates cortisol secretion

regulation of corisol secreti

Cortisol test

A cortisol test is used to help diagnose disorders of the adrenal gland. These include Cushing’s syndrome, a condition that causes your body to make too much cortisol, and Addison disease, a condition in which your body doesn’t make enough cortisol.

A cortisol test may be ordered when a person has symptoms that suggest a high level of cortisol and Cushing syndrome, such as:

  • High blood pressure (hypertension)
  • High blood sugar (glucose)
  • Obesity, especially in the trunk
  • Fragile skin
  • Purple streaks on the abdomen
  • Muscle wasting and weakness
  • Osteoporosis

Testing may be ordered when women have irregular menstrual periods and increased facial hair; children may have delayed development and a short stature.

Cortisol test may be ordered when someone has symptoms suggestive of a low level of cortisol, adrenal insufficiency or Addison disease, such as:

  • Weight loss
  • Muscle weakness
  • Fatigue
  • Low blood pressure
  • Abdominal pain
  • Dark patches of skin (this occurs in Addison disease but not secondary adrenal insufficiency)

You may also need a cortisol test if you have symptoms of an adrenal crisis, a life-threatening condition that can happen when your cortisol levels are extremely low. Symptoms of an adrenal crisis include:

  • Very low blood pressure
  • Severe vomiting
  • Severe diarrhea
  • Dehydration
  • Sudden and severe pain in the abdomen, lower back, and legs
  • Confusion
  • Loss of consciousness

Suppression or stimulation testing is ordered when initial findings are abnormal. Cortisol testing may be ordered at intervals after a diagnosis of Cushing syndrome or Addison disease to monitor the effectiveness of treatment.

Cortisol blood test

Typically, blood will be drawn from a vein in your arm, but sometimes urine or saliva may be tested. Cortisol blood tests may be drawn at about 8 am, when cortisol should be at its peak, and again at about 4 pm, when the level should have dropped significantly.

Sometimes a resting sample will be obtained to measure cortisol when it should be at its lowest level (just before sleep); this is often done by measuring cortisol in saliva rather than blood to make it easier to obtain the sample. Saliva for cortisol testing is usually collected by inserting a swab into the mouth and waiting a few minutes while the swab becomes saturated with saliva. Obtaining more than one sample allows the health practitioner to evaluate the daily pattern of cortisol secretion (the diurnal variation).

Sometimes urine is tested for cortisol; this usually requires collecting all of the urine produced during a day and night (a 24-hour urine) but sometimes may be done on a single sample of urine collected in the morning.

Some test preparation may be needed. Follow any instructions that are given as far as timing of sample collection, resting, and/or any other specific pre-test preparation.

A stimulation or suppression test requires that you have a baseline blood sample drawn and then a specified amount of drug is given. Subsequent blood samples are drawn at specified times.

Will I need to do anything to prepare for the test?

Stress can raise your cortisol levels, so you may need to rest before your test. A blood test will require you to schedule two appointments at different times of the day. Twenty-four hour urine and saliva tests are done at home. Be sure to follow all the instructions given by your provider.

What do the results mean?

High levels of cortisol may mean you have Cushing’s syndrome, while low levels may mean you have Addison disease or another type of adrenal disease. If your cortisol results are not normal, it doesn’t necessarily mean you have a medical condition needing treatment. Other factors, including infection, stress, and pregnancy can affect your results. Birth control pills and other medicines can also affect your cortisol levels. To learn what your results mean, talk to your health care provider.

Is there anything else I need to know about a cortisol test?

If your cortisol levels are not normal, your health care provider will likely order more tests before making a diagnosis. These tests may include additional blood and urine tests and imaging tests, such as CT (computerized tomography) and MRI (magnetic resonance imaging) scans, which allow your provider to look at your adrenal and pituitary glands.

Cortisol saliva test

A cortisol saliva test is usually done at home, late at night, when cortisol levels are lower. Your health care provider will recommend or provide you with a kit for this test. The kit will likely include a swab to collect your sample and a container to store it. A saliva test requires special care in obtaining the sample. Steps usually include the following:

  • Do not eat, drink, or brush your teeth for 15-30 minutes before the test.
  • Collect the sample between 11 p.m. and midnight, or as instructed by your provider.
  • Put the swab into your mouth.
  • Roll the swab in your mouth for about 2 minutes so it can get covered in saliva.
  • Don’t touch the tip of the swab with your fingers.
  • Put the swab into the container within the kit and return it to your provider as instructed.

Follow any specific instructions that are provided. Salivary cortisol testing is being used more frequently to help diagnose Cushing syndrome and stress-related disorders but still requires specialized expertise to perform.

Cortisol urine test

The cortisol urine test measures the level of cortisol in the urine.

Cortisol can also be measured using a blood or saliva test.

A 24-hour urine sample is needed. You will need to collect your urine over 24 hours in a container provided by the laboratory. Your health care provider will tell you how to do this. Follow instructions exactly.

Because cortisol level rises and falls throughout the day, the test may need to be done three or more separate times to get a more accurate picture of average cortisol production.

How to prepare for the urine test

You may be asked not to do any vigorous exercising the day before the test.

You may also be told to temporarily stop taking medicines that can affect the test, including:

  • Anti-seizure drugs
  • Estrogen
  • Human-made (synthetic) glucocorticoids, such as hydrocortisone, prednisone and prednisolone
  • Androgens

Do I need both tests (blood and urine) or is one better than the other?

If your healthcare provider suspects Cushing syndrome, usually both blood and urine are tested as they offer complementary information. Blood cortisol is easier to collect but is affected more by stress than is the 24-hour urine test. Salivary cortisol may sometimes be tested instead of blood cortisol.

Testing for Excess Cortisol Production

If a person has a high blood cortisol level, a health practitioner may perform additional testing to confirm that the high cortisol is truly abnormal (and not simply due to increased stress or the use of cortisol-like medication). This additional testing may include measuring the 24-hour urinary cortisol, doing an overnight dexamethasone suppression test, and/or collecting a salivary sample before retiring in order to measure cortisol at the time that it should be the lowest. Urinary cortisol requires the collection of urine over a timed period, usually 24 hours. Since ACTH is secreted by the pituitary gland in pulses, this test helps determine whether the elevated blood cortisol level represents a real increase.

Dexamethasone suppression: The dexamethasone suppression test involves analyzing a baseline sample for cortisol, then giving the person oral dexamethasone (a synthetic glucocorticoid) and measuring cortisol levels in subsequent timed samples. Dexamethasone suppresses ACTH production and should decrease cortisol production if the source of the excess is stress.

Collecting a salivary sample for cortisol measurement is a convenient way to determine whether the normal rhythm of cortisol production is altered. If one or more of these tests confirms that there is abnormal cortisol production, then additional testing, including measuring ACTH, repeating the dexamethasone suppression test using higher doses, and radiologic imaging may be ordered.

Dexamethasone suppression test (also called ACTH suppression test or Cortisol suppression test) measures whether adrenocorticotrophic hormone (ACTH) secretion by the pituitary can be suppressed.

How the dexamethasone test is performed

During this test, you will receive dexamethasone. This is a strong man-made (synthetic) glucocorticoid medicine. Afterward, your blood is drawn so that the cortisol level in your blood can be measured.

There are two different types of dexamethasone suppression tests: low dose and high dose. Each type can either be done in an overnight (common) or standard (3-day) method (rare). There are different processes that may be used for either test. Examples of these are described below.

Common:

  • Low-dose overnight — You will get 1 milligram (mg) of dexamethasone at 11 p.m., and a health care provider will draw your blood the next morning at 8 a.m. for a cortisol measurement.
  • High-dose overnight — The provider will measure your cortisol on the morning of the test. Then you will receive 8 mg of dexamethasone at 11 p.m. Your blood is drawn the next morning at 8 a.m. for a cortisol measurement.

Rare:

  • Standard low-dose — Urine is collected over 3 days (stored in 24-hour collection containers) to measure cortisol. On day 2, you will get a low dose (0.5 mg) of dexamethasone by mouth every 6 hours for 48 hours.
  • Standard high-dose — Urine is collected over 3 days (stored in 24-hour collection containers) for measurement of cortisol. On day 2, you will receive a high dose (2 mg) of dexamethasone by mouth every 6 hours for 48 hours.

Read and follow the instructions carefully. The most common cause of an abnormal test result is when instructions are not followed.

How to prepare for the  dexamethasone test

The provider may tell you to stop taking certain medicines that can affect the test, including:

  • Antibiotics
  • Anti-seizure drugs
  • Medicines that contain corticosteroids, such as hydrocortisone, prednisone
  • Estrogen
  • Oral birth control (contraceptives)
  • Water pills (diuretics)

How the  dexamethasone test will feel

When the needle is inserted to draw blood, some people feel moderate pain. Others feel only a prick or stinging. Afterward, there may be some throbbing or slight bruising. This soon goes away.

Why the  dexamethasone test is performed

This test is done when the provider suspects that your body is producing too much cortisol. It is done to help diagnose Cushing syndrome and identify the cause.

The low-dose test can help tell whether your body is producing too much ACTH. The high-dose test can help determine whether the problem is in the pituitary gland (Cushing disease).

Dexamethasone is a man-made (synthetic) steroid that is similar to cortisol. It reduces ACTH release in normal people. Therefore, taking dexamethasone should reduce ACTH level and lead to a decreased cortisol level.

If your pituitary gland produces too much ACTH, you will have an abnormal response to the low-dose test. But you can have a normal response to the high-dose test.

Normal Results

Cortisol level should decrease after you receive dexamethasone.

Low dose:

  • Overnight — 8 a.m. plasma cortisol lower than 1.8 micrograms per deciliter (mcg/dL) or 50 nanomoles per liter (nmol/L)
  • Standard — Urinary free cortisol on day 3 lower than 10 micrograms per day (mcg/day) or 280 nmol/L

High dose:

  • Overnight — greater than 50% reduction in plasma cortisol
  • Standard — greater than 90% reduction in urinary free cortisol

Normal value ranges may vary slightly among different laboratories. Some labs use different measurements or may test different specimens. Talk to your doctor about the meaning of your specific test results.

What Abnormal Results Mean

An abnormal response to the low-dose test may mean that you have abnormal release of cortisol (Cushing syndrome). This could be due to:

  • Adrenal tumor that produces cortisol
  • Pituitary tumor that produces ACTH
  • Tumor in the body that produces ACTH (ectopic Cushing syndrome)

The high-dose test can help tell a pituitary cause (Cushing disease) from other causes. An ACTH blood test may also help identify the cause of high cortisol.

Abnormal results vary based on the condition causing the problem.

Cushing syndrome caused by an adrenal tumor:

  • Low-dose test — no decrease in blood cortisol
  • ACTH level — low
  • In most cases, the high-dose test is not needed

Ectopic Cushing syndrome:

  • Low-dose test — no decrease in blood cortisol
  • ACTH level — high
  • High-dose test — no decrease in blood cortisol

Cushing syndrome caused by a pituitary tumor (Cushing disease)

  • Low-dose test — no decrease in blood cortisol
  • High-dose test — expected decrease in blood cortisol

False test results can occur due to many reasons, including different medicines, obesity, depression, and stress.

Risks of Dexamethasone suppression test

Veins and arteries vary in size from one patient to another, and from one side of the body to the other. Obtaining a blood sample from some people may be more difficult than from others.

Other risks associated with having blood drawn are slight, but may include:

  • Excessive bleeding
  • Fainting or feeling lightheaded
  • Hematoma (blood accumulating under the skin)
  • Infection (a slight risk any time the skin is broken).

Testing for Insufficient Cortisol Production

If a health practitioner suspects that the adrenal glands may not be producing adequate cortisol or if the initial blood tests indicate insufficient cortisol production, the health practitioner may order an ACTH stimulation test.

ACTH stimulation: This test involves measuring the level of cortisol in a person’s blood before and after an injection of synthetic ACTH. If the adrenal glands are functioning normally, then cortisol levels will rise with the ACTH stimulation. If they are damaged or not functioning properly, then the cortisol level will be low. A longer version of this test (1-3 days) may be performed to help distinguish between adrenal and pituitary insufficiency.

Cortisol levels

The level of cortisol in the blood (as well as the urine and saliva) normally rises and falls in a “diurnal variation” pattern. Cortisol peaks early in the morning, then declines throughout the day, reaching its lowest level about midnight. Though this pattern can change when a person works irregular shifts (such as the night shift) and sleeps at different times of the day, and it can become disrupted when a disease or condition either limits or stimulates cortisol production.

An increased or normal cortisol level just after waking along with a level that does not drop by bedtime suggests excess cortisol and Cushing syndrome. If this excess cortisol is not suppressed after an overnight dexamethasone suppression test, or if the 24-hour urine cortisol is elevated, or if the late-night salivary cortisol level is elevated, it suggests that the excess cortisol is due to abnormal increased ACTH production by the pituitary or a tumor outside of the pituitary or abnormal production by the adrenal glands. Additional testing will help to determine the exact cause.

If insufficient cortisol is present and the person tested responds to an ACTH stimulation test, then the problem is likely due to insufficient ACTH production by the pituitary. If the person does not respond to the ACTH stimulation test, then it is more likely that the problem is based in the adrenal glands. If the adrenal glands are underactive, due to pituitary dysfunction and/or insufficient ACTH production, then the person is said to have secondary adrenal insufficiency. If decreased cortisol production is due to adrenal damage, then the person is said to have primary adrenal insufficiency or Addison disease.

Once an abnormality has been identified and associated with the pituitary gland, adrenal glands, or other cause, then the health practitioner may use other testing such as CT (computerized tomography) or MRI (magnetic resonance imaging) scans to locate the source of the excess (such as a pituitary, adrenal, or other tumor) and to evaluate the extent of any damage to the glands.

Figure 7. Cortisol levels

cortisol levels

Footnotes: Circadian rhythm of cortisol in 33 individuals with 20-minute cortisol profiling. Peak cortisol levels are reached at around 08:30 and nadir cortisol levels at around midnight. The peaks of cortisol at noon and around 18:00 represent meal-induced cortisol stimulation.

[Source 1)]

Cortisol production rate

A number of cortisol secretory episodes occur during the 24 hour of the day making it possible to describe four different unequal temporal phases. These phases are represented by a period of minimal secretory activity, during which cortisol secretion is negligible, and occurs 4 hours prior to and 2 hours after sleep onset, a preliminary nocturnal secretory episode at the third through fifth hours of sleep, a main secretory phase of a series of three to five episodes occurring during the sixth to eighth hours of sleep and continuing through the first hour of wakefulness and an intermittent waking secretory activity of four to nine secretory episodes found in the 2–12-hour waking period 2). Advances in the measurement of the total amount of cortisol produced in a day shows that this is around 5.7–7.4 mg/m²/day or 9.5–9.9 mg/day 3) which is much less than previous estimates. Cortisol production rates in children and adolescents are very similar. These findings support regimes with lower oral daily hydrocortisone doses of 15–25 mg 4).

The regulation of cortisol release, is critically determined by the activity of the hypothalamic pituitary axis. The hypothalamic pituitary axis receives input from the central pacemaker which controls the circadian release of corticotrophin-releasing hormone (CRH) in the paraventricular nucleus, this also stimulated by physical and emotional stressors. CRH in turn stimulates release of adrenocorticotrophic hormones (ACTH) from the corticotroph cells in the anterior pituitary, and thence the glucocorticoid cortisol from the adrenal cortex. In turn, cortisol exerts inhibitory effects at pituitary and hypothalamic levels, in a classical negative feedback loop although there is no feedback on the hypothalamic suprachiasmatic nuclei 5).

The adrenal gland contains a circadian clock that sets specific time intervals during which the adrenal most effectively responds to ACTH. This is regulated via the splanchnic nerve 6). Clock genes are expressed rhythmically in the zona glomerulosa and zona fasciculata, and entire pathways characteristic for the adrenal gland, such as steroid metabolism or catecholamine production, are transcriptionally regulated by the circadian clock 7). Expression of clock genes in the adrenal gland shows a 6-hour phase delay relative to the hypothalamic suprachiasmatic nuclei which is mainly induced via the hypothalamic suprachiasmatic nuclei—sympathetic nervous system without accompanying activation of the hypothalamic pituitary axis axis 8). This gene expression accompanies the rhythmic secretion of plasma and brain cortisol.

Normal cortisol levels

Adults have slightly higher cortisol levels than children do.

Normal blood cortisol levels

Normal values for a blood sample taken at 8 in the morning are 5 to 25 mcg/dL or 140 to 690 nmol/L.

Normal values depend on the time of day and the clinical context. Normal ranges may vary slightly among different laboratories. Some labs use different measurements or may test different specimens. Talk to your doctor about the meaning of your specific test results.

What does abnormal cortisol levels mean?

A higher than normal level may indicate:

  • Cushing disease, in which the pituitary gland makes too much ACTH because of excess growth of the pituitary gland or a tumor in the pituitary gland
  • Ectopic Cushing syndrome, in which a tumor outside the pituitary or adrenal glands makes too much ACTH
  • Tumor of the adrenal gland that is producing too much cortisol

A lower than normal cortisol level may indicate:

  • Addison disease, in which the adrenal glands do not produce enough cortisol
  • Hypopituitarism, in which the pituitary gland does not signal the adrenal gland to produce enough cortisol
  • Suppression of normal pituitary or adrenal function by glucocorticoid medicines including pills, skin creams, eyedrops, inhalers, joint injections, chemotherapy

Normal urine levels

Normal range is 4 to 40 mcg/24 hours or 11 to 110 nmol/day.

Normal value ranges may vary slightly among different laboratories. Some labs use different measurements or may test different specimens. Talk to your provider about the meaning of your specific test results.

What does abnormal cortisol levels mean?

A higher than normal urine cortisol level may indicate:

  • Cushing disease, in which the pituitary gland makes too much ACTH because of excess growth of the pituitary gland or a tumor in the pituitary gland
  • Ectopic Cushing syndrome, in which a tumor outside the pituitary or adrenal glands makes too much ACTH
  • Severe depression
  • Tumor of the adrenal gland that is producing too much cortisol
  • Severe stress
  • Rare genetic disorders

A lower than normal level may indicate:

  • Addison disease in which the adrenal glands do not produce enough cortisol
  • Hypopituitarism in which the pituitary gland does not signal the adrenal gland to produce enough cortisol
  • Suppression of normal pituitary or adrenal function by glucocorticoid medicines including pills, skin creams, eyedrops, inhalers, joint injections, chemotherapy.

High cortisol levels

The group of signs and symptoms that are seen with an abnormally high level of cortisol is called Cushing syndrome. Increased cortisol production may be seen with:

  • Administration of large amounts of glucocorticosteroid hormones (such as prednisone, prednisolone, or dexamethasone) to treat a variety of conditions, such as autoimmune disease and some tumors
  • ACTH-producing tumors, in the pituitary gland and/or in other parts of the body
  • Increased cortisol production by the adrenal glands, due to a tumor or due to excessive growth of adrenal tissues (hyperplasia)
  • Rarely, with tumors in various parts of the body that produce corticotropin-releasing hormone (CRH)
  • Heat, cold, infection, trauma, exercise, obesity, and debilitating disease can influence cortisol concentrations. Pregnancy, physical and emotional stress, and illness can increase cortisol levels. Cortisol levels may also increase as a result of hyperthyroidism or obesity. A number of drugs can also increase levels, particularly oral contraceptives (birth control pills), hydrocortisone (the synthetic form of cortisol), and spironolactone.

What is Cushing syndrome

Cushing syndrome (also sometimes called Cushing’s syndrome) is a condition where your body is exposed to too much of the hormone cortisol. This can be because your body is making too much cortisol, or because you have taken a lot of oral corticosteroid medicines. If you have Cushing’s syndrome, it is treatable. However Cushing’s syndrome can be serious if it’s not treated. The condition is named after Harvey Cushing, an eminent American neurosurgeon, who described the first patients with this condition in 1912.

Cortisol hormone has several important functions including:

  • Cortisol helps to regulate blood pressure
  • Cortisol helps to regulate the immune system
  • Cortisol helps to balance the effect of insulin to keep blood sugar normal by converting fat, carbohydrates, and proteins into energy
  • Cortisol helps the body to respond to stress

Cortisol is involved in many different parts of your body. It is produced all day, and especially during times of stress.

  • Some people with Cushing’s syndrome have a benign tumor in part of the brain. This tumor tells the adrenal glands to release cortisol. This condition is known as Cushing’s disease.
  • Other people develop Cushing’s syndrome from taking steroid medication for a long time. If you have Cushing’s syndrome as a result of taking steroid medication, do not stop taking it suddenly, as you could become very unwell. Talk to your doctor.
  • Cushing’s syndrome can also be caused by a tumor of the adrenal gland, overgrowth of the adrenal glands, or occasionally a tumor somewhere else in the body.

Cushing’s syndrome is uncommon. It mostly affects people who have been taking steroid medicine, especially steroid tablets, for a long time. Steroids contain a man-made version of cortisol. For example taking a steroid such as prednisolone for asthma, arthritis or colitis.

Very rarely, it can be caused by the body producing too much cortisol. This is usually due to:

  • a growth (tumor) in the pituitary gland in the brain
  • a tumor in one of the adrenal glands above the kidneys

Strictly speaking, if the source of the problem is the pituitary gland, then the correct name is Cushing’s Disease.

The tumors are usually non-cancerous (benign). Far more women than men suffer from Cushing’s syndrome but it isn’t known why; it is most commonly diagnosed between the ages of 30 to 40. Although it is rare in children, some as young as 6 have been diagnosed. There are no environmental triggers known and it’s not hereditary.

Spontaneous Cushing’s syndrome, originating from within the body is rare, but occurs when the adrenal glands are making too much of a hormone called cortisol (the body’s natural glucocorticoid steroid hormone). The quoted incidence of Cushing’s syndrome is 1 in 200,000 but it is now being found more frequently when it is specifically investigated. The difficulty is that the symptoms of Cushing’s syndrome can be very wide ranging and thus the diagnosis may not necessarily be considered; it can be difficult to establish, at the earlier stages and this can cause a delay in diagnosis.

The commonest cause of spontaneous Cushing’s syndrome (around 70%) is a small benign tumor (growth) of the pituitary gland (a small gland at the base of the brain, behind the bridge of the nose). This produces the hormone called ACTH, (adrenocorticotrophic hormone), that goes through the blood stream to the adrenal glands and causes them to release too much cortisol. In this case there is a good chance that an operation on your pituitary gland will solve the problem. Alternatively, there could be a small growth in another part of your body which is having the same effect (this is called ectopic ACTH). If so, removing this growth will usually solve the problem. Lastly, there may be a small growth in one of the adrenal glands themselves, in which case an operation will be needed to remove that gland. In some circumstances it may be necessary to remove both adrenal glands to solve the problem.

Cushing syndrome causes

There are two types of Cushing syndrome:

  • Exogenous (caused by factors outside the body) and
  • Endogenous (caused by factors within the body).

The symptoms for both are the same. The only difference is how they are caused.

The most common is exogenous Cushing syndrome and is found in people taking cortisol-like medications such as prednisone. These drugs are used to treat inflammatory disorders such as asthma and rheumatoid arthritis. They also suppress the immune system after an organ transplant. This type of Cushing is temporary and goes away after the patient has finished taking the cortisol-like medications.

Endogenous Cushing syndrome, in which the adrenal glands produce too much cortisol, is uncommon. It usually comes on slowly and can be difficult to diagnose. This type of Cushing syndrome is most often caused by hormone-secreting tumors of the adrenal glands or the pituitary, a gland located at the base of the brain. In the adrenal glands, the tumor (usually non-cancerous) produces too much cortisol. In the pituitary, the tumor produces too much ACTH—the hormone that tells the adrenal glands to make cortisol. When the tumors form in the pituitary, the condition is often called Cushing disease.

Most tumors that produce ACTH originate in the pituitary but sometimes non-pituitary tumors, usually in the lungs, can also produce too much ACTH and cause Cushing syndrome.

Figure 8. Signs and symptoms of Cushing’s syndrome

cushing syndrome

High cortisol symptoms

Symptoms of Cushing’s syndrome include:

  • Obesity, especially in the torso
  • High blood pressure
  • High blood sugar
  • Purple streaks on the stomach
  • Skin that bruises easily
  • Muscle weakness
  • Women may have irregular menstrual periods and excess hair on the face

Symptoms of Cushing’s syndrome can start suddenly or gradually. They tend to get slowly worse if not treated.

One of the main signs is weight gain and more body fat, such as:

  • increased fat on your chest, shoulders and neck and tummy, but slim arms and legs
  • a build-up of fat on the back of your neck and shoulders – known as a “buffalo hump”
  • a red, puffy, rounded face

Other symptoms include:

  • skin that bruises easily
  • skin problems like slow healing of wounds
  • large purple stretch marks on the tummy, hips and thighs
  • weakness in your upper arms and thighs due to muscle loss
  • a low libido and fertility problems
  • irregular periods
  • feeling tired or emotional
  • depression and mood swings
  • brittle bones or thin bones (osteoporosis)
  • too much facial hair in women

Cushing’s syndrome can also cause high blood pressure (hypertension) and high blood sugar or diabetes, which can be serious if not treated.

Other symptoms include more hair on the face and body and a change in menstrual periods for women, and lower libido or erectile dysfunction for men.

Women with Cushing syndrome may experience:

  • Thicker or more visible body and facial hair (hirsutism)
  • Irregular or absent menstrual periods

Men with Cushing syndrome may experience:

  • Decreased libido
  • Decreased fertility
  • Erectile dysfunction

Other signs and symptoms include:

  • Severe fatigue
  • Depression, anxiety and irritability
  • Loss of emotional control
  • Cognitive difficulties
  • New or worsened high blood pressure
  • Headache
  • Bone loss, leading to fractures over time
  • In children, impaired growth

Cushing syndrome diagnosis

Cushing’s syndrome can be hard to diagnose because it can look like other things. Your doctor may suspect Cushing’s syndrome if you have typical symptoms and are taking steroid medicine.

If you’re not taking steroids, it can be difficult to diagnose because the symptoms can be similar to other conditions.

Your doctor will talk to you, examine you and may arrange a number of tests of your blood, urine and saliva.

If Cushing’s syndrome is suspected, the amount of cortisol in your body can be measured in your:

  • 24-hour urine cortisol
  • Dexamethasone suppression test (low dose)
  • Salivary cortisol levels (early morning and late at night).

Three tests are commonly used to diagnose Cushing syndrome. One of the most sensitive tests measures cortisol levels in the saliva between 11:00 p.m. and midnight. A sample of saliva is collected in a small plastic container and sent to the laboratory for analysis. In healthy people, cortisol levels are very low during this period of time. In contrast, people with Cushing syndrome have high levels.

Cortisol levels can also be measured in urine that has been collected over a 24-hour period.

In another screening test, people with suspected Cushing syndrome have their cortisol levels measured the morning after taking a late-night dose of dexamethasone, a laboratory-made steroid. Normally, dexamethasone causes cortisol to drop to a very low level, but in people with Cushing syndrome, this doesn’t happen.

If these tests show a high level of cortisol, you may be referred to a specialist in hormone conditions (endocrinologist) to confirm or rule out Cushing’s syndrome.

You may also need other tests or scans to find out the cause.

Other tests that may be done include any of the following:

  • Fasting blood glucose and A1C to test for diabetes
  • Lipid and cholesterol testing
  • Bone mineral density scan to check for osteoporosis
  • Blood ACTH level
  • Brain MRI
  • Corticotropin-releasing hormone test, which acts on the pituitary gland to cause the release of ACTH
  • Dexamethasone suppression test (high dose)
  • Inferior petrosal sinus sampling (IPSS) — measures ACTH levels in the veins that drain the pituitary gland compared to the veins in the chest. This test can help determine whether the cause of endogenous Cushing syndrome is rooted in the pituitary or somewhere else. For the test, blood samples are taken from the petrosal sinuses — veins that drain the pituitary glands.A thin tube is inserted into your upper thigh or groin area while you’re sedated, and threaded to the petrosal sinuses. Levels of ACTH are measured from the petrosal sinuses, and from a blood sample taken from the forearm.If ACTH is higher in the sinus sample, the problem stems from the pituitary. If the ACTH levels are similar between the sinus and forearm, the root of the problem lies outside of the pituitary gland.

How to lower cortisol

The treatment depends on the cause. Cushing’s syndrome usually gets better with treatment, although it might take a long time to recover completely. Remember to be patient. You didn’t develop Cushing syndrome overnight, and your symptoms won’t disappear overnight, either. In the meantime, these tips may help you on your journey back to health.

Treatment depends on what’s causing it.

If Cushing syndrome is caused by taking steroids:

  • If you are taking steroids, then you and your doctor will need to talk about whether it is possible to reduce the dose or not. Your steroid dose will probably be gradually reduced or stopped

Exogenous Cushing syndrome goes away after a patient stops taking the cortisol-like medications they were using to treat another condition. Your doctor will determine when it is appropriate for you to slowly decrease and eventually stop using the medication.

If Cushing syndrome is caused by a tumor, treatment may include:

  • surgery to remove the tumor
  • radiotherapy to destroy the tumor
  • medicines to reduce the effect of cortisol on your body

For endogenous Cushing syndrome, the initial approach is almost always surgery to remove the tumor that is causing high cortisol levels. Although surgery is usually successful, some people may also need medications that lower cortisol or radiation therapy to destroy remaining tumor cells. Some people must have both adrenal glands removed to control Cushing syndrome.

If there are other reasons as to why you have Cushing’s syndrome, then you may be advised to have treatment such as surgery, radiotherapy, chemotherapy or other medication to stop your body taking too much cortisol.

Speak to your doctor about the benefits and risks of the different treatment options.

Cushing syndrome diet

Nutritious, wholesome foods provide a good source of fuel for your recovering body and can help you lose the extra pounds that you gained from Cushing syndrome. Make sure you’re getting enough calcium and vitamin D. Taken together, they help your body absorb calcium, which can help strengthen your bones, counteracting the bone density loss that often occurs with Cushing syndrome.

Home remedies

  • Increase activities slowly. You may be in such a hurry to get your old self back that you push yourself too hard too fast, but your weakened muscles need a slower approach. Work up to a reasonable level of exercise or activity that feels comfortable without overdoing it. You’ll improve little by little, and your persistence will be rewarded.
  • Monitor your mental health. Depression can be a side effect of Cushing syndrome, but it can also persist or develop after treatment begins. Don’t ignore your depression or wait it out. Seek help promptly from your doctor or a therapist if you’re depressed, overwhelmed or having difficulty coping during your recovery.
  • Gently soothe aches and pains. Hot baths, massages and low-impact exercises, such as water aerobics and tai chi, can help alleviate some of the muscle and joint pain that accompanies Cushing syndrome recovery.

Coping and support

Support groups can be valuable in dealing with Cushing syndrome and recovery. They bring you together with other people who are coping with the same kinds of challenges, along with their families and friends, and offer a setting in which you can share common problems.

Ask your doctor about support groups in your community. Your local health department, public library and telephone book as well as the Internet also may be good sources to find a support group in your area.

Low cortisol levels

Decreased cortisol production may be seen with:

  • An underactive pituitary gland or a pituitary gland tumor that inhibits ACTH production; this is known as secondary adrenal insufficiency.
  • Underactive or damaged adrenal glands (adrenal insufficiency) that limit cortisol production; this is referred to as primary adrenal insufficiency and is also known as Addison disease.
  • After stopping treatment with glucocorticosteroid hormones, especially if stopped very quickly after a long period of use
  • Similar to those with adrenal insufficiency, people with a condition called congenital adrenal hyperplasia (CAH) have low cortisol levels and do not respond to ACTH stimulation tests. Cortisol measurement is one of many tests that may be used to help evaluate a person for congenital adrenal hyperplasia (CAH).
  • Hypothyroidism may decrease cortisol levels. Drugs that may decrease levels include some steroid hormones.

What is Addison’s disease

Addison’s disease is a rare endocrine disorder that occurs when the adrenal glands do not produce enough of their hormones – cortisol (a “stress” hormone) and aldosterone and androgens (the other hormones made by the adrenal glands) 9). Addison’s disease can be caused by damage to the adrenal glands, autoimmune conditions, and certain genetic conditions. Some of the symptoms include changes in blood pressure, chronic diarrhea, darkening of the skin, paleness, extreme weakness, fatigue, nausea and vomiting, salt craving, and weight loss. Treatment with replacement corticosteroids usually controls the symptoms.

Addison’s disease, the common term for primary adrenal insufficiency, occurs when the adrenal glands are damaged and cannot produce enough of the adrenal hormone cortisol. The adrenal hormone aldosterone and androgens may also be lacking. Addison’s disease is seen in all age groups and affects male and female equally. Addison’s disease affects 110 to 144 of every 1 million people in developed countries 10).

This disease is named after Thomas Addison, who first described patients affected by this disorder in 1855, in the book titled “On the constitutional and local effects of the disease of supra renal capsule” 11). Addison’s disease can present as a life-threatening crisis, because it is frequently unrecognized in its early stages. The basis of Addison’s disease has dramatically changed from an infectious cause to autoimmune pathology since its initial description. However, tuberculosis is still the predominant cause of Addison’s disease in developing countries 12).

Addison’s disease causes

Addison’s disease results when your adrenal glands are damaged, producing insufficient amounts of the hormone cortisol and often aldosterone as well. These glands are located just above your kidneys.

The failure of your adrenal glands to produce adrenocortical hormones is most commonly the result of the body attacking itself (autoimmune disease). An auto-immune disorder in which the body’s immune system makes antibodies which attack the cells of the adrenal cortex and slowly destroys them. This can take months to years. For unknown reasons, your immune system views the adrenal cortex as foreign, something to attack and destroy.

Other causes of adrenal gland failure may include:

  • Tuberculosis. Tuberculosis was the leading cause of Addison disease up until the middle of the 20th century, when antibiotics were introduced that successfully treated tuberculosis.
  • Infections (bacterial, fungal, tuberculosis) of the adrenal glands e.g. CMV virus
  • Cancer that spreads to the adrenal glands
  • Surgical removal of the adrenal glands
  • Amyloidosis—protein build up in organs (very rare)
  • Bleeding into the adrenal glands, which may present as adrenal crisis without any preceding symptoms.

Primary Adrenal Insufficiency: Addison’s Disease

The outer layer of the adrenal glands is called the adrenal cortex. If the cortex is damaged, it may not be able to produce enough cortisol.

A common cause of primary adrenal insufficiency is an autoimmune disease that causes the immune system to attack healthy tissues. In the case of Addison’s disease, the immune system turns against the adrenal gland(s). There are some very rare syndromes (several diseases that occur together) that can cause autoimmune adrenal insufficiency.

Autoimmune Disorders

Up to 80 percent of Addison’s disease cases are caused by an autoimmune disorder, which is when the body’s immune system attacks the body’s own cells and organs 13). In autoimmune Addison’s, which mainly occurs in middle-aged females, the immune system gradually destroys the adrenal cortex—the outer layer of the adrenal glands 14).

Primary adrenal insufficiency occurs when at least 90 percent of the adrenal cortex has been destroyed 15). As a result, both cortisol and aldosterone are often lacking. Sometimes only the adrenal glands are affected. Sometimes other endocrine glands are affected as well, as in polyendocrine deficiency syndrome.

Autoimmune Polyendocrine Syndrome

Autoimmune polyendocrine syndrome is a rare cause of Addison’s disease. Sometimes referred to as multiple endocrine deficiency syndrome, polyendocrine deficiency syndrome is classified into type 1 and type 2.

Autoimmune polyendocrine syndrome type 1

Type 1 is inherited and occurs in children. Symptoms start during childhood. Almost any organ can be affected by autoimmune damage. Fortunately it is extremely rare—only several hundred cases have been reported worldwide. Conditions associated with autoimmune polyendocrine syndrome type 1 include:

In addition to adrenal insufficiency, these children may have:

  • Underactive parathyroid glands, which are four pea-sized glands located on or near the thyroid gland in the neck; they produce a hormone that helps maintain the correct balance of calcium in the body.
  • Delayed or slow sexual development.
  • Vitamin B12 malabsorption / deficiency (pernicious anemia), a severe type of anemia; anemia is a condition in which red blood cells are fewer than normal, which means less oxygen is carried to the body’s cells. With most types of anemia, red blood cells are smaller than normal; however, in pernicious anemia, the cells are bigger than normal.
  • Candidiasis (chronic yeast infection).
  • Chronic hepatitis, a liver disease.

Autoimmune polyendocrine syndrome Type 2

Researchers think type 2, which is sometimes called Schmidt’s syndrome, is also inherited. Type 2 usually affects young adults, symptoms primarily develop in adults aged 18 to 30 and may include:

  • Addison’s disease
  • Underactive or overactive thyroid function
  • Delayed or slow sexual development
  • Diabetes, in which a person has high blood glucose, also called high blood sugar or hyperglycemia
  • White skin patches, a loss of pigment on areas of the skin (vitiligo)
  • Celiac disease.

Secondary adrenal insufficiency

Adrenal insufficiency can also occur if your pituitary gland is diseased. The pituitary gland makes a hormone called adrenocorticotropic hormone (ACTH), which stimulates the adrenal cortex to produce its hormones. Inadequate production of adrenocorticotropic hormone (ACTH) can lead to insufficient production of hormones normally produced by your adrenal glands, even though your adrenal glands aren’t damaged. Doctors call this condition secondary adrenal insufficiency.

Another more common cause of secondary adrenal insufficiency occurs when people who take corticosteroids for treatment of chronic conditions, such as asthma or arthritis, abruptly stop taking the corticosteroids.

Stoppage of Corticosteroid Medication

A temporary form of secondary adrenal insufficiency may occur when a person who has been taking a synthetic glucocorticoid hormone, called a corticosteroid, for a long time stops taking the medication. Corticosteroids are often prescribed to treat inflammatory illnesses such as rheumatoid arthritis, asthma, and ulcerative colitis. In this case, the prescription doses often cause higher levels than those normally achieved by the glucocorticoid hormones created by the body. When a person takes corticosteroids for prolonged periods, the adrenal glands produce less of their natural hormones. Once the prescription doses of corticosteroid are stopped, the adrenal glands may be slow to restart their production of the body’s glucocorticoids. To give the adrenal glands time to regain function and prevent adrenal insufficiency, prescription corticosteroid doses should be reduced gradually over a period of weeks or even months. Even with gradual reduction, the adrenal glands might not begin to function normally for some time, so a person who has recently stopped taking prescription corticosteroids should be watched carefully for symptoms of secondary adrenal insufficiency.

Surgical Removal of Pituitary Tumors

Another cause of secondary adrenal insufficiency is surgical removal of the usually noncancerous, ACTH-producing tumors of the pituitary gland that cause Cushing’s syndrome. Cushing’s syndrome is a hormonal disorder caused by prolonged exposure of the body’s tissues to high levels of the hormone cortisol. When the tumors are removed, the source of extra ACTH is suddenly gone and a replacement hormone must be taken until the body’s adrenal glands are able to resume their normal production of cortisol. The adrenal glands might not begin to function normally for some time, so a person who has had an ACTH-producing tumor removed and is going off of his or her prescription corticosteroid replacement hormone should be watched carefully for symptoms of adrenal insufficiency.

Changes in the Pituitary Gland

Less commonly, secondary adrenal insufficiency occurs when the pituitary gland either decreases in size or stops producing ACTH. These events can result from

  • tumors or an infection in the pituitary
  • loss of blood flow to the pituitary
  • radiation for the treatment of pituitary or nearby tumors
  • surgical removal of parts of the hypothalamus
  • surgical removal of the pituitary

Infections

Tuberculosis (TB), an infection that can destroy the adrenal glands, accounts for 10 to 15 percent of Addison’s disease cases in developed countries.1 When primary adrenal insufficiency was first identified by Dr. Thomas Addison in 1849, TB was the most common cause of the disease. As TB treatment improved, the incidence of Addison’s disease due to TB of the adrenal glands greatly decreased. However, recent reports show an increase in Addison’s disease from infections such as TB and cytomegalovirus. Cytomegalovirus is a common virus that does not cause symptoms in healthy people; however, it does affect babies in the womb and people who have a weakened immune system—mostly due to HIV/AIDS. Other bacterial infections, such as Neisseria meningitidis, which is a cause of meningitis, and fungal infections can also lead to Addison’s disease.

Other Causes

Less common causes of Addison’s disease are:

  • cancer cells in the adrenal glands
  • amyloidosis, a serious, though rare, group of diseases that occurs when abnormal proteins, called amyloids, build up in the blood and are deposited in tissues and organs
  • surgical removal of the adrenal glands
  • bleeding into the adrenal glands
  • genetic defects including abnormal adrenal gland development, an inability of the adrenal glands to respond to ACTH, or a defect in adrenal hormone production
  • medication-related causes, such as from anti-fungal medications and the anesthetic etomidate, which may be used when a person undergoes an emergency
  • intubation—the placement of a flexible, plastic tube through the mouth and into the trachea, or windpipe, to assist with breathing.

Low cortisol symptoms

Addison’s disease symptoms usually develop slowly, often over several months, and may include:

  • Extreme fatigue, chronic, or long lasting, fatigue
  • Weight loss
  • Loss of appetite or decreased appetite
  • Darkening of your skin (hyperpigmentation)
  • Low blood pressure that drops further when a person stands up, causing dizziness or fainting
  • Salt craving
  • Low blood sugar (hypoglycemia)
  • Nausea, diarrhea or vomiting
  • Abdominal pain
  • Muscle or joint pains
  • Muscle weakness
  • Irritability
  • Depression
  • Body hair loss or sexual dysfunction in women
  • Headache
  • Sweating
  • Irregular or absent menstrual periods
  • In women, loss of interest in sex.

Hyperpigmentation, or darkening of the skin, can occur in Addison’s disease. This darkening is most visible on scars; skin folds; pressure points such as the elbows, knees, knuckles, and toes; lips; and mucous membranes such as the lining of the cheek.

The slowly progressing symptoms of adrenal insufficiency are often ignored until a stressful event, such as surgery, a severe injury, an illness, or pregnancy, causes them to worsen.

Figure 9. Hyperpigmentation in the hand

addisons disease hyperpigmentation

Figure 10. Hyperpigmentation in the mouth

addisons disease hyperpigmentation

Figure 11. Hyperpigmentation in the mouth

addisons disease hyperpigmentation

Addison’s disease treatment

All treatment for Addison’s disease involves hormone replacement therapy to correct the levels of steroid hormones your body isn’t producing.

The dose of each medication is adjusted to meet the needs of the patient.

During adrenal crisis, low blood pressure, low blood glucose, low blood sodium, and high blood levels of potassium can be life threatening. Standard therapy involves immediate IV injections of corticosteroids and large volumes of IV saline solution with dextrose, a type of sugar. This treatment usually brings rapid improvement. When the patient can take liquids and medications by mouth, the amount of corticosteroids is decreased until a dose that maintains normal hormone levels is reached. If aldosterone is deficient, the person will need to regularly take oral doses of fludrocortisone acetate.

Researchers have found that using replacement therapy for DHEA in adolescent girls who have secondary adrenal insufficiency and low levels of DHEA can improve pubic hair development and psychological stress. Further studies are needed before routine supplementation recommendations can be made.

Some options for treatment include:

  • Oral corticosteroids. Hydrocortisone (Cortef), prednisone or cortisone acetate may be used to replace cortisol. Your doctor may prescribe fludrocortisone to replace aldosterone.
  • Corticosteroid injections. If you’re ill with vomiting and can’t retain oral medications, injections may be needed.

Cortisol is replaced with a corticosteroid, such as hydrocortisone, prednisone, or dexamethasone, taken orally one to three times each day, depending on which medication is chosen.

If aldosterone is also deficient, it is replaced with oral doses of a mineralocorticoid hormone, called fludrocortisone acetate (Florinef), taken once or twice daily. People with secondary adrenal insufficiency normally maintain aldosterone production, so they do not require aldosterone replacement therapy.

An ample amount of sodium is recommended, especially during heavy exercise, when the weather is hot or if you have gastrointestinal upsets, such as diarrhea. Your doctor will also suggest a temporary increase in your dosage if you’re facing a stressful situation, such as an operation, an infection or a minor illness.

Addison’s disease diet

Some people with Addison’s disease who are aldosterone deficient can benefit from following a diet rich in sodium. A health care provider or a dietitian can give specific recommendations on appropriate sodium sources and daily sodium guidelines if necessary.

Corticosteroid treatment is linked to an increased risk of osteoporosis—a condition in which the bones become less dense and more likely to fracture. People who take corticosteroids should protect their bone health by consuming enough dietary calcium and vitamin D. A health care provider or a dietitian can give specific recommendations on appropriate daily calcium intake based upon age and suggest the best types of calcium supplements, if necessary.

Coping and support

These steps may help you cope better with a medical emergency if you have Addison’s disease:

  • Carry a medical alert card and bracelet at all times. In the event you’re incapacitated, emergency medical personnel know what kind of care you need.
  • Keep extra medication handy. Because missing even one day of therapy may be dangerous, it’s a good idea to keep a small supply of medication at work, at a vacation home and in your travel bag, in the event you forget to take your pills. Also, have your doctor prescribe a needle, syringe and injectable form of corticosteroids to have with you in case of an emergency.
  • Stay in contact with your doctor. Keep an ongoing relationship with your doctor to make sure that the doses of replacement hormones are adequate, but not excessive. If you’re having persistent problems with your medications, you may need adjustments in the doses or timing of the medications.

Acute adrenal failure (Addisonian crisis)

Sudden, severe worsening of adrenal insufficiency symptoms is called adrenal crisis. If the person has Addison’s disease, this worsening can also be called an Addisonian crisis. In most cases, symptoms of adrenal insufficiency become serious enough that people seek medical treatment before an adrenal crisis occurs. However, sometimes symptoms appear for the first time during an adrenal crisis.

In acute adrenal failure (Addisonian crisis), the signs and symptoms may also include:

  • Sudden, severe pain in your lower back, abdomen or legs
  • Severe vomiting and diarrhea, leading to dehydration
  • Low blood pressure
  • Loss of consciousness
  • High potassium (hyperkalemia) and low sodium (hyponatremia)

If not treated, an adrenal crisis can cause death.

Addisonian crisis is a life-threatening situation

Get Treatment for Adrenal Crisis Right Away – If not treated, an adrenal crisis can cause death.

Addisonian crisis requires immediate medical care. Treatment typically includes intravenous injections of:

  • Hydrocortisone
  • Saline solution
  • Sugar (dextrose)

How is adrenal crisis treated ?

Adrenal crisis is treated with adrenal hormones. People with adrenal crisis need immediate treatment. Any delay can cause death. When people with adrenal crisis are vomiting or unconscious and cannot take their medication, the hormones can be given as an injection.

A person with adrenal insufficiency should carry a corticosteroid injection at all times and make sure that others know how and when to administer the injection, in case the person becomes unconscious.

The dose of corticosteroid needed may vary with a person’s age or size. For example, a child younger than 2 years of age can receive 25 milligrams (mg), a child between 2 and 8 years of age can receive 50 mg, and a child older than 8 years should receive the adult dose of 100 mg.

How can a person prevent adrenal crisis?

The following steps can help a person prevent adrenal crisis:

  • Ask a health care provider about possibly having a shortage of adrenal hormones, if always feeling tired, weak, or losing weight.
  • Learn how to increase the dose of corticosteroid for adrenal insufficiency when ill. Ask a health care provider for written instructions for sick days. First discuss the decision to increase the dose with the health care provider when ill.
  • When very ill, especially if vomiting and not able to take pills, seek emergency medical care immediately.

How can someone with adrenal insufficiency prepare in case of an emergency?

People with adrenal insufficiency should always carry identification stating their condition, “adrenal insufficiency,” in case of an emergency. A card or medical alert tag should notify emergency health care providers of the need to inject corticosteroids if the person is found severely injured or unable to answer questions.

The card or tag should also include the name and telephone number of the person’s health care provider and the name and telephone number of a friend or family member to be notified. People with adrenal insufficiency should always carry a needle, a syringe, and an injectable form of corticosteroids for emergencies.

References   [ + ]

read more

Molybdenum

molybdenum

What is molybdenum

Molybdenum is a heavy metallic element found naturally throughout the environment and is also used by industries to manufacture a wide range of common products. Molybdenum is widely distributed in nature, the abundance in the earth‟s crust being about 1-1.5 mg molybdenum/kg 1). Molybdenum is ubiquitous in food and water as soluble molybdates (Mo(VI)O42-). Molybdenum is required as a component of enzymes involved in the catabolism of sulphur amino acids and heterocyclic compounds, as well as in the metabolism of aromatic aldehydes. Because of its role in metabolism, molybdenum is considered an essential dietary element for mammals, though clinical signs of dietary molybdenum deficiency in otherwise healthy humans have not been described 2). Molybdenum is a refractory metallic element used principally as an alloying agent in steel, cast iron, and superalloys to enhance hardenability, strength, toughness, and wear and corrosion resistance 3). To achieve desired metallurgical properties, molybdenum, primarily in the form of molybdic oxide or ferromolybdenum, is frequently used in combination with or added to chromium, manganese, niobium, nickel, tungsten, or other alloy metals. The versatility of molybdenum in enhancing a variety of alloy properties has ensured it a significant role in contemporary industrial technology, which increasingly requires materials that are serviceable under high stress, expanded temperature ranges, and highly corrosive environments. Moreover, molybdenum finds significant usage as a refractory metal in numerous chemical applications, including catalysts, lubricants, and pigments 4). There is little substitution for molybdenum in its major application in steels and cast irons. In fact, because of the availability and versatility of molybdenum, industry has sought to develop new materials that benefit from its alloying properties.

In humans, molybdenum is also an essential trace element, being a component of the enzymes xanthine oxidoreductase, sulphite oxidase, aldehyde oxidase, nitrate reductase and mitochondrial amidoxime reducing component require molybdenum linked with a pterin (molybdopterin) as the cofactor 5). These enzymes are involved in the metabolism of aromatic aldehydes and the catabolism of sulphur-containing amino acids and heterocyclic compounds, including purines, pyrimidines, pteridins and pyridines.

Molybdenum-containing enzymes catalyse redox reactions and are found in many plants and animal organisms. As a consequence of the easy interconvertibility of different oxidation states (Mo4+/Mo6+), molybdenum-containing enzymes have the ability to provide electron transfer pathways. In addition to molybdenum, they also contain other prosthetic groups such as flavin adenine dinucleotide or haeme 6).

Molybdenum cofactor is synthesized in the cytosol by a conserved biosynthetic pathway that can be divided into four main steps. In the final step of molybdenum cofactor biosynthesis, a single molybdenum ion is bound to one or two molybdopterin dithiolates. After completion of biosynthesis, mature molybdenum cofactor has to be inserted into molybdoenzymes. A molybdenum cofactor carrier protein has been described in the green alga Chlamydomonas rheinhardtii, but information is lacking for other eukaryotes 7). The formation of active molybdoenzymes depends not only on the availability of molybdenum but also on the presence of iron, zinc and copper 8).

The US Institute of Medicine 9) derived an average requirement based on a molybdenum balance study with four young males by Turnlund et al. 10). Average molybdenum balance was achieved with an intake of 22 μg/day, and no clinical signs of deficiency or biochemical changes associated with molybdenum deficiency were observed. The average minimum molybdenum requirement for maintaining adequate molybdenum status was estimated to be 22 μg/day, to which an additional 3 μg/day was added to allow for miscellaneous losses. In addition, it was assumed that molybdenum bioavailability from some diets may be lower than from the diet provided in the study. Thus, an average bioavailability of 75 % was used to set an Estimated Average Requirement (EAR) of 34 μg/day. Because of the use of only two different molybdenum intake levels and the small size of the study, US Institute of Medicine 11) used a coefficient of variation of 15 % and derived a Recommended Dietary Allowance (RDA) of 45 μg/day as the Estimated Average Requirement (EAR) plus twice the coefficient of variation to cover the needs of 97 to 98 % of the individuals in the group. As no data on which to base an Estimated Average Requirement (EAR) were found for women or older adults, the same values were given for these population groups 12).

Table 1. Molybdenum dietary reference values

molybdenum dietary reference values

Abbreviations: COMA = UK Committee on Medical Aspects of Food Policy; IOM = US Institute of Medicine; DACH = German-speaking countries

[Source 13)]

Table 2. Molybdenum adequate intake
molybdenum-adequate-intake

[Source 14)]

The Scientific Committee on Food has set a Tolerable Upper Intake Level (UL) based on adverse effects of molybdenum on reproduction, particularly fetal development, shown in studies with rats and mice, from which a No Observed Adverse Effect Level (NOAEL) of 0.9 mg/kg body weight per day was derived. Using an uncertainty factor of 100, a UL of 0.01 mg/kg body weight per day, equivalent to 0.6 mg/day, was derived for adults, including pregnant and lactating women. For children from one year of age onwards, the UL was extrapolated from the adult UL on a body weight basis, and was set at between 0.1 and 0.5 mg/day 15).

Molybdenum is relatively nontoxic, although high levels may be a cause of high uric acid levels and an increased incidence of gout. Liver toxicity from molybdenum has not been described 16). However,

Molybdenum foods

Molybdenum is present in nearly all foods in trace amounts as soluble molybdates.

Foods high in molybdenum are:

  • Pulses, cereal grains and grain products, offal (liver, kidney) and nuts
  • Organ meats, whole grains, green leafy vegetables, milk, beans

The molybdenum content in plant-based foods varies greatly and depends on the properties of the soil where the foods are grown; molybdenum uptake by plants is promoted by neutral or alkaline soils 17). Molybdenum concentrations in drinking water are usually below 10 μg/L, although concentrations as high as 200 μg/L have been reported in areas near mining sites 18). Currently, potassium molybdate (molybdenum VI) may be added to food supplements 19), whereas ammonium molybdate (molybdenum VI) and sodium molybdate (molybdenum VI) may be added to both foods8 and food supplements 20).

Cereals and cereal-based products including bread are the major food contributors to the dietary molybdenum intake of adults 21). Mean molybdenum intakes, as assessed in duplicate diet or food portion studies, total diet studies and market basket studies, vary over a wide range, i.e. 58 μg/day to 157 μg/day, for adults in various European countries. Mean intakes are at or above 100 μg/day in five of the eight European countries for which data are available. Molybdenum intakes of children are only available from two European countries.

Infant and follow-on formula: In a report on the essential requirements of infant and follow-on formulae, the SCF did not define a minimum or maximum content of molybdenum for either type of formulae 22). Compared to mature human milk, cow‟s milk has a higher molybdenum concentration [34 μg/kg as reported by Rose et al. 23), mean of 46 μg/kg as reported by Anses 24)]. Hence, the molybdenum content of cow’s milk based-infant formula is higher compared to mature human milk. For 81 powdered cow’s milk-based or soy-based infant formulae from the US and Canada, molybdenum concentrations ranged from 15.4 to 80.3 μg/L (mean ± SE, 37.7 ± 1.7 μg/L) 25).

Water-soluble molybdates are efficiently and rapidly absorbed from the digestive tract at a wide range of intakes, and the body is able to adapt to this wide intake range by regulating excretion via the urine. At doses up to about 1 mg, molybdenum dissolved in water is completely absorbed into the systemic circulation. Molybdenum absorption in the presence of solid foods (cress, green salad, tomatoes, bean soup) is lower compared to administration with water 26). When added to a beverage containing starch, dextrimaltose, oil, sucrose, α-cellulose and minerals, the absorption efficiency of increasing doses of molybdenum ranging from 24 to 1 378 μg was between 90 and 94 % in healthy men 27). Black tea has been shown to considerably reduce molybdenum absorption upon ingestion of relatively high amounts of molybdenum (0.5-1 mg as a single dose of stable isotope) 28). In ten premature infants, absorption of the stable isotope molybdenum from infant formula was 97.5 % (96.3-99.1 %) after receiving 25 μg molybdenum/kg body weight 29).

Studies using kale or soy intrinsically labeled with stable isotopes of molybdenum have shown that molybdenum absorption was 86.1 % and 56.7 %, respectively, from meals with either kale or soy casseroles containing about 100 μg molybdenum. Molybdenum absorption from an extrinsic label also added to the meals was 87.5 %. When the molybdenum content of the meal was increased to about 310 μg in a subsequent study, molybdenum absorption from soy amounted to 58.3 %, and molybdenum absorption from the extrinsic label was 92.8% 30).

Using a compartmental model based on a molybdenum depletion-repletion study in four men, the mean bioavailability of molybdenum from the experimental diet was predicted to be 76 % 31). A slightly higher bioavailability of 83 % for food-bound molybdenum was predicted with the compartmental model, based on a study which gave the same three-day rotating diet regimen but with five different molybdenum contents consecutively for 24 days each to four men 32).

Little is known about the mechanism of molybdenum absorption and the site of absorption in the gastrointestinal tract. In animals, molybdenum (VI) but not molybdenum (IV) is readily absorbed from the duodenum and proximal jejunum 33). Recently, a family of proteins probably related to molybdate transport in animals and humans has been described, though the exact location of this high-affinity transporter within the cell has not yet been identified 34). It is assumed that in addition to a possible high-affinity uptake system, molybdate may also enter the cell nonspecifically through the sulphate uptake system, which has been shown to be present in plants 35).

Tungsten is known to inhibit molybdenum uptake, and this inhibitory effect has been used in animal studies to induce molybdenum deficiency, but it is not considered relevant for humans because of the rare occurrence of tungsten in the environment and consequently in the food chain 36). In sheep and rats, high sulphate intakes have been shown to inhibit molybdenum absorption, suggesting that both sulphate and molybdenum share a common transport mechanism 37). An interaction with copper has been observed leading to copper deficiency in sheep exposed to high molybdenum intake. In ruminants, excessive intakes of molybdenum lead to formation of thiomolybdate in the sulphide-rich environment of the rumen; thiomolybdate (a molecule where sulphur groups surround a molybdenum centre) is a chelator of copper ions, thereby inhibiting copper absorption 38). By contrast, in humans, clinical symptoms of copper deficiency are largely confined to individuals with rare genetic defects in copper metabolism 39). In four adult males on two sorghum diets providing daily 2.4 mg of copper and 166 μg or 540 μg of molybdenum, respectively, fecal copper excretion was comparable and apparent copper absorption unaffected by molybdenum intake 40).

The highest molybdenum concentrations are found in the liver and kidney. In adults, the liver contains 1.3-2.9 mg molybdenum/kg dry matter, the kidney 1.6 mg/kg dry matter, the lung 0.15 mg/kg dry matter, the brain and muscle 0.14 mg/kg dry matter 41), and for hair concentrations of 0.03 mg/kg (Ochi et al., 2011) have been reported. Total body molybdenum of a “standard man” was calculated to be about 2.3 mg after analysis of tissues from 150 accidental deaths 42), and about 2.2 mg with the use of a compartmental model and fractional transfer coefficients observed at a molybdenum intake of 121 μg/day given for 24 days, and which was considered to be in line with the habitual molybdenum intake of participants prior to the study 43).

Storage of molybdenum in mammals is low, and most tissue molybdenum is thought to be associated with molybdoenzymes, as indicated by the reported absence of detectable molybdenum in the liver tissue of molybdenum cofactor-deficient patients 44). In the liver of fetuses (age: 23 weeks of gestation to term), molybdenum concentrations were more than seven-fold lower compared to adults 45), and such differences have subsequently been interpreted as the absence of molybdenum stores and a low fetal molybdenum requirement 46).

In order to fulfill its biological role, molybdenum must enter the cell and be assembled into a molybdenum cofactor. In eukaryotes, the molybdate transport process and the proteins involved are not fully understood 47).

There are no suitable biomarkers of molybdenum status. Biochemical changes observed in subjects with molybdopterin cofactor deficiency, a genetic disorder, or in the one subject reported with possible molybdenum deficiency, have not been observed in healthy individuals on varying levels of molybdenum intake. Low activity of molybdoenzymes in tissues, or changes in substrate/product relationships, are considered as insufficiently specific to be used as biomarkers of status.

In 1993, the Scientific Committee for Food did not publish Dietary Reference Values for molybdenum. More recently, other authorities have set Dietary Reference Values for molybdenum and these are based on the maintenance of molybdenum homeostasis as measured in balance studies, taking into account molybdenum bioavailability from various food sources, or are based on observed molybdenum intakes with a mixed diet.

Various balance studies have been performed to establish molybdenum requirements. However, only one balance study in adults was considered to be of sufficient duration, and was performed with a constant diet and under controlled conditions. In this study carried out in four men, balance was reported to be near zero from day 49 until day 102 of the depletion period when intakes were as low as 22 μg/day 48). Biochemical changes or symptoms suggestive of molybdenum deficiency were not observed and the possibility that humans may be able to achieve molybdenum balance at even lower intakes cannot be excluded 49). Results of two balance studies with some methodological limitations were reported in children, but these studies cannot be used to derive an average molybdenum requirement for children. Data on molybdenum intakes and health outcomes were unavailable for the setting of DRVs for molybdenum.

As the evidence to derive an Average Requirement and thus a Population Reference Intake, was considered insufficient, an Adequate Intake (AI) is proposed. An Adequate Intake (AI) of 65 μg/day is proposed for adult men and women based on mean molybdenum intakes at the lower end of the wide range of observed intakes from mixed diets in Europe 50). Given the scarcity of data on molybdenum intakes in pregnant and lactating women, it is suggested that the adult Adequate Intake (AI) also applies to pregnant and lactating women 51). For infants from seven months and children, it was decided that an Average Requirement could not be established, and an Adequate Intake (AI) is proposed based on extrapolation from the adult AI using isometric scaling and reference body weights of the respective age groups. The respective AIs vary between 10 μg/day in infants aged 7-11 months and 65 μg/day in adolescent boys and girls 52).

Molybdenum deficiency

Molybdenum is found in many foods and deficiencies are rare. Molybdenum deficiency has been described in animals and molybdenum deficiency in otherwise healthy humans has not been observed and there are no biomarkers of molybdenum status 53). Various metabolic balance studies have been performed to establish molybdenum requirements.

In humans, only a single case report of a syndrome suggestive of dietary molybdenum deficiency in a patient on total parenteral nutrition for several months has been reported 54). A 24-year-old male patient with Crohn’s disease and short bowel syndrome was on total parenteral nutrition (TPN) lacking in molybdenum for 12 months, at which point he developed a syndrome characterized by tachycardia, tachypnea, severe headache, nausea and vomiting, night blindness, and central scotomas, which progressed to edema, lethargy, disorientation and coma 55). These symptoms were associated with high plasma methionine and low serum uric acid concentrations, as well as reduced urinary concentrations of sulphate, thiosulphate, and uric acid. Whilst modification of the total parenteral nutrition solution by lowering the sulphur load was ineffective, treatment with ammonium molybdate (300 μg/day) resulted in considerable improvement of the clinical symptoms and progressive reversal of the biochemical abnormalities within 30 days 56). Clinical signs of molybdenum deficiency in otherwise healthy humans have not been observed 57).

A distinct molybdenum deficiency syndrome has not been observed in animals when subjected to molybdenum restriction, despite considerable reduction in the activity of molybdoenzymes.

Molybdenum cofactor deficiency 58), a rare autosomal recessive syndrome with a defective hepatic synthesis of molybdenum cofactor, results in deficiency of all molybdoenzymes in humans. This genetic defect, for which three subtypes are known according to the gene affected, has been found in a variety of ethnic groups and all over the world 59). Molybdenum cofactor deficiency is characterized by brain dysfunction (encephalopathy) that worsens over time and usually death at an early age 60). Babies with this condition appear normal at birth, but within a week they have feeding difficulties and develop seizures that do not improve with treatment (intractable seizures). Brain abnormalities, including deterioration (atrophy) of brain tissue, lead to severe developmental delay; affected individuals usually do not learn to sit unassisted or to speak. A small percentage of affected individuals have an exaggerated startle reaction (hyperekplexia) to unexpected stimuli such as loud noises. Other features of molybdenum cofactor deficiency can include a small head size (microcephaly) and facial features that are described as “coarse.” The successful treatment of one affected child with molybdenum cofactor deficiency type A using the first detectable intermediate substance in the biosynthesis pathway of molybdenum cofactor has recently been reported 61). In untreated patients, tests reveal that affected individuals have high levels of chemicals called sulfite, S-sulfocysteine, xanthine, and hypoxanthine in the urine and low levels of a chemical called uric acid in the blood. Because of the serious health problems caused by molybdenum cofactor deficiency, affected individuals usually do not survive past early childhood.

Acute molybdenum toxicity data

Animal data: No fatalities were reported among animals that ingested amounts of molybdenum disulfide in doses as great as 6,000 mg molybdenum/kg 62). No changes were observed in rats over a 4-week period following inhalation exposures to metallic molybdenum at 25,000 to 30,000 mg/m3 or to molybdenum dioxide at 10,000 to 12,000 mg/m3 for 1 hour 63).

Human data: Mining and metallurgy workers chronically exposed to 60 to 600 mg molybdenum/m3 reported an increased incidence of nonspecific symptoms that included weakness, fatigue, headache, anorexia, and joint and muscle pain 64).

Immediately Dangerous to Life or Health Concentrations: 5,000 mg molybdenum/m3

The available toxicological data contain no evidence that an acute exposure to a high concentration of insoluble molybdenum compounds would impede escape or cause any irreversible health effects within 30 minutes. However, the revised Immediately Dangerous to Life or Health Concentrations for insoluble molybdenum compounds is 5,000 mg Mo/m3 based on being 500 times the Occupational Safety and Health Administration permissible exposure limit (legal limit in the United States for exposure of an employee to a chemical substance) of 10 mg molybdenum/m3 (500 is an assigned protection factor for respirators and was used arbitrarily during the Standards Completion Program for deciding when the “most protective” respirators should be used for particulates).

References   [ + ]

read more

Is kimchi good for you?

kimchi

What is kimchi

Kimchi is a traditional fermented vegetable, a staple in Korean cuisine and is an indispensable side dish of every meal in Korea 1). Moreover, the annual tradition Gimjang involves preparing and storing a large quantity of kimchi for the winter season 2). There are about 187 kinds of Kimchi according to the ingredients and processing methods 3). Kimchi is prepared by various ingredients, such as Chinese cabbage (Brassica pekinensis Rupr.), processed with seasoning mixture mainly consisting of red pepper (Capsicum annuum L.) powder, garlic, ginger, edible Allium varieties other than garlic, and radish in the presence of salt. These ingredients may be chopped, sliced and broken into pieces 4). Kimchi is then fermented in brine before or after being packaged into appropriate containers to ensure the proper ripening and preservation of the product by lactic acid production at low temperatures. The drained weight of the final product, as a percentage of the indicated weight, should be not less than 80% by weight, calculated on the basis of the weight of distilled water at 20 °C which the sealed container will hold when completely filled. The drained weight of the final product as a percentage by the indicated weight shall not be less than 80% by weight. Kimchi is currently recognized worldwide as a nutritious and healthy food 5).

Traditional kimchi that is fermented naturally at low temperatures without any starter is a complex system, with dynamic biological and biochemical changes during fermentation 6). Because kimchi fermentation is accomplished by a succession of naturally occurring different lactic acid bacteria, fermentative metabolic features of microbial communities during kimchi fermentation process are different every time, which makes it difficult to consistently produce standardized kimchi with high quality 7). Until now, rational and systematic approaches to control kimchi fermentation for the production of kimchi with uniform quality have not been developed because the understanding of kimchi microbial communities during fermentation has not yet been accomplished 8). Therefore, comprehensive investigation on the fermentative metabolic features of kimchi lactic acid bacteria during fermentation is indispensable to control kimchi fermentation 9). With metatranscriptomic analysis, it is relatively easy to investigate the metabolic features of microbial communities in fermented foods such as kimchi, because these communities are not so complex as those in other natural environments. Therefore, a transcriptomic analysis was performed to examine the metabolic features of Leuconostoc mesenteroides during kimchi fermentation. Relative abundances (%) of mRNA sequencing reads mapped to the genomes of Leuconostoc mesenteroides strains for total lactic acid bacteria mRNA sequencing reads during the kimchi fermentation were calculated. The relative abundances were high at the early kimchi fermentation period and decreased to the lowest value at 18 days as the fermentation progressed, suggesting that members of Leuconostoc mesenteroides are more responsible for kimchi fermentation during the early fermentation period. The metabolic properties of Leuconostoc mesenteroides during kimchi fermentation were investigated by metabolic mapping of the Leuconostoc mesenteroides mRNA sequencing. The transcriptomic analysis showed that genes associated with carbohydrate metabolisms, nucleotide metabolism, fatty acid biosynthesis, oxidative phosphorylation, riboflavin metabolism, and glutamine and glutamate metabolism were highly expressed during kimchi fermentation 10). Genes associated with fatty acid biosynthesis, nucleotide metabolism, and amino acid metabolism, probably more related to cell growth, were up-regulated in Leuconostoc mesenteroides during the early kimchi fermentation period, which may explain why Leuconostoc mesenteroides is more abundant at that stage. Conversely, genes associated with oxidative phosphorylation, biosynthesis of other secondary metabolisms, and glutamine and glutamate metabolism were up-regulated during the late kimchi fermentation period 11). Genes associated with the biosynthesis of riboflavin were highly expressed during the entire kimchi fermentation, suggesting that Leuconostoc mesenteroides may be an important producer of riboflavin during the kimchi fermentation 12).

Leuconostoc mesenteroides (Leu. mesenteroides) comprises Gram-positive, catalase-negative, facultatively anaerobic, non-spore-forming, and spherical heterofermentative and mostly dextran-producing lactic acid bacteria (LAB), with coccus shapes and relatively low G + C contents 13). Leuconostoc mesenteroides members are reported to be mainly responsible for the fermentation of various vegetables, such as kimchi and sauerkraut (pickled cabbage), under low temperature and moderate salinity conditions, although some Leuconostoc mesenteroides strains have been isolated from dairy products such as cheese 14). In particular, Leuconostoc mesenteroides strains were found to be the major lactic acid bacteria, along with Lactobacillus sakei and Weissella koreensis, present during kimchi fermentation, suggesting that they are well adapted to kimchi fermentation conditions 15). Moreover, because Leuconostoc mesenteroides strains produce mannitol, a compound with antidiabetic and anticarcinogenic properties known for imparting a refreshing taste, and bacteriocins during fermentation and have some health improving effects 16), they have been considered as starter cultures for kimchi fermentation or potential probiotics in industries 17).

Although Leuconostoc mesenteroides strains are generally considered to be non-infectious agents in humans, there have been some clinical reports that Leuconostoc mesenteroides might be associated with certain human diseases such as brain abscess, endocarditis, nosocomial outbreaks, and central nervous system tuberculosis 18). In addition, there is a report that Leuconostoc mesenteroides can cause spoilage in some types of food products 19). These reports suggest that further studies on the physiological and fermentative properties of Leuconostoc mesenteroides strains are needed to vouch for the safety and quality of kimchi and sauerkraut products fermented with Leuconostoc mesenteroides 20).

Figure 1. Kimchi

kimchi

Kimchi nutrition

Nutritionally, Kimchi is a low-calorie food (15 kcal/100 g) and an important source of vitamins, minerals, and fiber 21). It is also a good source of phytochemicals (e.g., β-sitosterol, glucosinolates, isothiocyanate, indoles, allyl compounds) and probiotic strains (e.g., Lactobacillus plantarum, Lactobacillus brevis, Leuconostoc mesenteroides) 22). In regard to these nutrition properties, many functional properties of Kimchi have been reported including anti-oxidative activity 23), anti-mutagenic and anti-tumor activities 24), anti-atherogenic activity 25) and weight-controlling activity 26).

Table 1. Kimchi nutrition facts

NutrientUnitValue per 100 g
Approximates
Waterg94.3
Energykcal15
EnergykJ65
Proteing1.1
Total lipid (fat)g0.5
Ashg1.7
Carbohydrate, by differenceg2.4
Fiber, total dietaryg1.6
Sugars, totalg1.06
Minerals
Calcium, Camg33
Iron, Femg2.5
Magnesium, Mgmg14
Phosphorus, Pmg24
Potassium, Kmg151
Sodium, Namg498
Zinc, Znmg0.22
Copper, Cumg0.024
Selenium, Seµg0.5
Vitamins
Vitamin C, total ascorbic acidmg0
Thiaminmg0.01
Riboflavinmg0.21
Niacinmg1.1
Vitamin B-6mg0.213
Folate, totalµg52
Folic acidµg0
Folate, foodµg52
Folate, DFEµg52
Choline, totalmg15.5
Vitamin B-12µg0
Vitamin B-12, addedµg0
Vitamin A, RAEµg5
Retinolµg0
Carotene, betaµg55
Carotene, alphaµg1
Cryptoxanthin, betaµg0
Vitamin A, IUIU93
Lycopeneµg0
Lutein + zeaxanthinµg49
Vitamin E (alpha-tocopherol)mg0.11
Vitamin E, addedmg0
Vitamin D (D2 + D3)µg0
Vitamin DIU0
Vitamin K (phylloquinone)µg43.6
Lipids
Fatty acids, total saturatedg0.067
04:00:00g0
06:00:00g0
08:00:00g0
10:00:00g0
12:00:00g0.003
14:00:00g0.003
16:00:00g0.057
18:00:00g0.003
Fatty acids, total monounsaturatedg0.037
16:1 undifferentiatedg0
18:1 undifferentiatedg0.037
20:01:00g0
22:1 undifferentiatedg0
Fatty acids, total polyunsaturatedg0.241
18:2 undifferentiatedg0.104
18:3 undifferentiatedg0.137
18:04:00g0
20:4 undifferentiatedg0
20:5 n-3 (EPA)g0
22:5 n-3 (DPA)g0
22:6 n-3 (DHA)g0
Cholesterolmg0
Other
Alcohol, ethylg0
Caffeinemg0
Theobrominemg0
[Source: United States Department of Agriculture Agricultural Research Service 27)]

Kimchi health benefits

In Korea, where the aging of population is rapidly increasing and westernized lifestyle is becoming more prevalent, cardiovascular disease and metabolic syndrome–related diseases such as type two diabetes mellitus are becoming important public health issues. In fact, during the last two decades, crude mortality from ischemic heart disease dramatically increased for men (10.3-fold increase), and women (17.5-fold increase), and diabetes-related mortality was also increased four times for men and six times for women 28). These tendencies are shown throughout the world. Therefore, many trials to prevent or decrease the prevalence of these degenerative diseases have been performed with modification of environmental factors such as dietary patterns and screening for biologically effective compounds from foods.

Many studies have reported the beneficial effects of kimchi, including its anti-oxidative activity 29), 30), anti-obesity 31), anti-asthma 32), anti-aging effects 33), anti-cancer and antimutagenic activities 34), 35), anti-atherosclerotic 36) and cholesterol- lowering effects 37) and antimicrobial activity 38), immune stimulatory activity 39), weight reduction and lipid lowering effects 40) and anti-atherogenic activity 41).

Numerous studies have reported on the lipid-lowering mechanisms of kimchi or its ingredients such as Chinese cabbage, hot red pepper, garlic, green leek, and ginger 42). β-sitosterol in Chinese cabbage, S-methlycysteinsulfoxide and S-allylcysteinsulfoxide in garlic, capsaicin in red pepper are known bioactive compounds present in kimchi ingredients responsible for lowering blood lipids 43). β-Sitosterol, a phyto-cholesterol, competes with dietary cholesterol in the intestine for absorption 44). Sulfur compounds in onion and garlic stimulate lipolysis by elevating the hormone secretion such as adrenalin and glucagon, or suppressing enzyme activities responsible for cholesterol synthesis. Acetyl-CoA synthetase and/or 3-hydroxy-3-methyl-glutaryl CoA reductase activity was inhibited by allin or allicine 45). Capsaicin stimulates the secretion of plasma cholesterol to extra-circulation as bile via elevating 7α-hydroxylase activity 46). It also increases energy expenditure by regulating thyroid hormone secretion 47). Additionally, lactic acid bacteria produced during the fermentation of kimchi are believed to contribute to the cholesterol lowering activity. Lactobacillus acidophilus usually detected in kimchi can bind the cholesterol in their cell wall besides decomposing the cholesterol for assimilation and de-conjugates the bile acids 48). In previous study, kimchi effectively attenuated plasma cholesterol levels in rats and rabbits fed high cholesterol diets 49). In addition, hypercholesterolemic rabbits administered bioactive compound of kimchi, 3-(4′-hydroxyl-3′,5′-dimethoxyphenyl)propionic acid (HDMPPA) showed a drop in plasma cholesterol and LDL “bad” cholesterol within 4 days of treatment 50). These results supported the findings that kimchi supplementation to young adults for a short period could alleviate serum cholesterol concentration 51). In another study 52), kimchi consumption significantly lowered the fasting blood glucose concentration according to amount of kimchi intake. There are several considerations about the lowering effect of kimchi on fasting blood glucose. Compared with energy and carbohydrate intake between pre- and post-test, these two factors showed no difference in the two groups. Furthermore, in a previous questionnaire for physical activity, 36% and 27% subjects in the low and high group answered “no extra exercise”, respectively. These data suggested that a relatively greater reduction of fasting blood glucose or plasma lipids in the high group could be related with intake of kimchi 53).

Focusing on the effect of fermentation, this study 54) hypothesized that consumption of fermented kimchi would have more beneficial effects compared with that of fresh kimchi on metabolic parameters that are related to cardiovascular disease and metabolic syndrome risks in overweight and obese subjects. Twenty-two overweight and obese patients with body mass indexes greater than 25 kg/m² were randomly assigned to two 4-week diet phases separated by a 2-week washout period (crossover design). During each diet phase, the subjects consumed either fresh or fermented kimchi. Anthropometric data showed significant decreases in body weight, body mass index, and body fat in both groups, and the fermented kimchi group showed a significant decrease in the waist-hip ratio and fasting blood glucose. Net differences in the systolic blood pressure, diastolic blood pressure, percent body fat, fasting glucose, and total cholesterol in the fermented kimchi group were significantly greater than those in the fresh kimchi group. There was also a tendency for a decrease in fasting insulin after consumption of fermented kimchi. Therefore, the ingestion of fermented kimchi had positive effects on various factors associated with metabolic syndrome, including systolic and diastolic blood pressures, percent body fat, fasting glucose, and total cholesterol, compared with the fresh kimchi. These results suggest that the maturity of kimchi (fresh vs fermented) may affect obesity, lipid metabolism, and inflammatory processes 55).

Chinese cabbage, a main ingredient of Kimchi, is rich in minerals, vitamin C, dietary fibers, and especially phytochemicals 56). Also, cabbage contains several organic sulfur compounds, such as isothiocyanates and dithiolethiones. In a previous study 57), these organic sulfur compounds were shown to exert diverse biological effects including the inhibition of tumor cell proliferation, antimicrobial effects, and free radical scavenging. Another ingredient, garlic, contains various sulfur-contained compounds; S-allyl-l-cysteine, S-allyl-l-cysteine sulfoxides and alliin 58). It suppress the production of inflammatory cytokines, such as TNF-a, IL-1, IL-6, and interferon-γ 59). Red pepper contains high levels (25-80 mg%) of capsaicin. Capsaicin (8-methyl-N-vanillyl-6-nonenamide) is involved in physiological functions related to immune response 60).

In a previous study, 3-(4′-hydroxyl-3′,5′-dimethoxyphenyl)propionic acid (HDMPPA), an active principle in cabbage kimchi 61), demonstrated anti-atherogenic activity in terms of preventing the fatty streak formation or atherosclerosis in rabbits 62). Among the possible mechanisms, it was suggested that HDMPPA suppressed transcription rate for the enzymes responsible for the production of reactive oxygen species and also inhibited adhesion molecule expression whereas endothelial nitric oxide synthase activity in the aorta was elevated 63). In a human study, kimchi consumption exerted favorable plasma lipid lowering effects and improved metabolic syndrome parameters in obese people 64).

Probiotics are living micro-organisms that have a health benefit for their host. Orally ingested probiotic bacteria are able to modulate the immune system; however, differences exist in the immunomodulatory effects of different probiotic strains 65). Especially, lactic acid bacteria produced during the fermentation process from Kimchi : Leuconostoc mesenteroides, Leuconostoc citreum, Leuconostoc gasicomitatum, Leuconostoc kimchii, Leuconostoc inhae, Weissella Koreensis, Weissella cibaria, Lactobacillus plantarum, Lactobacillus sakei, Lactobacillus delbrueckii, Lactobacillus buchneri, Lactobacillus brevis, Lactobacillus fermentum, Pediococcus acidilactici and Pediococcus Pentosaceus 66).

According to the Lee et al. 67), suppressor T lymphocyte cells and Natural killer cells are increased with Lactobacillus casei and Bifidobacterium longumi treatment. However, another study 68), T-helper cells and suppressor T cells were not affected by the consumption of Kimchi. T lymphocyte cells play central roles in the immune system, in which their major function assisting B lymphocyte cells in the production of antibodies. Serum Ig (immunoglobulin) levels are routinely measured in clinical practice to examine immune balance. Typical ranges are suggested (Ig A; 1.4-0.4 mg/mL, Ig G; 8-16 mg/mL, and Ig M; 0.5-2.0 ng/mL). Low levels of Ig were observed in humoral immunodeficiency, while high levels of Ig were observed in chronic inflammatory diseases. Until now, many studies showed that Kimchi inhibited Ig E levels in the NC/nga mice atopic animal model [24,25]. Also, lactobacillus plantarum isolated from Kimchi increased the production of Ig A in normal or S180-bearing BALB/C tumor-induced mouse 69). On the other hand, 4 weeks of Kimchi supplementation does not changes of Ig A, Ig G or Ig M 70).

Gut microbiota dysbiosis plays a key role in the pathogenesis of inflammatory bowel disease (IBD). Much research has focused on the use of gut microbiota for the treatment of inflammatory bowel disease (IBD). Probiotics, live microorganisms that benefit host health, are commonly used to control chronic gastrointestinal inflammation in inflammatory bowel disease (IBD) patients. Lactobacillus and Bifidobacterium species are widely used as probiotics 71). Administration of Lactobacillus plantarum ameliorates the severity of colitis in IL-10-knockout mice 72). Lactobacillus paracasei isolated from kimchi, reduces colitis disease by decreasing the number of Th1 (IFN-γ or Interferon gamma) cells and macrophages in the lamina propria 73). Treatment with Lactobacillus acidophilus reduces the STAT3 and phosphorylated STAT3 levels in colon tissue from mice with Dextran sulfate sodium (DSS)-induced colitis and increases the number of Treg cells among intestinal intraepithelial and lamina propria lymphocytes in a 2,4,6-trinitrobenzene sulfonic acid-induced colitis model 74). Treatment with Bifidobacterium longum ameliorates colorectal colitis in rats by altering the methylation level of the Foxp3 promoter, resulting in an increased number of Treg cells 75). Moreover, Streptococcus thermophilus suppresses bacterial translocation, which reduces gastrointestinal bleeding and weight loss 76). Treatment with lactobacilli and bifidobacteria promoted recovery of Dextran sulfate sodium (DSS)-induced intestinal injury and inflammation in a mouse model of colitis 77). Lactobacillus casei and Bifidobacterium lactis ameliorated injury to the intestinal mucosa and liver in a 2,4,6-trinitrobenzene sulfonic acid-induced colitis model 78). Also, treatment with a probiotic combination that included lactobacilli, bifidobacteria, and streptococci reduced the levels of proinflammatory cytokines in colitis 79).

Cytokines, protein mediators produced by immune cells, are involved in immune regulation. The levels of pro-inflammatory cytokines are increased in chronic inflammatory diseases while the levels of anti-inflammatory cytokines are decreased. Kim et al. 80) showed that the consumption of fermented Kimchi (300 g/day for 4 weeks) had no effects on the levels of Tumor Necrosis Factor-α (TNF-α) and Interleukin 6 (IL-6) in overweight and obese patients (22 subjects, mean age of 38.6 ± 8.5 years). In another study 81), the levels of TNF-α and IL-6 were significantly decreased in the Kimchi and non-Kimchi groups. It is unclear why the levels of pro-inflammatory cytokines in the non-Kimchi group were decreased. The study author 82) postulated the decreased levels of TNF-α and IL-6 in placebo group may be due to the use of radish. Because of these conflicting results more research are needed before any opinion can be formed regarding the effects of kimchi on the immune system (e.g., immune stimulating activity).

References   [ + ]

read more

Cucumber

cucumber

What is a cucumber

Cucumber (Cucumis sativus L.) is a widely cultivated fruit and it’s a member of the Cucurbitaceae family, which includes species with therapeutic potential such as melon, squash, and pumpkin 1). Cucumber is a creeping vine that bears cucumiform fruits but are eaten as vegetables. Cucumber is widely consumed fresh in salads or fermented (pickles) or as a cooked vegetable. The cucumber is originally from South Asia, but now grows on most continents. Many different types of cucumber are traded on the global market. Cucumber is susceptible to fruit rot caused by the oomycete pathogen, Phytophthora capsici 2). Though Phytophthora capsici infects vegetative tissues in most crops, in cucumber, the fruits are the primary target of infection 3). Cucumber is primarily eaten immature, and they’re typically harvested at 8–12 days post-pollination, while fruit ripening and seed maturity is at ~30–35 days post-pollination 4).

Cucumber varieties

Cucumbers are classified into three main cultivar groups: “slicing”, “pickling”, and “burpless”.

Slicing cucumber

Cucumbers grown to eat fresh are called slicing cucumbers. The main varieties of slicers mature on vines with large leaves that provide shading. They are mainly eaten in the unripe green form, since the ripe yellow form normally becomes bitter and sour. Slicers grown commercially for the North American market are generally longer, smoother, more uniform in color, and have a much tougher skin. Slicers in other countries are smaller and have a thinner, more delicate skin, often having fewer seeds and being sold in a plastic skin for protection. Sometimes these are known as English cucumbers. This variety may also be called a “telegraph cucumber”, particularly in Australasia. Smaller slicing cucumbers can also be pickled.

Pickling cucumber

Pickling with brine, sugar, vinegar, and spices creates various, flavored products from cucumbers and other foods. Although any cucumber can be pickled, commercial pickles are made from cucumbers specially bred for uniformity of length-to-diameter ratio and lack of voids in the flesh. Those cucumbers intended for pickling, called picklers, grow to about 7 to 10 cm (3 to 4 in) long and 2.5 cm (1 in) wide. Compared to slicers, picklers tend to be shorter, thicker, less regularly shaped, and have bumpy skin with tiny white or black-dotted spines. Color can vary from creamy yellow to pale or dark green. The process of pickling led to the use of paraffin wax as a seal for jars used to preserve pickled and other preserved foods, and to the Mason jar made from thick glass able to tolerate high temperatures used in processing pickles and other foods for long-term shelf-life. The liquid made from pickling is called “pickle juice.”

Gherkin

Gherkins, also called cornichons, baby dills, or baby pickles, are small, whole, unsliced cucumbers, typically those 1 inch (2.5 cm) to 5 inches (13 cm) in length, often with bumpy skin, and pickled in variable combinations of brine, vinegar, spices, and sugar. In the United Kingdom, gherkins may be prepared predominantly in vinegar, imparting an acidic flavor “punch” as a side-dish for meals.

Although gherkins may be grown in greenhouses, they are commonly grown as a field crop, processed locally, and packaged in jars in Canada, the United States, and India. India, Turkey, Ukraine and Mexico compete as producers for the global gherkin market, with the European Union, United States, Canada, and Israel as major importers.

The word gherkin derived in the mid-17th century from early modern Dutch, gurken or augurken for “small pickled cucumber”. The term, West Indian gherkin, has been applied to Cucumis anguria L., a related species of Cucumis sativus, the most common cucumber plant.

Burpless cucumber

Burpless cucumbers are sweeter and have a thinner skin than other varieties of cucumber, and are reputed to be easy to digest and to have a pleasant taste. They can grow as long as 2 feet (0.61 m). They are nearly seedless, and have a delicate skin. Most commonly grown in greenhouses, these parthenocarpic cucumbers are often found in grocery markets, shrink-wrapped in plastic. They are sometimes marketed as seedless or burpless, because the seeds and skin of other varieties of cucumbers are said to give some people gas.

Other cultivars

  • Lebanese cucumbers are small, smooth-skinned and mild, yet with a distinct flavor and aroma. Like the English cucumber, Lebanese cucumbers are nearly seedless.
  • East Asian cucumbers are mild, slender, deep green, and have a bumpy, ridged skin. They can be used for slicing, salads, pickling, etc., and are available year-round. They are usually burpless as well.
  • Persian cucumber, which are mini, seedless, and slightly sweet, are available from Canada during the summer, and all year-round in the US. Easy to cut and peel, it is on average 4–7 in (10–18 cm) long. They are commonly eaten chopped up in plain yogurt with mint or sliced thin and long with salt and lemon juice. Vines are parthenocarpic, requiring no pollinators for fruit set.
  • Beit Alpha cucumbers are small, sweet parthenocarpic cucumbers adapted to the dry climate of the Middle East.
  • Apple cucumbers are short, round cucumbers grown in New Zealand and parts of Europe, known for their light yellow-green color and mildly sweet flavor. When mature, the fruit may grow tiny spines, and contains numerous edible green seeds. The fruit is usually eaten raw, with skin.
  • Schälgurken cucumbers are eaten in Germany. Their thick skins are peeled and then they braised or fried, often with minced meat or dill. They are often known by the term ‘Schmorgurken’.
  • Dosakai is a yellow cucumber available in parts of India. These fruits are generally spherical in shape. It is commonly cooked as curry, added in sambar or soup, daal and also in making dosa-aavakaaya (Indian pickle) and chutney; it is also grown and available through farms in Central California.
  • Kekiri is a smooth skinned cucumber, relatively hard, and not used for salads. It is cooked as spicy curry. It is found in dry zone of Sri Lanka. It becomes orange colored when the fruit is matured.
  • Armenian cucumbers (also known as yard long cucumbers) are fruits produced by the plant Cucumis melo var. flexuosus. This is not the same species as the common cucumber (Cucumis sativus) although it is closely related. Armenian cucumbers have very long, ribbed fruit with a thin skin that does not require peeling, but are actually an immature melon. This is the variety sold in Middle Eastern markets as “pickled wild cucumber”.

Cucumber nutrition

In a 100-gram serving, raw cucumber (with peel) is 95% water, provides 67 kilojoules (16 Calories) and supplies low content of essential nutrients, as it is notable only for vitamin K at 16% of the Daily Value.

Table 1. Cucumber (raw) nutrition facts

NutrientUnitValue per 100 g
Approximates
Waterg95.23
Energykcal15
EnergykJ65
Proteing0.65
Total lipid (fat)g0.11
Ashg0.38
Carbohydrate, by differenceg3.63
Fiber, total dietaryg0.5
Sugars, totalg1.67
Sucroseg0.03
Glucose (dextrose)g0.76
Fructoseg0.87
Lactoseg0
Maltoseg0.01
Galactoseg0
Starchg0.83
Minerals
Calcium, Camg16
Iron, Femg0.28
Magnesium, Mgmg13
Phosphorus, Pmg24
Potassium, Kmg147
Sodium, Namg2
Zinc, Znmg0.2
Copper, Cumg0.041
Manganese, Mnmg0.079
Selenium, Seµg0.3
Fluoride, Fµg1.3
Vitamins
Vitamin C, total ascorbic acidmg2.8
Thiaminmg0.027
Riboflavinmg0.033
Niacinmg0.098
Pantothenic acidmg0.259
Vitamin B-6mg0.04
Folate, totalµg7
Folic acidµg0
Folate, foodµg7
Folate, DFEµg7
Choline, totalmg6
Betainemg0.1
Vitamin B-12µg0
Vitamin B-12, addedµg0
Vitamin A, RAEµg5
Retinolµg0
Carotene, betaµg45
Carotene, alphaµg11
Cryptoxanthin, betaµg26
Vitamin A, IUIU105
Lycopeneµg0
Lutein + zeaxanthinµg23
Vitamin E (alpha-tocopherol)mg0.03
Vitamin E, addedmg0
Tocopherol, betamg0.01
Tocopherol, gammamg0.03
Tocopherol, deltamg0
Vitamin D (D2 + D3)µg0
Vitamin DIU0
Vitamin K (phylloquinone)µg16.4
Lipids
Fatty acids, total saturatedg0.037
04:00:00g0
06:00:00g0
8:0g0
10:0g0
12:0g0
14:0g0.005
15:0g0
16:0g0.028
17:0g0
18:0g0.005
20:0g0
22:0g0
24:0g0
Fatty acids, total monounsaturatedg0.005
14:1g0
15:1g0
16:1 undifferentiatedg0
17:1g0
18:1 undifferentiatedg0.005
20:1g0
22:1 undifferentiatedg0
Fatty acids, total polyunsaturatedg0.032
18:2 undifferentiatedg0.028
18:3 undifferentiatedg0.005
18:4g0
20:2 n-6 c,cg0
20:3 undifferentiatedg0
20:4 undifferentiatedg0
20:5 n-3 (EPA)g0
22:5 n-3 (DPA)g0
22:6 n-3 (DHA)g0
Fatty acids, total transg0
Cholesterolmg0
Phytosterolsmg14
Amino Acids
Tryptophang0.005
Threonineg0.019
Isoleucineg0.021
Leucineg0.029
Lysineg0.029
Methionineg0.006
Cystineg0.004
Phenylalanineg0.019
Tyrosineg0.011
Valineg0.022
Arginineg0.044
Histidineg0.01
Alanineg0.024
Aspartic acidg0.041
Glutamic acidg0.196
Glycineg0.024
Prolineg0.015
Serineg0.02
Other
Alcohol, ethylg0
Caffeinemg0
Theobrominemg0
Flavan-3-ols
(+)-Catechinmg0
(-)-Epigallocatechinmg0
(-)-Epicatechinmg0
(-)-Epicatechin 3-gallatemg0
(-)-Epigallocatechin 3-gallatemg0
(+)-Gallocatechinmg0
Flavones
Apigeninmg0
Luteolinmg0
Flavonols
Isorhamnetinmg0
Kaempferolmg0.1
Myricetinmg0
Quercetinmg0
Isoflavones
Daidzeinmg0
Genisteinmg0
Total isoflavonesmg0
Proanthocyanidin
Proanthocyanidin dimersmg0
Proanthocyanidin trimersmg0
Proanthocyanidin 4-6mersmg0
Proanthocyanidin 7-10mersmg0
Proanthocyanidin polymers (>10mers)mg0
[Source: United States Department of Agriculture Agricultural Research Service 5)]

Table 2. Cucumber (raw and peeled) nutrition facts

NutrientUnitValue per 100 g
Approximates
Waterg96.73
Energykcal10
EnergykJ44
Proteing0.59
Total lipid (fat)g0.16
Ashg0.36
Carbohydrate, by differenceg2.16
Fiber, total dietaryg0.7
Sugars, totalg1.38
Sucroseg0
Glucose (dextrose)g0.63
Fructoseg0.75
Lactoseg0
Maltoseg0
Galactoseg0
Starchg0.08
Minerals
Calcium, Camg14
Iron, Femg0.22
Magnesium, Mgmg12
Phosphorus, Pmg21
Potassium, Kmg136
Sodium, Namg2
Zinc, Znmg0.17
Copper, Cumg0.071
Manganese, Mnmg0.073
Selenium, Seµg0.1
Fluoride, Fµg1.3
Vitamins
Vitamin C, total ascorbic acidmg3.2
Thiaminmg0.031
Riboflavinmg0.025
Niacinmg0.037
Pantothenic acidmg0.24
Vitamin B-6mg0.051
Folate, totalµg14
Folic acidµg0
Folate, foodµg14
Folate, DFEµg14
Choline, totalmg5.7
Betainemg0.1
Vitamin B-12µg0
Vitamin B-12, addedµg0
Vitamin A, RAEµg4
Retinolµg0
Carotene, betaµg31
Carotene, alphaµg8
Cryptoxanthin, betaµg18
Vitamin A, IUIU72
Lycopeneµg0
Lutein + zeaxanthinµg16
Vitamin E (alpha-tocopherol)mg0.03
Vitamin E, addedmg0
Tocopherol, betamg0
Tocopherol, gammamg0.02
Tocopherol, deltamg0
Vitamin D (D2 + D3)µg0
Vitamin DIU0
Vitamin K (phylloquinone)µg7.2
Lipids
Fatty acids, total saturatedg0.078
04:00:00g0
06:00:00g0
8:0g0
10:0g0
12:0g0
14:0g0.01
15:0g0
16:0g0.058
17:0g0
18:0g0.01
20:0g0
22:0g0
24:0g0
Fatty acids, total monounsaturatedg0.01
14:1g0
15:1g0
16:1 undifferentiatedg0
17:1g0
18:1 undifferentiatedg0.01
20:1g0
22:1 undifferentiatedg0
Fatty acids, total polyunsaturatedg0.019
18:2 undifferentiatedg0.01
18:3 undifferentiatedg0.01
18:4g0
20:2 n-6 c,cg0
20:3 undifferentiatedg0
20:4 undifferentiatedg0
20:5 n-3 (EPA)g0
22:5 n-3 (DPA)g0
22:6 n-3 (DHA)g0
Fatty acids, total transg0
Cholesterolmg0
Amino Acids
Tryptophang0.007
Threonineg0.012
Isoleucineg0.012
Leucineg0.025
Lysineg0.025
Methionineg0.012
Cystineg0.007
Phenylalanineg0.031
Tyrosineg0.002
Valineg0.012
Arginineg0.031
Histidineg0.002
Alanineg0.031
Aspartic acidg0.037
Glutamic acidg0.204
Glycineg0.025
Prolineg0.012
Serineg0.025
Other
Alcohol, ethylg0
Caffeinemg0
Theobrominemg0
Isoflavones
Daidzeinmg0
Genisteinmg0
Total isoflavonesmg0
Proanthocyanidin
Proanthocyanidin dimersmg0
Proanthocyanidin trimersmg0
Proanthocyanidin 4-6mersmg0
Proanthocyanidin 7-10mersmg0
Proanthocyanidin polymers (>10mers)mg0
[Source: United States Department of Agriculture Agricultural Research Service 6)]

Health benefits of cucumber

Cucumber is a popular crop used in Indian traditional medicine since ancient times. Traditionally, cucumber plant has been used to treat headaches and hyperlipidemia, and to prevent constipation 7). Cucumber seeds and cucumber fruit have refreshing properties, soothing irritated skin and reducing swelling 8). Cucumber is very high in water content and very low in calories. Cucumber has potential anti-diabetic, anti-hyperglycemic, lipid lowering and antioxidant activity in animal studies 9), 10). Cucumber has a cleansing action within the body by removing accumulated pockets of old waste materials and chemical toxins 11). Fresh cucumber fruit juice is used for nourishing the skin 12). It gives a soothing effect against skin irritations and reduces swelling. Cucumber also has the power to relax and alleviate the sunburn’s pain 13). The cucumber fruit is refrigerant (cooling), hemostatic (an agent that causes bleeding to stop), tonic and useful in hyperdipsia (intense thirst), sunstroke (heat stroke) 14). The cucumber seeds also have a cooling effect on the body and they are used to prevent constipation 15). Several bioactive compounds have been isolated from cucumber including cucurbitacins, cucumegastigmanes I and II, cucumerin A and B, vitexin, orientin, isoscoparin 2″-O-(6‴-(E)-p-coumaroyl) glucoside, apigenin 7-O-(6″-O-p-coumaroylglucoside) 16). Despite huge exploration of cucumber in agricultural field, comparatively very few studies have been published about its chemical profile and its therapeutic potential.

Moreover, cucumber has been reported to have antiinflammatory and antioxidant properties 17).

Cucumber is known to be rich in cucurbitacins 18). Cucurbitacins are mostly found in the members of the family Cucurbitaceae and are responsible for the bitter taste of cucumber. Pharmacological activities such as anti-bacterial and anti-tumor effects have been attributed to these structurally diverse triterpens 19). Cucurbitacins have become interesting subjects in science due to their medicinal and toxic properties 20). Cucurbitacins are usually concentrated in fruits and roots at maturity and are responsible for bitter taste of cucumber. Cucumber seeds exhibit very low concentration of cucurbitacins 21). The diversity of cucurbitacins lies in side chain derivatives that contribute to pharmacological actions 22). They are known according to their structural composition and designated by the letters: A, B, C, D, E, F, G, H, I, J, K, L, O, P, Q, R and S. Cucurbitacins have also been identified outside the cucurbitaceae family including members of Scrophulariaceae, Begoniaceae, Primulaceae, Liliaceae, Tropaeolaceae and Rosaceae families 23). Various cucurbitacins are made from chemical modification of cucurbitane (19(10–9ß)-abeo-5α-lanostane) with numerous activities such as anti-inflammatory, antitumor promotion, chemopreventive, hepatoprotective, anti-microbial, anthelmintic, antifeedant and antioxidant 24). CuE is one of the cucurbitacins and is an active secondary methabolite with inhibition of cell adhesion actions 25) and modulatory activity effect on the peripheral human lymphocytes 26). The compound has also been found to be a strong antifeedant for the flea beetle, bilirubin–albumin binding in human plasma and with inhibitory activity on cancer cell proliferation, actin polymerization and permeability 27). The compound also acts as agent to protect against certain diseases in plants due to its toxicity property 28). Cu E displays superior cytotoxicity due to more hydrophobicity than the other cucurbitacins 29).

Various biological activities attributed to Cucurbitacins with probable mechanish of action (s) have been summarized in Table 3 below.

Figure 1. Cucurbitacin analogs chemical structures

Cucurbitacin analogs chemical structures

[Source 30)]

Table 3. Reported biological activities of cucurbitacins with probable mechanism of action

cucurbitacins biological activities

[Source 31)]

Anti-inflammatory activity

Cucurcitacin analogues viz. Cucurbitacin R and DHCB have been reported to possess anti-inflammatory potential and their action is reported to be mediated by inhibition of tumor necrosis factors (TNF)-α and other mediators of inflammation such as nitric-oxide synthase-2 and cyclo-oxygenase-2 32). Cucurbitacins B, D, E and I have been reported to inhibit cyclooxygenase (COX)-2 enzymes with no effect on COX-1 enzymes 33). The anti-inflammatory response of 23, 24-dihydrocucurbitacin D (DHCD) have been hypothesized to get mediated through blocking of NF-κ B activation thereby obstructing the release of nitrous oxide. DHCD can be taken up as probable lead and appraised for providing a promising anti-inflammatory agent 34).

Antitumor activity

Very less information is available on the role of Cucurbitacins at molecular level which has lead to slow advancement in the development of Cucurbitacins as anti-cancer agents. Cucurbitacin B (CuB) is a naturally occurring compound that is found abundantly in cucumbers and other vegetables, and it is known to exert anti-cancer activities (primarily via apoptosis-induction) in several human cancers 35). Cucurbitacin B, a bioactive compound from cucumber, inhibits prostate cancer growth 36). In relation to cancer, targets of Cucurbitacin actions involve growth inhibition, arrest of cell cycle at G2/M phase and induction of apoptosis in cancer cell. The mechanisms underlying anti-tumorigenic potentials of Cucurbitacins involve inhibition of Janus kinase/Signal Transducer Activator of Transcription 3 (JAK/STAT3) signaling pathway whose activation is required for the proliferation and sustainment of cells. The role of Cucurbitacin I in suppressing phosphotyrosine STAT3 in cancer cell lines and cancerous lung cells of humans has been reported 37). Although Cucurbitacin B, E, and I act by inhibiting the activation of both JAK2 and STAT3, Cucurbitacin A and I acts by inhibition of only JAK2 and STAT3 respectively 38). It has been reported that Cucurbitacin E inhibited tumor angiogenesis by inhibiting JAK-STAT3 and mitogen activated protein kinases (MAPK)- signaling pathways 39). The role of interference with actin cytoskeleton has been attributed to anti-proliferative effects of Cucurbitacin B and E. The anti-proliferative activities have been correlated directly with the disruption of the F-actin cytoskeleton 40). It has been proposed that the combination of Cucurbitacin B with docetaxel may augment the chemotherapeutic effects by suppression STAT3 in patients with laryngeal cancer 41). It is expected that cucumber fruits have anti-tumor effects since they have been reported to contain Cucurbitacin C 42). It has been reported that cucurbitacin B exerts an anticancer effect by inhibiting telomerase via down-regulating both the human telomerase reverse transcriptase and c-Myc expression in breast cancer cells 43).

Anti-artherosclerotic activity

There have been reports on Cucurbitacin B and E in glycosidic form to exhibit inhibitory effect on lipid oxidation products like- malonaldehyde and 4-hydroxynonenal 44). These reports bolster the therapeutic role of Cucurbitacins in artherosclerosis, which involves modification of lipoproteins by involvement of- malonaldehyde and 4-4-hydroxynonenal 45).

Antidiabetic activity

There have been a plethora of reports on the role of Cucurbitacins for their cytotoxic, hepatoprotective, cardiovascular, and antidiabetic effects 46). Cucurbitane triterpenoids present in momordica fruits (bitter melon) are noted for antidiabetic and anticancer activities, this may provide leads as a class of therapeutics for diabetes and obesity 47). The 5’-adenosine monophosphate-activated protein kinase (AMPK) pathway is suggested as a probable mechanism for the stimulation of GLUT4 translocation by triterpenoids from M. charantia. It is particularly interesting in relation to diabetes and obesity because activation of AMPK increases fatty acid oxidation, inhibits lipid synthesis, and can improve insulin action 48). An analogue of 23,24-dihydrocucurbitacin F from Hintonia latiflora has been reported to possess significant hypoglycemic and antihyperglycemic effects. The probable mechanism underlying– antihyperglycemic effect could be stimulation of insulin release and regulation of hepatic glycogen metabolism 49).

Free Radical Scavenging and Analgesic Activities

The aqueous fruit extract of cucumber (Cucumis sativus L.) was screened for free radical scavenging and analgesic activities. The cucumber extract was subjected to in vitro antioxidant studies at 250 and 500 μg/ml and analgesic study at the doses 250 and 500 mg/kg, respectively 50). The free radical scavenging was compared with ascorbic acid, BHA (Butylated hydroxyl anisole), whereas, the analgesic effect was compared with Diclofenac sodium (50 mg/kg). The cucumber fruit extract showed maximum antioxidant and analgesic effect at 500 μg/ml and 500 mg/kg, respectively 51). The presence of flavonoids and tannins in the extract as evidenced by preliminary phytochemical screening suggests that these compounds might be responsible for free radical scavenging and analgesic effects 52).

Anti-encephalitogenic effects

Cucumber leaf extract was characterized by the predominance of triterpenoids cucurbitacins and significant levels of phenolics. Effects of cucumber leaf extract on CD4+ T helper cells and macrophages, as the major encephalitogenic  (tending to cause encephalitis) cells in the autoimmunity of the central nervous system were investigated in this study 53). Cucumber leaf extract potently inhibited production of major pathogenic CD4+ T helper cells cytokines: interferon-gamma and interleukin-17, as well as of nitric oxide and reactive oxygen species in macrophages 54). Antigen-presenting activity of macrophages and dendritic cells was also affected by cucumber leaf extract 55). The effects of cucumber leaf extract were co-incident with modulation of NFκB and p38 mitogen associated protein kinase signaling. Concentrations of cucumber leaf extract used in vitro did not show toxic effects on zebrafish embryos. Moreover, cucumber leaf extract inhibited generation of encephalitogenic cells in animal study. These results demonstrate that cucumber leaf extract deserve further investigation on its anti-encephalitogenic therapeutic properties 56).

Ulcerative colitis in laboratory animals

In acetic acid induced ulcerative colitis in wistar rats study 57) showed pretreatment with cucumber aqueous extract for 7 days exhibited significant effect in lowering of ulcer area, ulcer index as well as neutrophil infiltration at a dose of 250 and 500 mg/kg in acetic acid induced colitis 58). That animal study demonstrated cucumber aqueous extract is of potent therapeutic value in the amelioration of experimental colitis in laboratory animals by inhibiting the inflammatory mediator. However more test tube and animal studies are needed to identify the bioactive compounds.

Miscellaneous activity

It has been reported that the concentration of Cucurbitacin C in the leaves is an important parameter in spider mite resistance in cucumber, perhaps by acting as an antagonist of a spider mite ecdysteroid receptor 59). The steroid like resemblance of Cucurbitacin D may possess therapeutic effects via inhibition of Na+/K+-ATPase 60). The role of Cucurbitacins as preventive and radical scavenging antioxidant has also been reported 61). Cucurbitacins have also been reported to possess adaptogenic activity. Cucurbitacins have been reported to increase the rat capillary permeability and to demonstrate antifertility effects in female mice 62). Cucurbitacin D has been reported to inhibit ovulation in mice. There has been protective role of Cucurbitacins acting as allomones in many plant species. Role of Cucurbitacins as anti-feedants for few insects, birds and as kairomones (Cucurbitacin B, E, D, I and L) for diabroticite beetles have been reported 63). It is reported that Cucurbitacins act via Cuc receptors located on the maxillary palpi. They arrest the searching behavior of diabroticite beetles and produce a compulsive feeding behavior 64). Role of Cucurbitacin B and D in controlling diabrotic beetles can be an interesting approach 65).

Cucurbitacins Toxicity Reports

Cucurbitacins have been reported as highly toxic compounds and instances of severe poisoning and death in sheep and cattle that consumed bitter fruits of Cucumis and Cucurbita are well documented 66). The range of toxicity of Cucurbitacins based on few in-vivo toxicity reports, has been found to be between 2 -12.5 mg/kg. Although a report on toxicity of Cucurbitacin R at level as high as 375 mg/Kg p.o and 67 mg/kg i.p is available.[65] The presence of a double bond at C-23 and acetyl group at C-25 have been found to augment the toxicity of Cucurbitacins.[66] Cucurbitacin’s strong biological activity was found to be very close to their toxic dose, which renders them unlikely to be biological agents.[48] The extreme bitterness of Cucurbitacins should deter humans from being exposed to substantial quantities of the compounds. Nevertheless, some poisonings have been reported after consumption of Cucurbitaceous food plants.[8] Cucurbitacins are found to be fatal when fruits of Luffa cylindrical (L.) were consumed.[67] Gastrointestinal symptoms have also been reported in a Japanese population consuming the bottle gourd, which contained Cucurbitacin D.[68] The toxicity of Cucurbitacins C, D, E, and I have been assessed and these compounds ascertained to be lethal. Plants with Cucurbitacins C, D, E and I must be avoided as their consumption can lead to illness or even death.[17] The appearance of toxic symptoms varies with the animal species used in the experiment, the route of administration of the compound, and the quantity that has been administered.[42]

Summary of Cucurbitacins

Although Cucurbitacins are highly toxic compounds and often their biological activities are close to their toxic dose level, these compounds possess immense pharmacological potential 67). Apart from their toxic nature cucurbitacins have been proved to possess pharmacological effectiveness against inflammation, cancer, artherosclerosis and diabetes 68). The reports on their toxicity must not overshadow the potential use of these compounds as potent medicinal agents. The chemical modification of various functional groups of these compounds to reduce toxic effects may provide important lead compounds for future research. Various Cucurbitacin analogues have been explored and are well established for toxic nature and their effectiveness against tumor cell lines. In modern drug discovery from medicinal plants, the importance of Cucurbitaceae species has been markedly recognized in empirical control of diabetes 69). The information on absorption, distribution, metabolism and excretion of these compounds is scarce and can be an area of exploration keeping in concern their toxic effects in mammals 70).

References   [ + ]

read more

Is cottage cheese good for you?

cottage cheese

What is cottage cheese

Cottage cheese is believed to have originated because the simple cheese was usually made in cottages from any milk left over after making butter dating back to 1831. Cottage cheese is drained, but not pressed, so some whey remains and the individual curds remain loose. The curd is usually washed to remove acidity, giving sweet-curd cheese. Cottage cheese is not aged or colored. Different styles of cottage cheese are made from milk with different fat levels and in small-curd or large-curd preparations. Pressed cottage cheese becomes hoop cheese, farmer cheese, pot cheese, or queso blanco. The two major types of cottage cheese are small-curd, high-acid cheese made without rennet, and large-curd, low-acid cheese made with rennet. Rennet is a natural complex of enzymes that speeds curdling and keeps the curd that forms from breaking up. Adding rennet shortens the cheese-making process, resulting in a lower acid and larger curd cheese, and reduces the amount of curd poured off with leftover liquid (whey). Sometimes large-curd cottage cheese is called “chunk style.”

Cottage cheese is popular among dieters and some health food devotees. It is a favorite food among bodybuilders, runners, swimmers and weightlifters for its high content of casein protein (a longer-lasting protein) while being relatively low in fat.

Cheeses that are safe to eat in pregnancy

All hard cheeses are safe in pregnancy

You can eat hard cheeses, such as cheddar, parmesan and stilton, even if they’re made with unpasteurized milk. Hard cheeses don’t contain as much water as soft cheeses, so bacteria are less likely to grow in them 1). It’s possible for hard cheese to contain listeria, but the risk is considered to be low 2). Although it’s possible for hard cheeses to contain listeria bacteria, they’re in such low numbers (less than one bacterium per gram of cheese) that they’re not considered to be a health risk to you or your unborn baby. Listeria bacteria can cause an infection called listeriosis.

Hard cheeses are safe to eat during pregnancy, even if they’re made with unpasteurized milk. These include:

  • cheddar
  • edam
  • emmental
  • gouda
  • gruyère
  • jarlsberg
  • parmesan
  • stilton

Soft cheeses that are safe to eat in pregnancy

Other than mold-ripened soft cheeses, all other soft types of cheese are OK to eat, provided they’re made from pasteurized milk.

These include 3):

  • cottage cheese
  • mozzarella
  • feta
  • cream cheese
  • paneer
  • ricotta
  • halloumi
  • goats’ cheese
  • processed cheeses, such as cheese spreads

Cooked soft cheeses that are safe to eat in pregnancy

Thorough cooking should kill any bacteria in cheese, so it should be safe to eat cooked mould-ripened soft cheese, such as brie, camembert and chèvre, and cooked soft blue cheese, such as roquefort or gorgonzola, or dishes that contain them.

  • It’s important to make sure the cheese is thoroughly COOKED until it’s steaming hot all the way through!

Cheeses to avoid in pregnancy

Pregnant women should avoid eating mold-ripened soft cheeses and soft blue-veined cheeses as they can contain higher levels of listeria. Examples of these cheeses include:

  • brie and blue brie
  • camembert
  • chèvre (a type of goats’ cheese). Chèvre is mold-ripened and has a white rind, similar to brie and camembert – you should AVOID all these mold-ripened soft cheeses in pregnancy. This is because soft cheese like this can contain bacteria called Listeria monocytogenes, which can cause listeriosis.
  • Danish blue
  • gorgonzola
  • roquefort

Soft cheeses with white rinds

Don’t eat mold-ripened soft cheese (cheeses with a white rind) such as brie and camembert. This includes mold-ripened soft goats’ cheese, such as chèvre. These cheeses are only safe to eat in pregnancy if they’ve been cooked 4).

Soft blue cheeses

You should also avoid soft blue-veined cheeses such as danish blue, gorgonzola and roquefort. Soft blue cheeses are only safe to eat in pregnancy if they’ve been cooked 5).

It’s advised pregnant women avoid some soft cheeses because they’re less acidic than hard cheeses and contain more moisture, which means they can be an ideal environment for harmful bacteria, such as listeria, to grow in.

Although infection with listeria (listeriosis) is rare, it’s important to take special precautions in pregnancy – even a mild form of the illness in a pregnant woman can lead to miscarriage, stillbirth or severe illness in a newborn baby.

Find out about the symptoms of listeria by reading our article on listeria infection. Listeriosis usually causes flu-like symptoms but can lead to serious problems such as miscarriage or stillbirth, or severe illness in a newborn baby.  If you’re pregnant and showing signs of listeria infection, seek medical help straight away.

Cottage cheese nutrition

A 100g cottage cheese of 4% fat product has about 106 calories, 4.42 g fat (3 g saturated), 4.42 g carbohydrates, and 11.5 g protein. It also contains about 310 mg sodium, 88 mg calcium, and 22 mg cholesterol (see Table 1). 1 cup of cottage cheese (900 mg) each contain over 20% of the Dietary Guidelines for Americans’ recommendation for daily sodium intake 6).

  • Cottage cheese calories is 106 calories per 100 gram cottage cheese
  • Carbs in cottage cheese = 4.42 gram per 100 gram cottage cheese
  • Cottage cheese protein = 11.5 grams per 100 gram cottage cheese

Some manufacturers also produce low-fat (Table 2) and nonfat (Table 3) varieties. A fat-free kind of a similar serving size has 71 calories, 0 g fat (0 g saturated), 4.42 g carbohydrates, and 11.5 g protein.

Table 1. Cottage cheese nutrition facts

NutrientUnitValue per 100 g
Approximates
Energykcal106
Proteing11.5
Total lipid (fat)g4.42
Carbohydrate, by differenceg4.42
Fiber, total dietaryg0
Sugars, totalg3.54
Minerals
Calcium, Camg88
Iron, Femg0
Potassium, Kmg133
Sodium, Namg310
Vitamins
Vitamin C, total ascorbic acidmg0
Vitamin A, IUIU177
Lipids
Fatty acids, total saturatedg3.1
Fatty acids, total monounsaturatedg1.33
Fatty acids, total polyunsaturatedg0
Fatty acids, total transg0
Cholesterolmg22

Ingredients: CULTURED NONFAT MILK, MILK, CREAM, LESS THAN 2% OF: SALT, NONFAT MILK, MALTODEXTRIN, CITRIC ACID, CARRAGEENAN, MONO AND DIGLYCERIDES, LOCUST BEAN GUM, GUAR GUM, NATURAL FLAVORS, CARBON DIOXIDE (TO PRESERVE FRESHNESS), ENZYME.

[Source: United States Department of Agriculture Agricultural Research Service 7)]

Table 2. Cottage cheese (Low Fat) nutrition facts

NutrientUnitValue per 100 g
Approximates
Energykcal76
Proteing8.47
Total lipid (fat)g2.12
Carbohydrate, by differenceg6.78
Fiber, total dietaryg0
Sugars, totalg4.24
Minerals
Calcium, Camg127
Iron, Femg0
Sodium, Namg331
Vitamins
Vitamin C, total ascorbic acidmg0
Vitamin A, IUIU339
Vitamin DIU34
Lipids
Fatty acids, total saturatedg1.27
Fatty acids, total transg0
Cholesterolmg13

Ingredients: CULTURED PASTEURIZED GRADE A SKIM MILK, MILK AND CRAM, WHEY, CONTAINS LESS THAN 2% OF MODIFIED FOOD STARCH, SALT, CALCIUM PHOSPHATE, XANTHAN GUM, GUAR GUM NATURAL FLAVOR, VITAMIN A PALMATE, VITAMIN D3.

[Source: United States Department of Agriculture Agricultural Research Service 8)]

Table 3. Cottage cheese (Fat Free) nutrition facts

NutrientUnitValue per 100 g
Approximates
Energykcal71
Proteing11.5
Total lipid (fat)g0
Carbohydrate, by differenceg4.42
Fiber, total dietaryg0
Sugars, totalg3.54
Minerals
Calcium, Camg88
Iron, Femg0
Sodium, Namg398
Vitamins
Vitamin C, total ascorbic acidmg0
Vitamin A, IUIU177
Lipids
Fatty acids, total saturatedg0
Fatty acids, total transg0
Cholesterolmg4

Ingredients: CULTURED SKIM MILK, SKIM MILK, WHEY PROTEIN CONCENTRATE, CONTAINS 2% OR LESS OF SALT, GUAR GUM, MONO AND DIGLYCERIDES*, LOCUST BEAN GUM, XANTHAN GUM, NATURAL FLAVORS, ARTIFICIAL COLOR, POTASSIUM SORBATE AND CARBON DIOXIDE (PRESERVATIVES), CARRAGEENAN, POLYSORBATE 80, VITAMIN A PALMITATE, ENZYMES.

[Source: United States Department of Agriculture Agricultural Research Service 9)]

Is cottage cheese healthy

Based on the most recent published evidence, April 2018 meta-analyses of randomized controlled trials using 25 prospective studies on dairy products, investigating the relationship between fermented foods and non-transmissible chronic diseases 10) found eating cottage has no health benefit. That review 11) included a range of randomized controlled trials (RCTs) as well as the meta-analyses of randomized controlled trials published by Benatar et al. 12) and de Goede et al. 13), and the systematic reviews of Turner et al. 14) and Labonté et al. 15). These studies investigated LDL “bad” cholesterol, HDL “good” cholesterol, fasting triglycerides, postprandial triglycerides, LDL particle size, apoB, non-HDL cholesterol, cholesterol ratios, inflammatory markers, insulin resistance, blood pressure, and vascular function. The strongest evidence for a beneficial effect was for yogurt on risk factors of type 2 diabetes 16). Although mechanisms explaining this association have not been validated, an increased bioavailability of insulinotropic amino acids and peptides as well as the bacterial biosynthesis of vitamins, in particular vitamin K2, might contribute to this beneficial effect 17). However, the heterogeneity in the design of the studies and the investigated foods impedes a definitive assessment of these associations.

Studies on Cardio-Metabolic Diseases

Drouin-Chartier et al. 18) conducted a comprehensive review of the impact of dairy foods, in particular, of dairy fat, on cardio-metabolic risk. Drouin-Chartier et al. 19) focused their analysis on the potentially detrimental effect of dairy fat on cardio-metabolic risk factors by concluding that there is no apparent risk of potential harmful effects of dairy consumption on a large set of cardio-metabolic variables. Among the products investigated, total dairy, milk, cheese, and yoghurt were discussed, providing additional information on the impact of fermented dairy products on cardio-metabolic health. The authors highlighted that the cholesterol-raising effects of saturated fatty acids are attenuated when provided in complex foods, such as milk, cheese, or yoghurt. Dairy food consumption has neither an impact on low-grade systemic inflammation, nor on insulin resistance or glucose and insulin homeostasis in the short term but may be beneficial in the long term. Furthermore, data from randomized controlled trials that have evaluated the impact of dairy consumption on either blood pressure or vascular function are very consistent in showing mostly no effect.

In summary, an overview of the randomized controlled trials available on the impact of fermented dairy products on cardio-metabolic factors indicate that these products do not differentiate themselves from milk or total dairy in that their impact can be characterized as neutral.

Cardiovascular Diseases

Five meta-analyses have investigated the association between dairy product intake and cardiovascular disease risk in the last five years 20), 21), 22), 23), 24).

The meta-analysis by Qin et al. 25) indicated that total dairy, but not yogurt, may decrease the risk of cardiovascular disease. Alexander et al. 26) indicated that total dairy, milk, yogurt and cheese are not associated with reduced risk of cardiovascular disease. Moderate evidence that higher intake of cheese is associated with a weak reduction of risk of cardiovascular disease was reported by Chen et al. 27). Moderate evidence for a weak reduction of risk of cardiovascular disease for fermented dairy, but not for dairy, milk, cheese, or yogurt was reported by Guo et al. 28). The same authors also reported moderate evidence for a weak reduction of risk of mortality for fermented dairy, but not for dairy, milk, cheese, or yogurt 29). Finally, the meta-analysis by O’Sullivan et al. 30) indicated moderate evidence that total dairy, milk and cheese do not modify the risk of cardiovascular disease mortality.

In their systematic review, Drouin-Chartier et al. 31) concluded that the association between the consumption of fermented dairy and cardiovascular disease risk is based on very low-quality evidence and thus remains uncertain at this point.

Taken together, none of the meta-analyses reported a detrimental effect of dairy products, including all fermented dairy products investigated. A neutral effect of yogurt was demonstrated in all four meta-analyses in which this product was investigated, whereas one out of five meta-analyses reported a beneficial effect of cheese consumption. On the other hand, the data from two meta-analyses on fermented dairy provided evidence for a beneficial effect of this product category. In conclusion, these meta-analyses provide weak evidence that fermented foods may have a beneficial effect on cardiovascular disease, although the data remain weak and inconsistent.

Coronary Heart Disease (CHD)/Coronary Artery Disease (CAD)

Four meta-analyses have investigated the association between dairy products and Coronary Heart Disease/Coronary Artery Disease risk in the last five years 32)33), 34), 35). Moderate evidence that higher intake of cheese is associated with a moderately reduced risk of Coronary Heart Disease was reported by Chen et al. 36). No evidence for a reduction of risk of Coronary Heart Disease was found for dairy, milk, fermented dairy, cheese, or yogurt 37). Moderate evidence suggesting that cheese consumption, in particular, at higher servings, but not total dairy, milk or yoghurt, may be associated with a moderate reduction of risk of Coronary Heart Disease was reported by Alexander et al. 38). Finally, moderate evidence, reported by Qin et al. 39), suggests that cheese, but not total dairy or yogurt, may moderately decrease the risk of Coronary Heart Disease.

In their systematic review, Drouin-Chartier et al. 40) concluded that there is moderate but consistent evidence for a neutral association between yogurt consumption and Coronary Artery Disease risk. The same authors also concluded that the association between the consumption of fermented dairy and the risk of Coronary Artery Disease remains uncertain because only evidence of insufficient quality is available.

Taken together, moderate evidence for a moderate reduction of risk of Coronary Heart Disease was associated with the consumption of cheese in three out of four meta-analyses, whereas the other analyses, including yogurt, milk and dairy, indicated a neutral effect.

Stroke

Four meta-analyses have investigated the association between dairy product consumption and stroke risk in the last five years 41), 42), 43), 44), 45). The analysis by Alexander et al. 46) suggested that there is moderate evidence that cheese consumption, but not milk, may be associated with a moderate reduction in the risk of stroke, whereas total dairy consumption may be associated with a reduction in the risk of stroke. The analysis by de Goede et al. 47) indicated moderate evidence for a weak reduction in the risk of stroke with consumption of milk and >25 g/day cheese. Qin et al. 48) indicated that total dairy may decrease the risk of stroke and showed moderate evidence that cheese, but not yoghurt, may weakly decrease the risk of stroke. Also, Hu et al. 49) showed moderate evidence that total dairy, including fermented milk, but not milk or non-fermented milk, may moderately decrease the risk of stroke. Finally, the study by Hu et al. 50) suggested that there is moderate evidence that cheese intake may weakly decrease the risk of stroke.

In their systematic review, Drouin-Chartier et al. 51) suggested that there is moderate-quality evidence that the consumption of fermented dairy is associated with a reduced risk of stroke (see Table 4). They further concluded that the available meta-analysis on yogurt has a relatively good quality score, further suggesting that yogurt consumption is not associated with the risk of stroke; this was based on moderate-quality evidence.

Taken together, none of the dairy products, including fermented dairy products, are associated with a detrimental effect on stroke. Moderate evidence for a weak to moderate effect of fermented dairy products, in particular, cheese, is indicated by these meta-analyses, although these effects are inconsistently associated with the fermentation process—yogurt was found to have a neutral effect when investigated in the product-specific study.

Hypertension

Two meta-analyses have investigated the association between dairy products and hypertension risk in the last five years 52), 53). In addition, one meta-analysis, integrating 15 randomized controlled trials evaluating the impact of fermented dairy products on hypertension, was published by Usinger et al. 54).

The study by Soedamah-Muthu et al. 55) suggested that total dairy and milk, but not yogurt, total fermented dairy or cheese may moderately contribute to the prevention of hypertension. Also, the report by Ralston et al. 56) provided moderate evidence for a moderate effect of fluid dairy foods (including milk and yoghurt), but not cheese, on blood pressure in subjects with elevated blood pressure.

In the Cochrane review of randomized controlled trials on the impact of fermented milk on hypertension, Usinger et al. 57) suggested a modest overall effect of fermented milk on blood pressure. However, the evidence was evaluated as weak, in light of the fact that an effect of fermented milk was found on systolic blood pressure (BP), but not on diastolic blood pressure.

The included studies were of variable quality as well as heterogeneous, and the findings do not support the use of fermented milk as an anti-hypertensive treatment or as a lifestyle intervention to reduce blood pressure.

In their systematic review, Drouin-Chartier et al. 58) concluded that there is no significant association between the consumption of fermented dairy and the risk of hypertension. Of note, Drouin-Chartier et al. 59) commented on an additional published study on this topic 60), which reported an inverse association between the consumption of fermented dairy and the risk of hypertension. This study has an important weighting (n = 2340) relative to data from the meta-analysis by Soedamah-Muthu et al. 61) (n = 7641) and is likely to modify pooled risk estimates. In this context, Drouin-Chartier et al. 62) suggested that moderate-quality evidence supports a neutral association between the consumption of fermented dairy and the risk of hypertension, with the need for further studies on the topic to yield better quality evidence. Regarding yogurt and the risk of hypertension, moderate-quality evidence was suggested by Drouin-Chartier et al. 63) that yogurt consumption is not associated with the risk of hypertension (Table 4).

Taken together, none of the dairy products, including fermented dairy products, are associated with an increased risk of hypertension. Half of the studies reported weakly beneficial effects but the results are inconsistent.

Myocardial Infarction (Heart Attack)

No meta-analysis is available that summarizes studies characterizing the association of fermented dairy products and myocardial infarction (heart attack) risk.

Type 2 Diabetes Mellitus

Five meta-analyses have investigated the associations between fermented dairy products and type 2 diabetes mellitus risk in the last five years 64), 65), 66), 67), 68).

The meta-analysis by Gijsbers et al. 69) provided moderate evidence that the intake of dairy foods, yogurt and fermented dairy, but not cheese or milk, moderately decreases type 2 diabetes mellitus risk. The study by Chen et al. 70) showed moderate evidence that higher intake of yogurt is associated with a moderately-reduced risk of type 2 diabetes mellitus, whereas total dairy is not appreciably associated with the incidence of type 2 diabetes mellitus. Aune et al. 71) indicated that dairy products, but not milk, may be associated with a decrease in the risk of type 2 diabetes mellitus. Also, moderate evidence suggested that yogurt at higher doses may moderately decrease the risk of type 2 diabetes mellitus. Finally, the same authors reported moderate evidence that cheese, but not cottage cheese, may weakly decrease the risk of type 2 diabetes mellitus, as well as weak evidence that fermented milk may moderately decrease the risk of type 2 diabetes mellitus 72). The fourth meta-analysis by Gao et al. 73) showed moderate evidence suggesting that the intake of dairy products, cheese and high doses of yogurt, but not milk or fermented dairy, moderately decrease type 2 diabetes mellitus risk. Finally, Tong et al. 74) indicated that total dairy may reduce the risk of type 2 diabetes mellitus, whereas moderate evidence suggests that yogurt, but not whole milk, may moderately reduce the risk of type 2 diabetes mellitus.

In their systematic review, Drouin-Chartier et al. 75) concluded that the consumption of fermented dairy does not appear to be associated with the risk of type 2 diabetes mellitus. This statement was based on moderate-quality evidence, because the three meta-analyses available relied on almost the same pools of prospective cohort studies (see Table 4). On the other hand, the same authors concluded that the five meta-analyses regarding the association between yogurt intake and the risk of type 2 diabetes mellitus reported consistent results, suggesting that there is high-quality evidence that supports an inverse association between the intake of yogurt and the risk of type 2 diabetes mellitus.

Taken together, these meta-analyses provide evidence for a positive impact of fermented dairy, in particular yogurt, on type 2 diabetes mellitus risk.

Table 4. Evaluation of the impact of dairy products on cardio-metabolic factors and diseases (intervention studies and prospective studies).

Total DairyMilkCheeseYogurt
Prospective studies 76)
CVDNeutralUncertainNeutralNeutral
CAD/CHDNeutralNeutralNeutralNeutral
StrokeFavorableNeutralFavorableNeutral
HypertensionFavorableFavorableNeutralNeutral
MetSFavorableFavorableUncertainUncertain
T2DMFavorableNeutralFavorableFavorable
Interventional studies randomized controlled trials 77)
LDL cholesterolNo effectNo effectNo effectNo effect
HDL cholesterolNo effectUncertainUncertainNo effect
Fasting TGsNo effectUncertainNo effectNo effect
Postprandial TGsUndeterminedNo effectNo effectUndetermined
LDL sizeUndeterminedNo effectUndeterminedUndetermined
apoBUndeterminedNo effectNo effectUndetermined
Non-HDL cholesterolUndeterminedUndeterminedUndeterminedUndetermined
Cholesterol ratiosUndeterminedNo effectNo effectReduced
InflammationNo effectNo effectUndeterminedNo effect
Insulin resistanceUncertainNo effectNo effectNo effect
Blood pressureNo effectNo effectUndeterminedNo effect
Vascular functionNo effectNo effectUndeterminedNo effect

Notes: apoB: apolipoprotein B; CAD: coronary artery disease; CHD: coronary heart disease; CVD: cardiovascular disease; HDL: high-density lipoprotein  “good” cholesterol; LDL: low-density lipoprotein “bad” cholesterol; MetS: Metabolic Syndrome; T2DM: Type 2 Diabetes Mellitus; TG: triglyceride.

[Source 78)]

Metabolic Syndrome (Metabolic Syndrome X)

One meta-analysis has investigated the association between dairy products and metabolic syndrome risk in the last five years 79).

This meta-analysis indicated that dairy intake may be inversely associated with the incidence and prevalence of metabolic syndrome. Also, weak evidence from cross-sectional studies suggests that dairy, milk and cheese, but not yogurt, may moderately decrease the incidence of diabetes.

In their systematic review, Drouin-Chartier et al. 80) judged the quality of the evidence relating yogurt intake to the incidence of metabolic syndrome to be very low, and thus, the association remains uncertain.

Taken together, none of the dairy products, including fermented dairy products, are associated with an increased or a decreased risk of metabolic syndrome.

Obesity

One meta-analysis has investigated the association between dairy products and metabolic obesity risk in the last five years 81).

This meta-analysis 82) indicated, with weak to moderate evidence, that yogurt consumption weakly decreases weight gain, waist circumference, risk of being overweight, and risk of abdominal obesity. The study also provided moderate evidence that cheese consumption weakly increases weight gain. In addition, dairy was negatively associated with weight gain, waist circumference, risk of being overweight and risk of abdominal obesity. Finally, milk consumption was negatively associated with waist circumference.

Taken together, yogurt might be beneficial preventing obesity 83). However, no significant association for yogurt consumption was observed for most of the endpoints related to obesity when comparing the highest versus the lowest categories of consumption. Further, the overall interpretation of the results is limited by heterogeneous risk estimates. The level of evidence for impacts of fermented dairy products on obesity risk is limited, and further studies are needed.

Summary of Studies Involving Cardio-metabolic Diseases

Dairy food consumption has neither an impact on low-grade systemic inflammation, nor on insulin resistance or glucose and insulin homeostasis in the short term but may be beneficial in the long term. Furthermore, data from randomized controlled trials that have evaluated the impact of dairy consumption on either blood pressure or vascular function are very consistent in showing mostly no effect. The consumption of fermented foods in the context of particular indications, such as yogurt intake and diabetes or cheese intake and stroke, can only be recommended on the basis of weak and inconsistent evidence 84).

In summary, an overview of the randomized controlled trials available on the impact of fermented dairy products on cardio-metabolic factors indicate that these products do not differentiate themselves from milk or total dairy in that their impact can be characterized as neutral 85).

Studies on Cancer

Two meta-analyses from the last five years investigated the association between dairy products and colorectal cancer risk 86), 87). The first meta-analysis showed that milk and total dairy products are associated with a significant reduction in colon cancer risk, whereas cheese, yoghurt, fermented milk and fermented dairy have neutral effects 88). Ralston et al. 89) later confirmed these findings by reporting a significant inverse association between the consumption of non-fermented dairy products and the risk of colorectal cancer, but no association between the consumption of fermented milk and cheese and colorectal cancer risk.

There is no evidence for a beneficial or detrimental effect of fermented dairy products on colorectal cancer. The potential beneficial effects of dairy products regarding colorectal cancer are thus unlikely to be attributed to the fermentation process.

One meta-analysis investigated the association between dairy products and pancreatic cancer risk that was published in the last five years 90). Intakes of cheese, cottage cheese, yogurt, as well as milk, were not associated with pancreatic cancer risk. There is no evidence for a beneficial or detrimental effect of fermented dairy products on pancreatic cancer.

Two meta-analyses investigated the association between dairy products and gastric cancer risk 91), 92). None of these analyses demonstrated a significant association between the intake of cheese and yoghurt, and gastric cancer risk. Of note, the results of cohort studies, but not case-control studies, suggested that total dairy intake might be related to the reduction of gastric cancer risk 93), whereas the results of case-control studies, but not cohort studies, provided weak evidence for an increased risk 94).

There is no evidence for a beneficial or detrimental effect of fermented dairy products on gastric cancer. The potential effects of dairy products on gastric cancer are thus unlikely to be attributed to the fermentation process.

One meta-analysis from the last five years, summarizing 19 cohort and case-control studies, investigated the associations between fermented dairy products and ovarian cancer risk 95). This study concluded that milk and yoghurt intake has no association with an increased risk of ovarian cancer. There is no evidence for a beneficial or detrimental effect of fermented dairy products on ovarian cancer.

One meta-analysis from the last five years has summarized cohort and case-control studies in order to investigate the associations between fermented dairy products and lung cancer risk 96). Weak evidence from two cohort studies was available for a protective effect of cheese, but this effect was not found in the overall analysis of all studies that included eight case-control studies. In addition, no effects were observed for dairy, milk and yogurt. Taken together, there is no evidence for a beneficial or detrimental effect of fermented dairy products on lung cancer.

No meta-analysis is available that summarizes the impact of dairy products or fermented dairy products on other types of cancer. Also, to our knowledge, no individual study has been published focusing on the effects of fermented dairy product intake on additional types of cancer whose results would justify a critical appraisal in this report.

Summary of Studies Involving Cancer

In their review, Thorning et al. 97) concluded that, according to the World Cancer Research Fund reports and the latest meta-analyses, (i) consumption of milk and dairy products probably protects against colorectal, bladder, gastric and breast cancers, (ii) dairy intake does not seem to be associated with risk of pancreatic, ovarian or lung cancer; and (iii) the evidence for prostate cancer risk is inconsistent.

References   [ + ]

read more

Is almond butter healthy?

almond butter

What is almond butter

Almond butter is a food paste made from almonds. Almond butter may be crunchy or smooth, and is generally “stir” (susceptible to oil separation) or “no-stir” (emulsified). Almond butter may be either raw or roasted, describing the almonds themselves prior to grinding. It is recommended that almond butter be refrigerated once opened to prevent spoilage and oil separation. Generally, nut/seed butters contain generous amounts of phytochemicals that may be protective against colon, prostate, and breast cancer 1). According to Jiang et al. 2), the relative risk of developing diabetes was reduced 27 % in those who ate nuts five or more times per week compared with those who rarely or never ate nuts. Nutritional property of some of the nut/seed butter is presented in Table 6. Raw nuts have primarily 1 of the 2 unsaturated types (except coconut and palm kernels), thus leads healthful source of fatty acids for the production of lower cholesterol level foods. At present different plant based butters/spreads are available in the market. For example peanut butter, almond butter, cashew butter, pumpkin seed butter, pistachio butter, soy butter, sunflower and sesame butter. The term plant based (Nut/Seed) butter refers to a product that contains at least 90 % nut/seed ingredients whereas, the spread refers to a spreadable product having at least 40 % nut ingredients which can be added in various forms, e.g. as nuts, a paste and/or a slurry 3).

The dairy butter is a water-in-oil emulsion, i.e. >80 % fat with tiny water droplets, perhaps some solids-not-fat and with/without salt 4) (see Table 5 below). However, animal foods such as butter are rich in saturated fat. Butter with and without salt contains 55 ± 2 g/100 g of saturated fat and 222 ± 2 mg/100 g cholesterol 5).

Due to the mounting health concerns regarding the consumption of dairy butter because of its high saturated fat content has raised the need to search for an alternative plant based butters viz., nut butters and seed butters. Nuts and seeds are nutrient dense foods and have been a regular constituent of mankind’s diet since pre-agricultural times 6). Nuts and seeds are generally consumed as snack food in roasted form as they are of good taste, handy and easy to eat. But, recently with the advent of new technologies, myriad varieties of nut and seed based snacks and processed products have arrived in the market out of which the form of butter gained more popularity.

Evidence suggests that nut consumption, including peanuts, protects against not only coronary heart disease (coronary artery disease) but also against diabetes and the coronary heart disease (coronary artery disease) associated with diabetes, and other metabolic syndrome diseases, notably gallstone disease 7). In one of the largest studies to date about the health benefits of nuts, researchers analyzed data from more than 210,000 health professionals over as many as 32 years. They found that, compared with those who never or almost never ate nuts, people who ate one ounce of nuts five or more times per week had a 14% lower risk of cardiovascular disease and a 20% lower risk of coronary heart disease during the study period. Both walnuts and peanuts were linked with lower disease risk, the study found. No heart benefits were associated with eating peanut butter—which could be because people tend to pair peanut butter with unhealthy foods or because peanut butter is often mixed with salt and sweeteners, possibly canceling out the positive health benefits of the peanuts, according to an editorial accompanying the study.

The form of butter is one of the healthy way of integrating nuts and seeds into your regular diet. Nut and seed butters are generally prepared by roasting, grinding and refrigerated to consume it when it is still fresh. During this process it is imperative to retain the nutritional properties of these nuts and seeds in order to reap the benefits of the fresh nuts and seeds in the form of butter as well. Proper care is needed to minimize the conversion of healthful components in to unhealthy components during processing and further storage. Roasting temperature, temperatures during grinding and storage are the vital factors to be considered in order to have healthy and nutritious plant based butters.

The type of nuts you choose to eat probably doesn’t matter much. Most nuts appear to be generally healthy, though some may have more heart-healthy nutrients than others. For example, walnuts contain high amounts of omega-3 fatty acids.

Almonds, macadamia nuts, hazelnuts and pecans are other nuts that appear to be quite heart healthy. And peanuts — which are technically not a nut, but a legume, like beans — seem to be relatively healthy.

Keep in mind, you could end up canceling out the heart-healthy benefits of nuts if they’re covered with chocolate, sugar or salt.

What’s in nuts that might make them heart healthy?

Besides being packed with protein, most nuts contain at least some of these heart-healthy substances:

  • Unsaturated fats. It’s not entirely clear why, but it’s thought that the “good” fats in nuts — both monounsaturated and polyunsaturated fats — lower bad cholesterol levels.
  • Omega-3 fatty acids. Omega-3 fatty acids are found in many kinds of fish, but many nuts are also rich in omega-3 fatty acids. Omega-3s are a healthy form of fatty acids that seem to help your heart by, among other things, preventing dangerous heart rhythms that can lead to heart attacks.
  • Fiber. All nuts contain fiber, which helps lower your cholesterol. Fiber makes you feel full, so you eat less. Fiber is also thought to play a role in preventing type 2 diabetes.
  • Vitamin E. Vitamin E may help stop the development of plaques in your arteries, which can narrow them. Plaque development in your arteries can lead to chest pain, coronary artery disease or a heart attack.
  • Plant sterols. Some nuts contain plant sterols, a substance that can help lower your cholesterol. Plant sterols are often added to products like margarine and orange juice for additional health benefits, but sterols occur naturally in nuts.
  • L-arginine. Nuts are also a source of l-arginine, which is a substance that may help improve the health of your artery walls by making them more flexible and less prone to blood clots that can block blood flow.

Figure 1. Almond butter

almond butter

Almond butter nutrition

Almond butter is high in monounsaturated fats, calcium, potassium, iron and manganese. Almond butter is considered a good source of riboflavin, phosphorus, and copper and an excellent source of vitamin E, magnesium, and fiber. Almond butter also provides dietary protein.

Almond butter is an alternative to peanut butter for those with peanut allergies or who dislike the taste of peanuts. Almond butter contains significantly more fiber, calcium, potassium, iron, and manganese than peanut butter and about half the saturated fat, although a slightly higher total fat content. Almonds are not legumes whereas peanuts are, so almond butter can be consumed by those looking to avoid legumes.

Plain raw almond butter calories without added salt is about 614 calories per 100 gram.

Carbs in almond butter is 18.82 gram per 100 gram.

Table 1. Almond butter (plain without added salt) nutrition facts

NutrientUnitValue per 100 g
Approximates
Waterg1.64
Energykcal614
EnergykJ2568
Proteing20.96
Total lipid (fat)g55.5
Ashg3.09
Carbohydrate, by differenceg18.82
Fiber, total dietaryg10.3
Sugars, totalg4.43
Sucroseg4.34
Glucose (dextrose)g0.02
Fructoseg0
Lactoseg0
Maltoseg0.07
Starchg0.08
Minerals
Calcium, Camg347
Iron, Femg3.49
Magnesium, Mgmg279
Phosphorus, Pmg508
Potassium, Kmg748
Sodium, Namg7
Zinc, Znmg3.29
Copper, Cumg0.934
Manganese, Mnmg2.131
Selenium, Seµg2.4
Vitamins
Vitamin C, total ascorbic acidmg0
Thiaminmg0.041
Riboflavinmg0.939
Niacinmg3.155
Pantothenic acidmg0.318
Vitamin B-6mg0.103
Folate, totalµg53
Folic acidµg0
Folate, foodµg53
Folate, DFEµg53
Choline, totalmg52.1
Vitamin B-12µg0
Vitamin A, RAEµg0
Retinolµg0
Carotene, betaµg1
Carotene, alphaµg0
Cryptoxanthin, betaµg0
Vitamin A, IUIU1
Lycopeneµg0
Lutein + zeaxanthinµg1
Vitamin E (alpha-tocopherol)mg24.21
Tocopherol, betamg0.53
Tocopherol, gammamg1.01
Tocopherol, deltamg0
Vitamin D (D2 + D3)µg0
Vitamin DIU0
Vitamin K (phylloquinone)µg0
Lipids
Fatty acids, total saturatedg4.152
8:0g0
10:0g0
12:0g0
14:0g0.007
15:0g0
16:0g3.192
17:0g0.007
18:0g0.938
20:0g0.007
22:0g0
Fatty acids, total monounsaturatedg32.445
14:1g0
15:1g0
16:1 undifferentiatedg0.248
17:1g0.035
18:1 undifferentiatedg32.143
20:1g0.019
Fatty acids, total polyunsaturatedg13.613
18:2 undifferentiatedg13.605
18:3 undifferentiatedg0.007
20:2 n-6 c,cg0
20:3 undifferentiatedg0
20:4 undifferentiatedg0
Cholesterolmg0
Phytosterolsmg139
Stigmasterolmg3
Campesterolmg6
Beta-sitosterolmg131
Amino Acids
Tryptophang0.159
Threonineg0.555
Isoleucineg0.813
Leucineg1.483
Lysineg0.612
Methionineg0.122
Cystineg0.242
Phenylalanineg1.149
Tyrosineg0.595
Valineg0.937
Arginineg2.382
Histidineg0.55
Alanineg0.99
Aspartic acidg2.397
Glutamic acidg5.912
Glycineg1.472
Prolineg0.915
Serineg0.926
Other
Alcohol, ethylg0
[Source: United States Department of Agriculture Agricultural Research Service 8)]

Table 2. Organic almond butter (raw) nutrition facts

NutrientUnitValue per 100 g
Approximates
Energykcal562
Proteing21.88
Total lipid (fat)g50
Carbohydrate, by differenceg18.75
Fiber, total dietaryg12.5
Sugars, totalg6.25
Minerals
Calcium, Camg250
Iron, Femg4.5
Sodium, Namg0
Vitamins
Vitamin C, total ascorbic acidmg0
Vitamin A, IUIU0
Lipids
Fatty acids, total saturatedg3.12
Fatty acids, total transg0
Cholesterolmg0
[Source: United States Department of Agriculture Agricultural Research Service 9)]

Table 3. Organic almond butter (raw and crunchy) nutrition facts

NutrientUnitValue per 100 g
Approximates
Energykcal562
Proteing21.88
Total lipid (fat)g50
Carbohydrate, by differenceg18.75
Fiber, total dietaryg12.5
Sugars, totalg6.25
Minerals
Calcium, Camg250
Iron, Femg4.5
Sodium, Namg0
Vitamins
Vitamin C, total ascorbic acidmg0
Vitamin A, IUIU0
Lipids
Fatty acids, total saturatedg3.12
Fatty acids, total transg0
Cholesterolmg0
[Source: United States Department of Agriculture Agricultural Research Service 10)]

Table 4. Organic almond butter (dry roasted unblanched) nutrition facts

NutrientUnitValue per 100 g
Approximates
Energykcal633
Proteing16.67
Total lipid (fat)g60
Carbohydrate, by differenceg20
Fiber, total dietaryg3.3
Sugars, totalg6.67
Minerals
Calcium, Camg267
Iron, Femg3.6
Potassium, Kmg767
Sodium, Namg0
Vitamins
Vitamin C, total ascorbic acidmg0
Folate, totalµg53
Vitamin A, IUIU0
Lipids
Fatty acids, total saturatedg5
Fatty acids, total monounsaturatedg33.33
Fatty acids, total polyunsaturatedg13.33
Fatty acids, total transg0
Cholesterolmg0
[Source: United States Department of Agriculture Agricultural Research Service 11)]

Table 5. Butter (plain without added salt) nutrition facts

NutrientUnitValue per 100 g
Approximates
Waterg16.17
Energykcal717
EnergykJ2999
Proteing0.85
Total lipid (fat)g81.11
Ashg0.09
Carbohydrate, by differenceg0.06
Fiber, total dietaryg0
Sugars, totalg0.06
Minerals
Calcium, Camg24
Iron, Femg0.02
Magnesium, Mgmg2
Phosphorus, Pmg24
Potassium, Kmg24
Sodium, Namg11
Zinc, Znmg0.09
Copper, Cumg0.016
Manganese, Mnmg0.004
Selenium, Seµg1
Fluoride, Fµg2.8
Vitamins
Vitamin C, total ascorbic acidmg0
Thiaminmg0.005
Riboflavinmg0.034
Niacinmg0.042
Pantothenic acidmg0.11
Vitamin B-6mg0.003
Folate, totalµg3
Folic acidµg0
Folate, foodµg3
Folate, DFEµg3
Choline, totalmg18.8
Vitamin B-12µg0.17
Vitamin B-12, addedµg0
Vitamin A, RAEµg684
Retinolµg671
Carotene, betaµg158
Carotene, alphaµg0
Cryptoxanthin, betaµg0
Vitamin A, IUIU2499
Lycopeneµg0
Lutein + zeaxanthinµg0
Vitamin E (alpha-tocopherol)mg2.32
Vitamin E, addedmg0
Tocopherol, betamg0
Tocopherol, gammamg0
Tocopherol, deltamg0
Vitamin D (D2 + D3)µg0
Vitamin D2 (ergocalciferol)µg0
Vitamin D3 (cholecalciferol)µg0
Vitamin DIU0
Vitamin K (phylloquinone)µg7
Lipids
Fatty acids, total saturatedg50.489
4:0g3.226
6:0g2.007
8:0g1.19
10:0g2.529
12:0g2.587
14:0g7.436
16:0g21.697
17:0g0.56
18:0g9.999
20:0g0.138
Fatty acids, total monounsaturatedg23.43
16:1 undifferentiatedg1.82
16:1 cg0.961
18:1 undifferentiatedg20.4
18:1 cg16.978
18:1 tg2.982
20:1g0.1
22:1 undifferentiatedg0
Fatty acids, total polyunsaturatedg3.01
18:2 undifferentiatedg1.83
18:2 n-6 c,cg2.166
18:2 CLAsg0.267
18:2 ig0.296
18:3 undifferentiatedg1.18
18:3 n-3 c,c,c (ALA)g0.315
18:4g0
20:4 undifferentiatedg0
20:5 n-3 (EPA)g0
22:5 n-3 (DPA)g0
22:6 n-3 (DHA)g0
Cholesterolmg215
Stigmasterolmg0
Campesterolmg0
Beta-sitosterolmg4
Amino Acids
Tryptophang0.012
Threonineg0.038
Isoleucineg0.051
Leucineg0.083
Lysineg0.067
Methionineg0.021
Cystineg0.008
Phenylalanineg0.041
Tyrosineg0.041
Valineg0.057
Arginineg0.031
Histidineg0.023
Alanineg0.029
Aspartic acidg0.064
Glutamic acidg0.178
Glycineg0.018
Prolineg0.082
Serineg0.046
Other
Alcohol, ethylg0
Caffeinemg0
Theobrominemg0
[Source: United States Department of Agriculture Agricultural Research Service 12)]

Table 6. Nutritional property of nut and seed butter (1 Tbsp)

ProductCalorieProteinFatCalciumZinc
(g)(g)(mg)(mg)
Almond butter1012.49.5430.5
Cashew butter932.88.070.8
Hazelnut butter942.09.5
Sunflower butter803.07.0
Sesame butter892.68.0640.7
Peanut butter
 natural943.88.070.4
 reduced fat954.06.00.4
Soy butter
 sweetened854.05.550
 unsweetened804.06.530
Soy-peanut butter502.01.240
 sweetened

Note: 1Tbsp = 14.19 g

[Source 13)]

Almond butter vs peanut butter

Almond butter has significantly more fiber, calcium, and potassium than sunflower seed or peanut butter 14). Spiller et al. 15) compared the lipid-altering effect of roasted salted almonds and roasted almond butter with that of raw almonds, as part of a plant-based diet (Table 10). High-density lipoprotein “good” cholesterol (HDL) did not significantly change with raw or roasted almonds but slightly increased with almond butter. HDL cholesterol is the good cholesterol that cruises the bloodstream and high levels HDL reduces the risk for heart disease.

The findings of this study 16)found that consumption of nuts and peanut butter was inversely associated with risk of type 2 diabetes, independent of known risk factors for type 2 diabetes, including age, obesity, family history of diabetes, physical activity, smoking, and dietary factors. Peanut butter (Arachis hypogaea) is creamy, composed of peanut paste and stabilizer. It may also contain sweetener, salt, emulsifier and other ingredients. Peanut butter is prepared by roasting, blanching, grinding and tempering. The formulation of a typical peanut butter is shown in Table 7. Good quality nuts and seed pods are sorted out and destoned before shelling. Shelled nuts are graded to ensure the sound or bold or even size nuts. Roasting is a dry heat treatment, carried out not so much for dehydration but for flavor, color and texture development 17). Roasting involves a number of physico-chemical changes including dehydration and chemical reactions. However, the development of flavor and aroma depends upon the temperature and time of roasting beside the type of nuts and techniques applied 18). Generally, for peanut butter, roasting is done at around 160 °C for 40–60 min depending upon the seed size and moisture contents 19). Roasting reduces water contents to around 1 % followed by the release of oil from the cytoplasm of the cells which increases the shelf life of peanuts and helps in developing flavor for peanut butter. Ogunsanwo et al. 20) reported that the peanut butter prepared by roasting at 160 °C for 30 min was found comparable with the commercial samples. Blanching of peanuts is done to remove the skin of the peanut. There are several blanching methods including dry, water, spin, and air impact. Dry blanching is used primarily in peanut butter production, as it removes the kernel hearts which affect peanut butter flavor. After removing the outer skin during blanching, nuts are ground into paste. Peanut butter is usually made by two stage grinding operations. First grinding reduces the nuts to a medium size and the second milling uses a very high-speed grinder cum mixer that has a combination of cutting-shearing and attrition action and reduces to a fine (less than 0.025 cm) smooth texture. Due to this several passes the paste is subjected to excessively high temperature, an elaborative cooling methods need to be utilized to retain desired flavors in the nut butter. Connick 21) states that accomplishing the grinding steps in the presence of solid carbon dioxide inhibits the dissolving, occlusion, and adsorption of free oxygen into the peanut butter and there by increases the shelf life as well as improves the flavor. Woodroof 22) classified peanut butters into three types based on the texture viz., Smooth (even texture with no perceptible grainy peanut particles), Regular (definitely grainy texture with with perceptible peanut particles not more than 1/16 in. in diameter and Chunky (partially fine and partially grainy particles with substantial amounts larger than 1/16 in. in diameter). Crippen et al. 23) reported that increased grind size (fine, medium and course), decreased the sensory smoothness, spreadability, adhesiveness and preference ratings. According to Dzurik et al. 24) the high pressure homogenization after initial grinding produces a paste of smooth, glossy, melts more rapidly in the mouth than conventional peanut butter. During grinding, the ingredients like salt, sugar, stabilizers and emulsifiers are added. Addition of salt (< 1.2 %) increased the ease of swallowing, as well as consumer preference of texture. Before grinding of nut/seeds, carbohydrates, protein and other non-fat components will be in a continuous phase. Fat cells entrapped in non-fat components will be in a discontinuous phase. After grinding into paste, fat cells ruptured and become continuous and non-fat constituents form a discontinuous phase. Once the paste is formed, continuous phase (fat/ oil) will separate from the nonfat particles. Without stabilizers, paste settles at the bottom and forms a hard layer while the oil remains on top 25). Thus, stabilizers in plant based butter prevent gravitational separation of less dense oil from solid particles during storage at ambient temperatures 26). Galvez et al. 27) reported that the peanut butter without stabilizer exhibited > 2 % oil separation after 12 weeks of storage. During conditioning to prevent oil separation, mixture is immediately chilled and the hydrogenated oil forms finely divided and sufficient amount of hard fat crystals. The amount and nature of the crystals determines the stability of the product. The rate of cooling determines the size of the crystals 28). Woodroof 29) has discussed the important considerations on type and amount of stabilizer with respect to the desired consistency and mouth feel of peanut butter, oil content and particle size. The temperature of paste during the addition of stabilizer should be more than the melting point of stabilizer to produce a more homogenized product. Thus, the recommended temperature for blending of stabilizers is 60–74 °C. Totlani and Chinnan 30) reported that the addition of 1–2 % stabilizer was found to be adequate for peanut butter stored for 3 months at 35 °C. Aryana et al. 31) and Gills and Resurreccion 32) reported that the use of blended hydrogenated rapeseed and cottonseed oils as stabilizer in peanut butter was superior to palm oil. Addition of emulsifier in the peanut butter negates stickiness so that it will not stick to the roof of the mouth. Suitable emulsifiers include lecithin and fatty mono- and diglycerides, for example, soybean mono- and diglycerides 33). Different emulsifiers affirmed as GRAS are shown in Table 8. Furthermore, for improved stability, the peanut butter should be packed at the proper temperature and it should be tempered for a minimum of 24 h before shipping. This tempering allows time for additional crystal growth and formation of a good crystalline network 34).

Table 7. Formulation of a typical peanut butter

ComponentPercentage
Peanut paste (~1 % moisture)90
Hydrogenated vegetable oil1–5
Sweetener1–6
Salt1–1.5
Emulsifier0.5–1.5
[Source 35)]

Table 8. Some food emulsifiers affirmed as GRAS

EmulsifierUS FDA (21CFR)EEC (E No.)
Diacetyl tartaric esters of monoglycerides (DATEM)184.1101E472e
Lecithin184.1400E322
Mono-and diglycerides184.1505E471
Monosodium phosphate derivatives of mono and diglycerides184.1521
[Source 36)]

Table 9. Peanut butter (raw) nutrition facts

NutrientUnitValue per 100 g
Approximates
Waterg6.5
Energykcal567
EnergykJ2374
Proteing25.8
Total lipid (fat)g49.24
Ashg2.33
Carbohydrate, by differenceg16.13
Fiber, total dietaryg8.5
Sugars, totalg4.72
Minerals
Calcium, Camg92
Iron, Femg4.58
Magnesium, Mgmg168
Phosphorus, Pmg376
Potassium, Kmg705
Sodium, Namg18
Zinc, Znmg3.27
Copper, Cumg1.144
Manganese, Mnmg1.934
Selenium, Seµg7.2
Vitamins
Vitamin C, total ascorbic acidmg0
Thiaminmg0.64
Riboflavinmg0.135
Niacinmg12.066
Pantothenic acidmg1.767
Vitamin B-6mg0.348
Folate, totalµg240
Folic acidµg0
Folate, foodµg240
Folate, DFEµg240
Choline, totalmg52.5
Betainemg0.6
Vitamin B-12µg0
Vitamin B-12, addedµg0
Vitamin A, RAEµg0
Retinolµg0
Carotene, betaµg0
Carotene, alphaµg0
Cryptoxanthin, betaµg0
Vitamin A, IUIU0
Lycopeneµg0
Lutein + zeaxanthinµg0
Vitamin E (alpha-tocopherol)mg8.33
Vitamin E, addedmg0
Vitamin D (D2 + D3)µg0
Vitamin DIU0
Vitamin K (phylloquinone)µg0
Lipids
Fatty acids, total saturatedg6.279
04:00:00g0
06:00:00g0
08:00:00g0
10:00:00g0
12:00:00g0
14:00:00g0.025
16:00:00g5.154
18:00:00g1.1
Fatty acids, total monounsaturatedg24.426
16:1 undifferentiatedg0.009
18:1 undifferentiatedg23.756
20:01:00g0.661
22:1 undifferentiatedg0
Fatty acids, total polyunsaturatedg15.558
18:2 undifferentiatedg15.555
18:3 undifferentiatedg0.003
18:04:00g0
20:4 undifferentiatedg0
20:5 n-3 (EPA)g0
22:5 n-3 (DPA)g0
22:6 n-3 (DHA)g0
Fatty acids, total transg0
Cholesterolmg0
Amino Acids
Tryptophang0.25
Threonineg0.883
Isoleucineg0.907
Leucineg1.672
Lysineg0.926
Methionineg0.317
Cystineg0.331
Phenylalanineg1.377
Tyrosineg1.049
Valineg1.082
Arginineg3.085
Histidineg0.652
Alanineg1.025
Aspartic acidg3.146
Glutamic acidg5.39
Glycineg1.554
Prolineg1.138
Serineg1.271
Other
Alcohol, ethylg0
Caffeinemg0
Theobrominemg0
Isoflavones
Daidzeinmg0.02
Genisteinmg0.24
Total isoflavonesmg0.26
Biochanin Amg0.01
Formononetinmg0
Coumestrolmg0
Proanthocyanidin
Proanthocyanidin dimersmg33.2
Proanthocyanidin trimersmg48.8
Proanthocyanidin 4-6mersmg48.1
Proanthocyanidin 7-10mersmg0
Proanthocyanidin polymers (>10mers)mg0
[Source: United States Department of Agriculture Agricultural Research Service 37)]

Is almond butter good for you?

The answer to that question is yes. Almond consumption has been shown to reduce LDL “bad” cholesterol (LDL-C) concentrations and increase HDL “good” cholesterol (HDL-C) concentrations in hyperlipidaemic individuals 38). Although almonds contain a variety of constituents that may exert cardioprotective effects through various mechanisms 39), their ability to improve blood lipid profiles and reduce coronary heart disease risk may primarily be related to their healthy fatty acid profile, which is low in saturated fats and high in monounsaturated fats (MUFA) 40), particularly oleic acid 41). Epidemiological studies suggest that diets with a high proportion of monounsaturated fatty acid (MUFA) in the form of oleic acid, such as the Mediterranean diet, reduce coronary heart disease risk 42). However, the effect of almond consumption on the serum fatty acid profile and its association with coronary heart disease risk have not been investigated.

Almond butter benefits

The results of this study 43) indicate that almond consumption favourably alters the serum fatty acid profile by increasing the proportions of oleic acid and total monounsaturated fatty acid (MUFA) and decreasing those of saturated fatty acid. These changes in the fatty acid profile are correlated with improvements in blood lipoproteins and with a decreased 10-year coronary heart disease risk. The mechanism by which almonds modify coronary heart disease risk is unclear, it has been proposed that almonds may exert an effect exogenously and endogenously. It has been proposed that dietary incorporation of almonds exogenously reduces serum cholesterol concentrations by replacing saturated fats with monounsaturated fats in the diet. In a randomized, controlled, parallel study, the saturated fats concentrations of thirty-eight hypercholesterolemic adults who consumed 100 g of raw almonds daily over a 4-week period were found to be lower 44). Furthermore, increasing monounsaturated fatty acid (MUFA) intake has been reported to be associated with an increase in HDL “good” cholesterol concentrations, as demonstrated by a randomized, controlled trial of twenty-four hypercholesterolaemic adults 45). The improvement in blood lipid profiles has generally been associated with a reduced risk of coronary heart disease. It has also been proposed that almonds may act endogenously to exert a cardioprotective effect. Dietary fatty acid are rapidly incorporated into lipoprotein lipids. Enrichment of lipoprotein particles with monounsaturated fatty acid (MUFA) at the expense of polyunsaturated fatty acid (PUFA) may enhance their resistance to oxidative stress as there are few double bonds to react with, thus potentiating the anti-atherogenic effect 46). Moreover, there may be other bioactive components in almonds that further reduce coronary heart disease risk. In addition to unsaturated fatty acids, almonds are a good source of vitamin E, fiber and phytochemicals (phenols, flavonoids, proanthocyanidins and phytosterols), arginine, Cu and Mg, which may beneficially influence coronary artery disease risk 47). Many of these nutrients may act synergistically to produce the observed favourable outcomes, although further studies are required to prove this postulation 48). Further analysis of LDL particle size may provide a better understanding of potential mechanisms by which almonds and other foods rich in monounsaturated fatty acid (MUFA) influence triglyceride concentrations.

Almonds have potential health benefits and reduce risk factors associated with type 2 diabetes, cardiovascular disease, cancer and obesity 49). Previous studies have established that almond cell walls play a crucial role in regulating nutrient bioaccessibility in the gastrointestinal tract (GIT) 50). The term ‘bioaccessibility’ is defined as the proportion of a nutrient or phytochemical compound ‘released’ from a complex food matrix during digestion and, therefore, potentially available for absorption in the gastrointestinal tract (GIT). Using a in test tube and an animal study, scientists have recently demonstrated that test meals containing almonds of different particle sizes behaved differently: the degree of lipid encapsulation affected the rate and extent of bioaccessibility in the upper GIT 51). Scientists have also demonstrated that mastication of natural raw almonds released only a small proportion (7.9%) of the total lipid and was only slightly higher for roasted almonds (11.1%) 52). The lipid release from masticated almonds was in close agreement with that predicted by a theoretical model for almond lipid bioaccessibility 53). Using a test tube model of duodenal digestion 54), it was observed that a decrease in almond particle size resulted in an increased rate and extent of lipolysis.

Novotny et al. 55) conducted a feeding study in healthy adults to determine the energy value of almonds as a representative food from a group for which the Atwater factors may overestimate the energy value. They showed that only 76% of the energy contained within almonds (based on the Atwater factors) was actually metabolised 56). Furthermore, when calculating the metabolisable energy  of whole natural almonds, whole roasted almonds, chopped almonds and almond butter, it was demonstrated that the number of calories absorbed was dependent on the form in which almonds were consumed.

It is known that processing of nuts, such as roasting, chopping and grinding, impacts mastication, particle size and lipid bioaccessibility 57). The decrease in size of almond particles, with consequent reduction of intact cell walls, determines the rate and extent of lipid bioaccessibility during digestion. It is interesting to note that there was limited lipid digestibility for natural raw almonds and roasted almonds during mastication. In almond butter from roasted almonds, all the intracellular lipids made available by cell-wall rupture, as well as the lipid molecules present at the interface and within the continuous lipid phase are readily available for absorption. The exposure of the remaining intact almond particles to mastication resulted in a further small release of lipid. Cassady et al. 58) reported important differences in appetitive and hormone responses after mastication of almonds. Gebauer et al. 59) have recently reported that the number of calories absorbed from almonds in the gastrointestinal tract is strictly dependent on the form in which they are consumed. As a result of incomplete macronutrient loss in the upper gastrointestinal tract, it is believed that a large proportion of nutrients from almonds reaches the large bowel, where it is fermented by the microbiota 60). Incomplete rupturing of the cell walls during mastication results in macronutrient encapsulation, which remain inaccessible to digestive enzymes and, if not fermented in the colon, are excreted in feces.

Table 10. Composition of raw and processed almonds per 100g edible portion

Raw AlmondsRoasted AlmondsAlmond Butter
Water (g)4.21.32.1
Protein (g)25.325.424.6
Total lipid (g)49.552.555.7
MUFA (g)30.732.132.7
PUFA (g)10.611.413.8
SFA (g)3.53.73.9
Carbohydrate (g)17.918.514.5
Dietary fiber (g)13.911.810.5
Vitamin E (mg ATE)25.325.523.6
Phytosterols (mg)113.6125.8145.1
Sodium (mg)<10209<10
[Source 61)]

Unsaturated fats

Unsaturated fats, which are liquid at room temperature, are considered beneficial fats because they can improve blood cholesterol levels, ease inflammation, stabilize heart rhythms, and play a number of other beneficial roles. Unsaturated fats are predominantly found in foods from plants, such as vegetable oils, nuts, and seeds.

There are two types of “good” unsaturated fats:

1. Monounsaturated fats are found in high concentrations in:

  • Nuts such as almonds, hazelnuts, and pecans
  • Seeds such as pumpkin and sesame seeds
  • Olive, peanut, and canola oils
  • Avocados

2. Polyunsaturated fats are found in high concentrations in:

  • Sunflower, corn, soybean, and flaxseed oils
  • Walnuts
  • Flax seeds
  • Fish
  • Canola oil – though higher in monounsaturated fat, it’s also a good source of polyunsaturated fat.

Omega-3 fats are an important type of polyunsaturated fat. The body can’t make these, so they must come from food.

An excellent way to get omega-3 fats is by eating fish 2-3 times a week.

Good plant sources of omega-3 fats include flax seeds, walnuts, and canola or soybean oil.

Higher blood omega-3 fats are associated with lower risk of premature death among older adults, according to a study 62).

Most people don’t eat enough healthful unsaturated fats. The American Heart Association suggests that 8-10 percent of daily calories should come from polyunsaturated fats, and there is evidence that eating more polyunsaturated fat—up to 15 percent of daily calories—in place of saturated fat can lower heart disease risk 63).

Dutch researchers conducted an analysis of 60 trials that examined the effects of carbohydrates and various fats on blood lipid levels. In trials in which polyunsaturated and monounsaturated fats were eaten in place of carbohydrates, these good fats decreased levels of harmful LDL and increased protective HDL 64).

More recently, a randomized trial known as the Optimal Macronutrient Intake Trial for Heart Health (OmniHeart) showed that replacing a carbohydrate-rich diet with one rich in unsaturated fat, predominantly monounsaturated fats, lowers blood pressure, improves lipid levels, and reduces the estimated cardiovascular risk 65).

foods with healthy fats

Saturated Fats

All foods containing fat have a mix of specific types of fats. Even healthy foods like chicken and nuts have small amounts of saturated fat, though much less than the amounts found in butter, ghee, coconut oil, beef, cheese and ice cream. Saturated fat is mainly found in animal foods, but a few plant foods are also high in saturated fats, such as coconut, coconut oil, palm oil, and palm kernel oil.

  • The Dietary Guidelines for Americans recommends getting less than 10 percent of calories each day from saturated fat 66).
  • The American Heart Association goes even further, recommending limiting saturated fat to no more than 7 percent of calories 67).
  • Cutting back on saturated fat will likely have no benefit, however, if people replace saturated fat with refined carbohydrates. Eating refined carbohydrates in place of saturated fat does lower “bad” LDL cholesterol, but it also lowers the “good” HDL cholesterol and increases triglycerides. The net effect is as bad for the heart as eating too much saturated fat.

In the United States, the biggest sources of saturated fat 68) in the diet are:

  • Pizza and cheese
  • Whole and reduced fat milk, butter and dairy desserts
  • Meat products (sausage, bacon, beef, hamburgers)
  • Cookies and other grain-based desserts
  • A variety of mixed fast food dishes

Though decades of dietary advice 69) suggested saturated fat was harmful, in recent years that idea has begun to evolve. Several studies suggest that eating diets high in saturated fat do not raise the risk of heart disease, with one report analyzing the findings of 21 studies that followed 350,000 people for up to 23 years.

Investigators looked at the relationship between saturated fat intake and coronary heart disease (coronary artery disease), stroke, and cardiovascular disease. Their controversial conclusion: “There is insufficient evidence from prospective epidemiologic studies to conclude that dietary saturated fat is associated with an increased risk of coronary heart disease, stroke, or cardiovascular disease” 70).

A well-publicized 2014 study questioned the link between saturated fat and heart disease, but nutrition experts determined the paper to be seriously misleading. In order to set the record straight, Harvard School of Public Health convened a panel of nutrition experts and held a teach-in, “Saturated or not: Does type of fat matter?“

The overarching message is that cutting back on saturated fat can be good for health if people replace saturated fat with good fats, especially, polyunsaturated fats 71), 72). Eating good fats in place of saturated fat lowers the “bad” LDL cholesterol, and it improves the ratio of total cholesterol to “good” HDL cholesterol, lowering the risk of heart disease.

Eating good fats in place of saturated fat can also help prevent insulin resistance, a precursor to diabetes 73). So while saturated fat may not be as harmful as once thought, evidence clearly shows that unsaturated fat remains the healthiest type of fat.

Trans Fats

Trans fatty acids, more commonly called trans fats, are made by heating liquid vegetable oils in the presence of hydrogen gas and a catalyst, a process called hydrogenation.

Partially hydrogenating vegetable oils makes them more stable and less likely to become rancid. This process also converts the oil into a solid, which makes them function as margarine or shortening.

Partially hydrogenated oils can withstand repeated heating without breaking down, making them ideal for frying fast foods.

For these reasons, partially hydrogenated oils became a mainstay in restaurants and the food industry – for frying, baked goods, and processed snack foods and margarine.

Partially hydrogenated oil is not the only source of trans fats in our diets. Trans fats are also naturally found in beef fat and dairy fat in small amounts.

Eliminating industrial-produced trans fats from the U.S. food supply could prevent between 6 and 19 percent of heart attacks and related deaths, or as much as 200,000 each year 74).

Trans fats are worse for cholesterol levels than saturated fats because they:

  • Raise bad LDL “bad” cholesterol and lower good HDL “good” cholesterol
  • Create inflammation 75) – a reaction related to immunity – which has been implicated in heart disease, stroke, diabetes, and other chronic conditions
  • Contribute to insulin resistance 76)
  • Can have harmful health effects even in small amounts – for each additional 2 percent of calories from trans fat consumed daily, the risk of coronary heart disease increases by 23 percent.

Eliminating trans fats from food

In the 1990s, the average American was eating about 6 grams of trans fats a day; ideally that should be under 1 gram a day, and zero from partially hydrogenated oils is best 77).

A 2006 labeling law required food companies to list trans fats on food labels. This caused many food makers to switch to using trans-fat-free oils and fats in their products, resulting in a reduction of trans fat levels in the U.S. food supply.

A study from the Centers for Disease Control and Prevention 78) found that Americans’ blood-levels of trans fats dropped 58 percent from 2000 to 2009—evidence that the labeling law has had its desired effect.

A survey of 83 major-brand grocery store products and restaurant dishes offers encouraging news: When most of these food makers reformulated their products, they cut back on trans fat without increasing saturated fat 79).

If a product contains less than half a gram of trans fat and a half gram of saturated fat per serving, it can still be labeled as “trans fat-free.” So while many products in the United States are labeled “trans fat-free,” those products may still contain a small amount of trans fat.

In June 2015 the FDA announced its decision to ban artificial trans fat in the food supply. Food manufacturers in the U.S. will have three years to remove partially hydrogenated oils — the primary source of artificial trans fat — from products.

While we’re making progress in the United States, trans-fat intake is widely used in some developing nations. Inexpensive partially hydrogenated soybean oil and palm oil have become staples not only for the food industry but also for home use. This shift away from traditional cooking oils and toward trans-rich partially hydrogenated oils is contributing to the growing epidemic of cardiovascular disease in developing nations around the world.

References   [ + ]

read more
Health Jade