Weight Loss

Running for weight loss

running for weight loss

Running for beginners weight loss

Physical activity including running is an important part of your weight management program. Running can be a fun and flexible way to exercise – it can help keep you in shape and help you lose weight too. However, most weight loss occurs because of decreased calorie intake. That’s because it’s easier to cut 500 calories a day from your diet than it is to burn 500 extra calories through running. You’d have to run about five miles a day for a week to lose one pound of fat! Jogging uses roughly 100 calories per mile. Precisely how many calories you’ll burn depends on a number of things, including your weight and how fast you run. So you’d lose about one pound for every extra 35 miles you run — provided you don’t change anything about your current food intake or other activities. To lose one pound by running, you need to burn approximately 3,500 calories. If you run slowly (at a pace of 4 miles per hour) for 30 minutes on five out of seven days, you’ll log 10 miles a week. That means it would take three-and-a-half weeks to lose one pound if the number of calories you consume stays the same. On the other hand if you simply altered your diet and cut back by 250 calories a day (e.g., ½ cup of ice cream or two sugar-sweetened sodas), you’d lose a pound in two weeks. If you ate 250 fewer calories a day and run for 30 minutes a day, it would take just over a week to lose one pound. Reducing calorie intake even more and exercising more would further speed the process. Therefore, a better strategy for weight loss involves a two-pronged approach: exercising and cutting calories.

Weight stability requires a balance between calories consumed (calories IN) and calories expended (calories Out). Managing calorie intake is fundamental to achieving and maintaining calorie balance—the balance between the calories intake from foods and the calories expended from metabolic processes and physical activity. The best way to determine whether your eating pattern is at an appropriate number of calories is to monitor your body weight and adjust your calorie intake and energy expenditure in physical activity based on changes in your body weight over time.

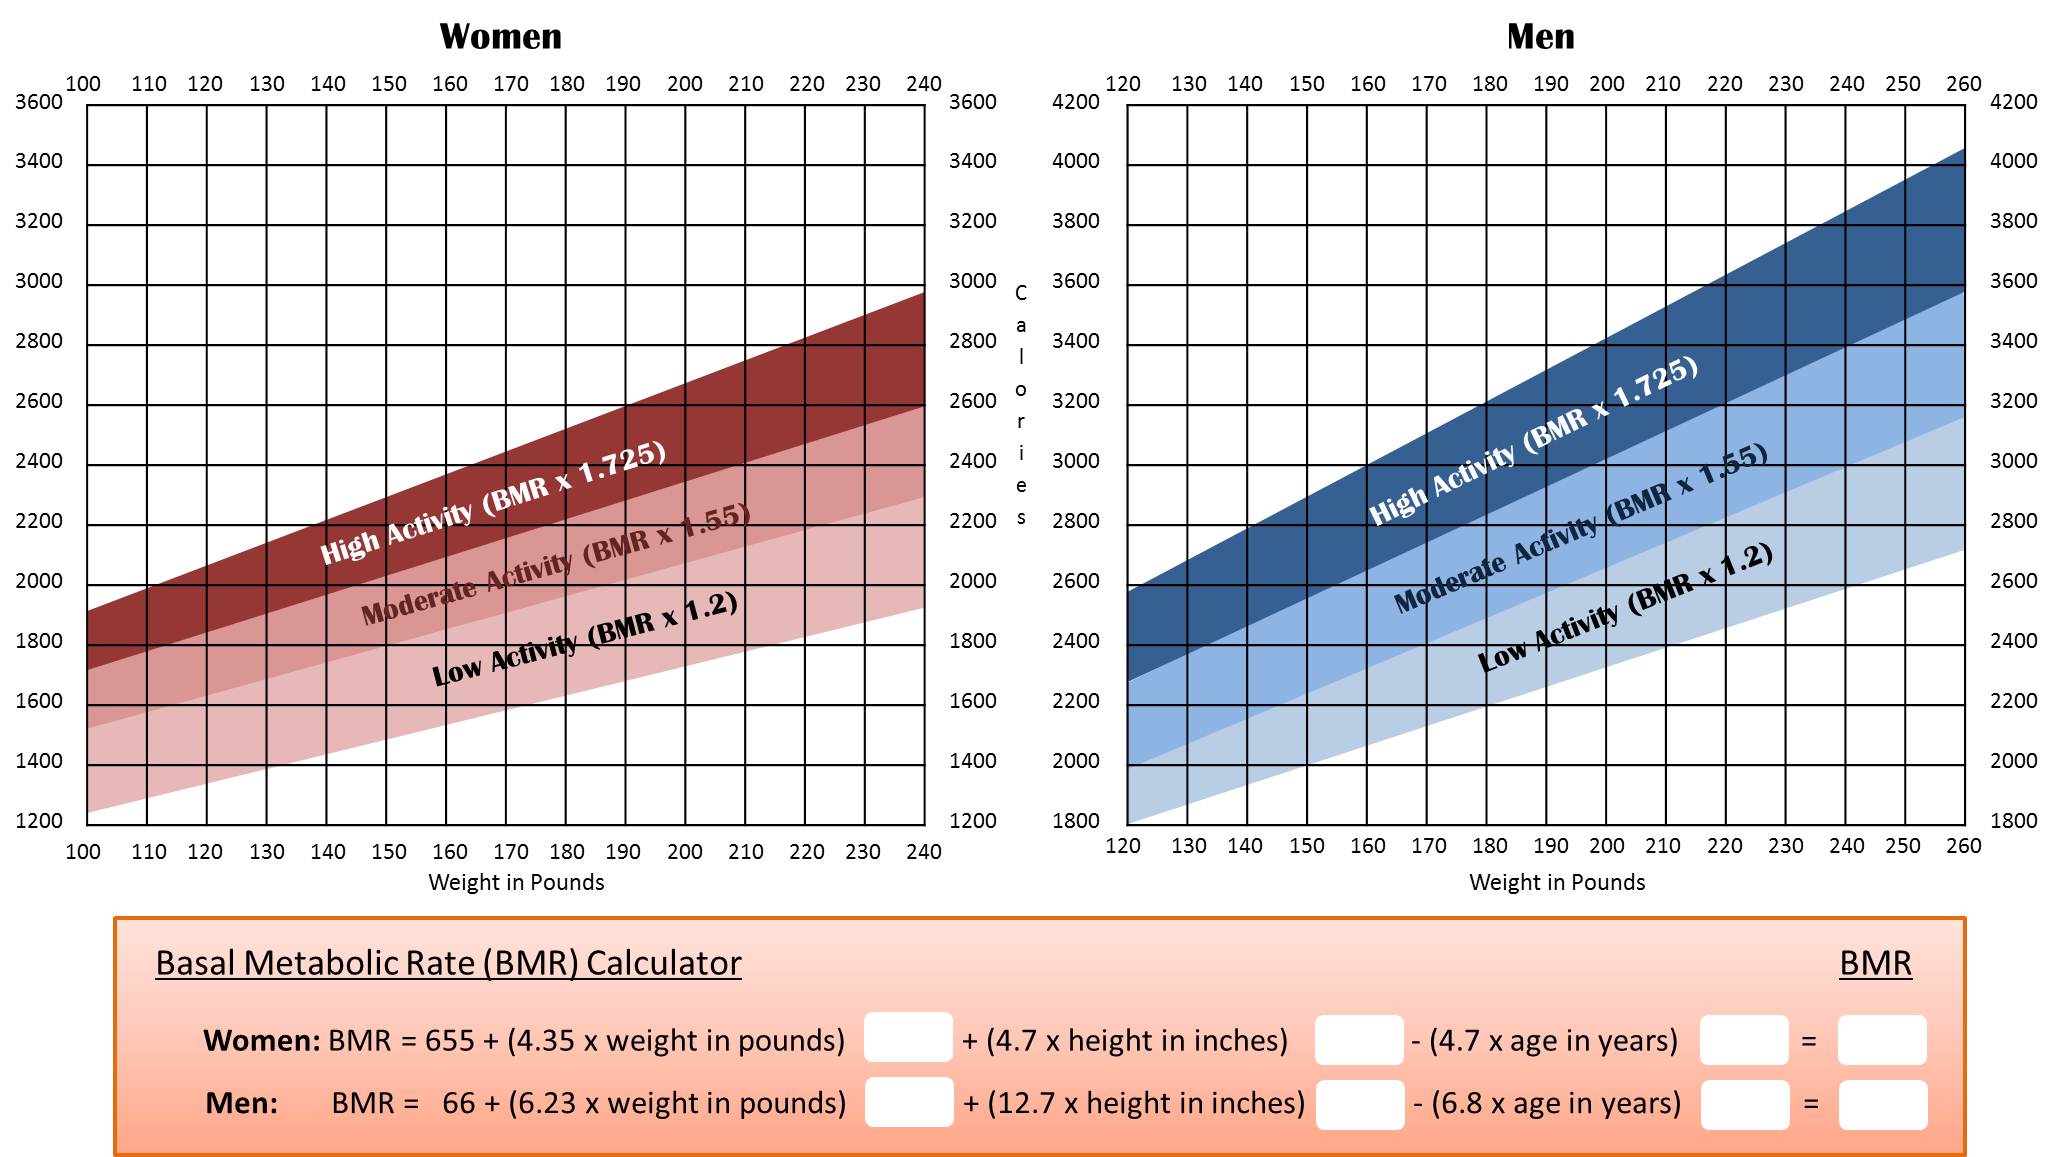
All foods and many beverages contain calories, and the total number of calories varies depending on the macronutrients in a food. On average, carbohydrates and protein contain 4 calories per gram (17 kJ/g), fats contain 9 calories per gram (37 kJ/g) and alcohol (ethanol) has 7 calories per gram (29 kJ/g) and organic acid 3 calories per gram (13 kJ/g). The total number of calories you need each day varies depending on a number of factors, including the your age, sex, height, weight, your build (muscular or athletic or average or overweight) and level of physical activity. In addition, a need to lose, maintain, or gain weight and other factors affect how many calories should be consuming.

The Department of Health and Human Services recommends that healthy adults include aerobic exercise and strength training in their fitness plans, specifically:

  • At least 150 minutes of moderate aerobic activity or 75 minutes of vigorous aerobic activity a week, or an equivalent combination of moderate and vigorous aerobic activity
  • Strength training exercises of all the major muscle groups at least twice a week

Sustained physical activity is most helpful in the prevention of weight regain. In addition, exercise has a benefit of reducing risks of cardiovascular disease and diabetes, beyond that produced by weight reduction alone.

  • Regular exercise has been proven to help you to reduce the risk of chronic illnesses such as heart disease, certain cancers, type 2 diabetes and stroke.
  • Regular exercise can help strengthen your bones and muscles.
  • Research shows that physical activity can also boost self-esteem, mood, sleep quality and energy.

Start exercising slowly, and gradually increase the intensity. Trying too hard at first can lead to injury.

How Much Activity Do People Need to Prevent Weight Gain?

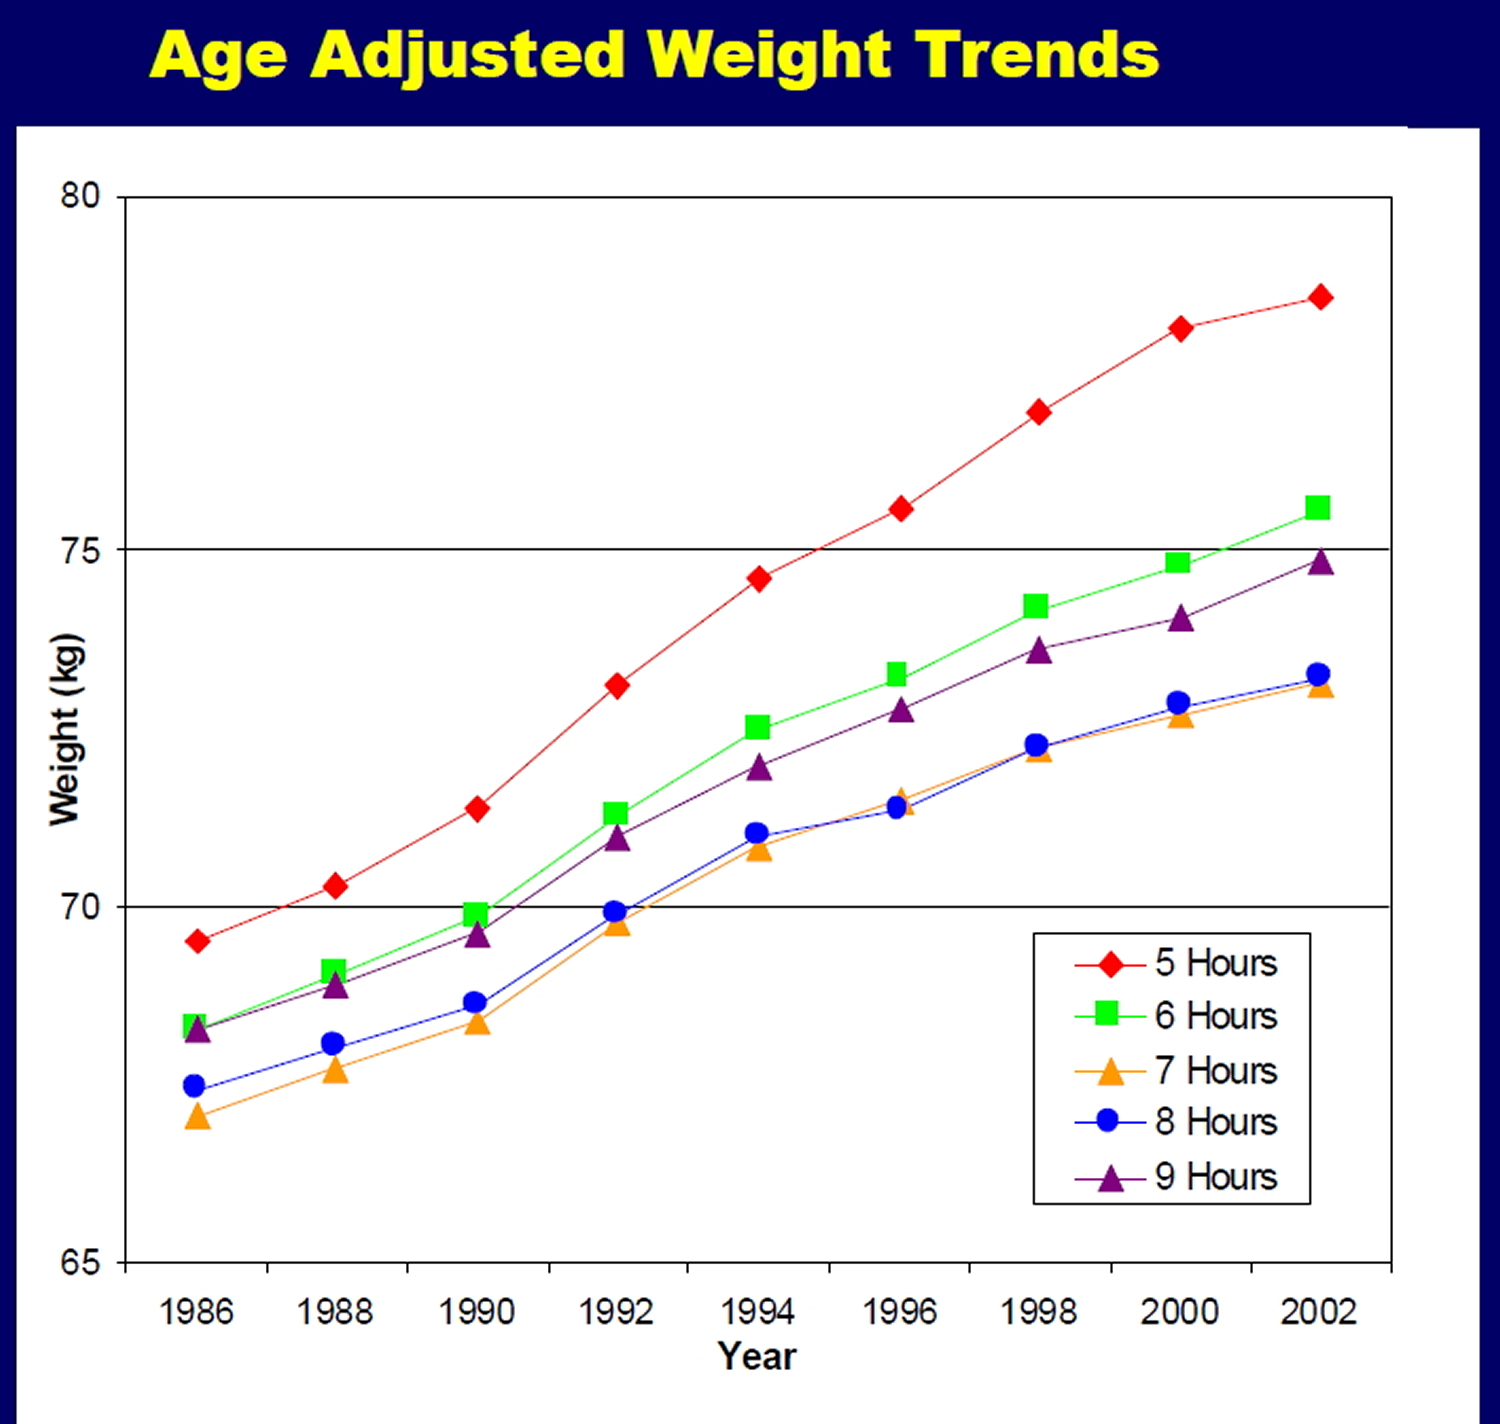
Weight gain during adulthood can increase the risk of heart disease, diabetes, and other chronic conditions. Since it’s hard for people to lose weight and keep it off, it’s better to prevent weight gain in the first place. Encouragingly, there’s strong evidence that staying active can help people slow down or stave off “middle-age spread” 1). The more active people are, the more likely they are to keep their weight steady 2); the more sedentary, the more likely they are to gain weight over time 3). But it’s still a matter of debate exactly how much activity people need to avoid gaining weight. The latest evidence suggests that the recommended two and a half hours a week may not be enough.

The Women’s Health Study, for example, followed 34,000 middle-age women for 13 years to see how much physical activity they needed to stay within 5 pounds of their weight at the start of the study. Researchers found that women in the normal weight range at the start needed the equivalent of an hour a day of moderate-to-vigorous physical activity to maintain a steady weight 4).

Vigorous activities seem to be more effective for weight control than slow walking 5), 6). The Nurses’ Health Study II 7), for example, followed more than 18,000 women for 16 years to study the relationship between changes in physical activity and weight. Although women gained, on average, about 20 pounds over the course of the study, those who increased their physical activity by 30 minutes per day gained less weight than women whose activity levels stayed steady. And the type of activity made a difference: Bicycling and brisk walking helped women avoid weight gain, but slow walking did not.

How Much Activity Do People Need to Lose Weight?

Exercise can help promote weight loss, but it seems to work best when combined with a lower calorie eating plan 8). If people don’t curb their calories, however, they likely need to exercise for long periods of time-or at a high intensity-to lose weight 9), 10).

In one study 11), for example, researchers randomly assigned 175 overweight, inactive adults to either a control group that did not receive any exercise instruction or to one of three exercise regimens-low intensity (equivalent to walking 12 miles/week), medium intensity (equivalent to jogging 12 miles/week), or high intensity (equivalent to jogging 20 miles per week). All study volunteers were asked to stick to their usual diets. After six months, those assigned to the high-intensity regimen lost abdominal fat, whereas those assigned to the low- and medium-intensity exercise regimens had no change in abdominal fat 12).

More recently, researchers conducted a similar trial with 320 post-menopausal women 13), randomly assigning them to either 45 minutes of moderate-to-vigorous aerobic activity, five days a week, or to a control group. Most of the women were overweight or obese at the start of the study. After one year, the exercisers had significant decreases in body weight, body fat, and abdominal fat, compared to the non-exercisers 14).

The Bottom Line

  • For Weight Control, Aim for an Hour of Activity a Day

Being moderately active for at least 30 minutes a day on most days of the week can help lower the risk of chronic disease. But to stay at a healthy weight, or to lose weight, most people will need more physical activity-at least an hour a day-to counteract the effects of increasingly sedentary lifestyles, as well as the strong societal influences that encourage overeating.

Keep in mind that staying active is not purely an individual choice: The so-called “built environment”-buildings, neighborhoods, transportation systems, and other human-made elements of the landscape-influences how active people are 15). People are more prone to be active, for example, if they live near parks or playgrounds, in neighborhoods with sidewalks or bike paths, or close enough to work, school, or shopping to safely travel by bike or on foot. People are less likely to be active if they live in sprawling suburbs designed for driving or in neighborhoods without recreation opportunities.

Local and state governments wield several policy tools for shaping people’s physical surroundings, such as planning, zoning, and other regulations, as well as setting budget priorities for transportation and infrastructure. Strategies to create safe, active environments include curbing traffic to make walking and cycling safer, building schools and shops within walking distance of neighborhoods, and improving public transportation, to name a few. Such changes are essential to make physical activity an integral and natural part of people’s everyday lives-and ultimately, to turn around the obesity epidemic.

How much exercise do you need for general good health?

For general good health, the 2008 Physical Activity Guidelines for Americans 16) recommends that adults get a minimum of 2-1/2 hours per week of moderate-intensity aerobic activity. Yet many people may need more than 2-1/2 hours of moderate intensity activity a week to stay at a stable weight 17).

The Women’s Health Study 18), for example, followed 34,000 middle-aged women for 13 years to see just how much physical activity they needed to stay within 5 pounds of their weight at the start of the study. Researchers found that women who were in the normal weight range at the start of the study needed the equivalent of an hour a day of physical activity to stay at a steady weight 19).

If you are exercising mainly to lose weight, 60 minutes or so a day may be effective in conjunction with a healthy diet 20).

If you currently don’t exercise and aren’t very active during the day, any increase in exercise or physical activity is good for you.

Aerobic physical activity—any activity that causes a noticeable increase in your heart rate—is especially beneficial for disease prevention.

Some studies show that walking briskly for even one to two hours a week (15 to 20 minutes a day) starts to decrease the chances of having a heart attack or stroke, developing diabetes, or dying prematurely.

You can combine moderate and vigorous exercise over the course of the week, and it’s fine to break up your activity into smaller bursts as long as you sustain the activity for at least 10 minutes.

Exercise Intensity:

Moderate-intensity aerobic activity is any activity that causes a slight but noticeable increase in breathing and heart rate. One way to gauge moderate activity is with the “talk test”—exercising hard enough to break a sweat but not so hard you can’t comfortably carry on a conversation.

Vigorous-intensity aerobic activity causes more rapid breathing and a greater increase in heart rate, but you should still be able to carry on a conversation—with shorter sentences.

Here is a summary of the 2008 Physical Activity Guidelines for Americans 21)

Children and adolescents should get at least 1 hour or more a day of physical activity in age-appropriate activities, spending most of that engaged in moderate- or vigorous–intensity aerobic activities. They should partake in vigorous-intensity aerobic activity on at least three days of the week, and include muscle-strengthening and bone strengthening activities on at least three days of the week.

Healthy adults should get a minimum of 2-1/2 hours per week of moderate-intensity aerobic activity, or a minimum of 1-1/4 hours per week of vigorous-intensity aerobic activity, or a combination of the two. That could mean a brisk walk for 30 minutes a day, five days a week; a high-intensity spinning class one day for 45 minutes, plus a half hour jog another day; or some other combination of moderate and vigorous activity. Doubling the amount of activity (5 hours moderate- or 2-1/2 hours vigorous-intensity aerobic activity) provides even more health benefits. Adults should also aim to do muscle-strengthening activities at least two days a week.

Healthy older Adults should follow the guidelines for healthy adults. Older adults who cannot meet the guidelines for healthy adults because of chronic conditions should be as physically active as their abilities and conditions allow. People who have chronic conditions such as arthritis and type 2 diabetes should talk to a healthcare provider about the amount and type of activity that is best. Physical activity can help people manage chronic conditions, as long as the activities that individuals choose match their fitness level and abilities. Even just an hour a week of activity has health benefits. Older adults who are at risk of falling should include activities that promote balance.

Strength training for all ages

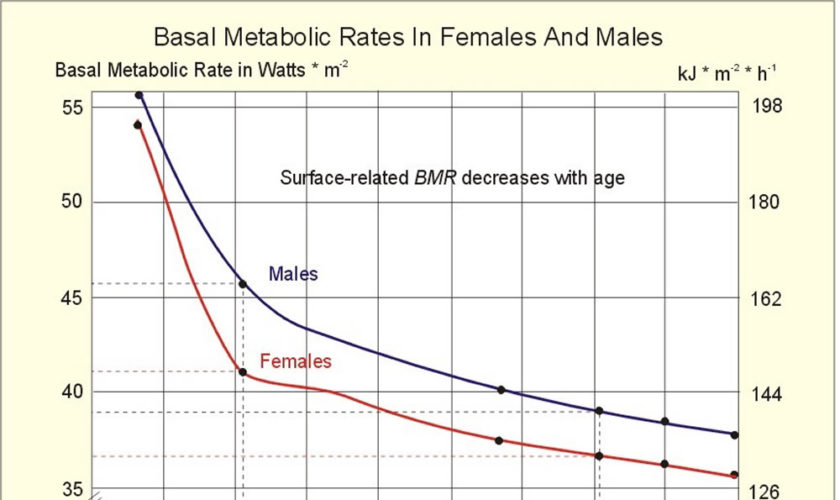
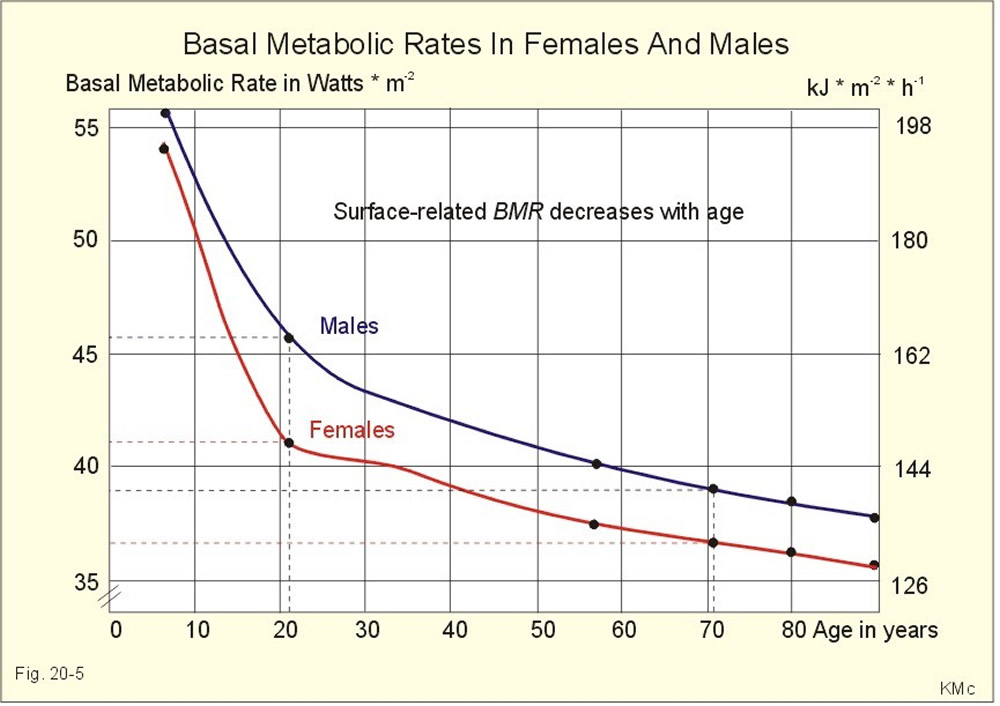
Studies have shown strength training to increase lean body mass, decrease fat mass, and increase resting metabolic rate (a measurement of the amount of calories burned per day) in adults 22). While strength training on its own typically does not lead to weight loss 23), its beneficial effects on body composition may make it easier to manage one’s weight and ultimately reduce the risk of disease, by slowing the gain of fat—especially abdominal fat 24).

  • Muscle is metabolically active tissue; it utilizes calories to work, repair, and refuel itself. Fat, on the other hand, doesn’t use as much energy. We slowly lose muscle as part of the natural aging process, which means that the amount of calories we need each day starts to decrease, and it becomes easier to gain weight.
  • Strength training regularly helps preserve lean muscle tissue and can even rebuild some that has been lost already.
  • Weight training has also been shown to help fight osteoporosis. For example, a study in postmenopausal women examined whether regular strength training and high-impact aerobics sessions would help prevent osteoporosis. Researchers found that the women who participated in at least two sessions a week for three years were able to preserve bone mineral density at the spine and hip; over the same time period, a sedentary control group showed bone mineral density losses of 2 to 8 percent 25).
  • In older populations, resistance training can help maintain the ability to perform functional tasks such as walking, rising from a chair, climbing stairs, and even carrying one’s own groceries. An emerging area of research suggests that muscular strength and fitness may also be important to reducing the risk of chronic disease and mortality, but more research is needed 26), 27).
  • A systematic review of 8 studies 28) examining the effects of weight-bearing and resistance-based exercises on the bone mineral density in older men found resistance training to be an effective strategy for preventing osteoporosis in this population. Resistance training was found to have more positive effects on bone mineral density than walking, which has a lower impact 29).

The Physical Activity Guidelines for Americans recommends that muscle strengthening activities be done at least two days a week 30). Different types of strength training activities are best for different age groups.

  • When talking about the benefits of exercise, keeping the heart and blood vessels healthy usually gets most of the attention. For many individuals, though, stretching and strength training exercises may be just as important.
  • Strength training, also known as resistance training, weight training, or muscle-strengthening activity, is one of the most beneficial components of a fitness program.

Children and Adolescents: Choose unstructured activities rather than weight lifting exercises 31).

Examples:

  • Playing on playground equipment
  • Climbing trees
  • Playing tug-of-war

Active Adults: Weight training is a familiar example, but there are other options 32):

  • Calisthenics that use body weight for resistance (such as push-ups, pull-ups, and sit-ups)
  • Carrying heavy loads
  • Heavy gardening (such as digging or hoeing)

Older Adults: The guidelines for older adults are similar to those for adults; older adults who have chronic conditions should consult with a health care provider to set their activity goals. Muscle strengthening activities in this age group include the following 33):

  • Digging, lifting, and carrying as part of gardening
  • Carrying groceries
  • Some yoga and tai chi exercises
  • Strength exercises done as part of a rehab program or physical therapy

Flexibility training

Flexibility training or stretching exercise is another important part of overall fitness. It may help older adults preserve the range of motion they need to perform daily tasks and other physical activities 34).

  • The American Heart Association 35) recommends that healthy adults engage in flexibility training two to three days per week, stretching major muscle and tendon groups.
  • For older adults, the American Heart Association and American College of Sports Medicine recommend two days a week of flexibility training, in sessions at least 10 minutes long 36). Older adults who are at risk of falling should also do exercises to improve their balance.

Running tips for beginners

Running is free, you can do it anywhere, and it burns more calories than any other mainstream exercise. Regular running can reduce your risk of chronic illnesses, such as heart disease, type 2 diabetes and stroke. It can also boost your mood and keep your weight under control.

However, if you feel out of shape, or you’re recovering from injury or worried about an existing condition, see your doctor before you start running.

Before you start

If you’ve not been active for a while, you may want to build your fitness levels gently with walking before you move on to running. Sometimes overlooked as the easiest ways to get more active, walking briskly can help you build stamina, burn excess calories, lose weight and make your heart healthier. Plus walking is simple, free, and walking is also less stressful on your knees, hips and back than is running.  You don’t have to walk for hours. A brisk 10-45 minute daily walk has lots of health benefits and counts towards your recommended 150 minutes of weekly exercise.

Running requires little equipment, but a good pair of running shoes that suit your foot type may help improve comfort.

There are many types of trainers on the market, so get advice from a specialist running retailer who will assess your foot and find the right shoe for you.

The shoe’s structure weakens over time, especially with regular use. Running experts advise replacing running shoes every 300 miles (482km).

Choosing running shoes and trainers

Running shoes are probably the most important piece of fitness equipment you’ll buy, so it’s vital to pick the right pair.

There are big differences in the way various running shoes support your feet. This means it’s not good for your feet if you play football or tennis in the same trainers you use for jogging, for example.

Running shoes are great for running and only running. They’re very flexible, allowing the foot to bend and flex through each step, but they’re not suitable for sports such as tennis that involve sideways stepping.

There are many types of trainers on the market, so try to find a specialist retailer who will assess your foot and find the right shoe for you. Good specialist running shoe retailers will offer gait analysis to get you in the right type of running shoe.

There are a number of companies that make ‘functional footwear’ for running rather than fashion-based footwear. There is also a multitude of trainers with differing amounts of support to suit different foot types. Find a specialist retailer who can assess your foot properly and fit the correct type of runner for your foot type.

It’s a good idea to get your running shoes properly fitted to suit your foot type. If they’re too small, they can cause blisters and black toenails.

Serious back, knee and hip pain, Achilles tendonitis, shin splints (leg pain), traumatized toes and painful blisters are some of the conditions people wearing ill-fitting running shoes may face.

Unfortunately, 65% of the US’s recreational sportsmen and women wear the wrong shoes for their chosen sport. Running shoes and trainers are the most important piece of fitness equipment you’ll ever buy, and changing what you wear on your feet can prevent injuries.

Specialist retailers should also be able to advise you on specialist socks that have improved fit, wick sweat away from the foot, prevent blisters and some even have silver threads to reduce smell and prevent athlete’s foot infections.

Quick tips to remember when shoe shopping

  1. Make sure you can wiggle your toes a little.
  2. Try on both shoes and walk a few steps to see if they pinch or rub.
  3. Leave 1cm of room from the top of your longest toe to end of the shoe.
  4. Feet are usually biggest in the late afternoon/evening.

Quick tips on socks

Good socks will not only help keep your feet comfortable within your shoes but will also keep them dry by drawing moisture away from the feet. Whatever you do, don’t wear 100% cotton socks – they hold the moisture against the skin, causing painful blistering. Wool and silk are often found blended with the latest generation of synthetic materials. If you find wool too warm or irritating, you could try an acrylic blended sock.

How running impacts on the foot

Whether you are running for fun, weight loss or running a marathon, you put yourself and your feet under great stress. On average, you put six times your body weight through each foot when running, which can emphasize any minor or major potential problems significantly.

Maintaining healthy feet for running

Keep your feet clean and dry to prevent blisters. Ensure you shower and dry your feet thoroughly after you have been for a run, to prevent athlete’s foot. Change your trainers every 300-500 miles, to prevent general pain from lack of cushioning or reduction of support. Trainers do not last forever.

Choosing well-fitted sports bra

How a well-fitted sports bra can reduce breast pain

Women should also consider using a sports bra, which is sturdier than a regular bra and provides additional support. The movement of a woman’s breasts during exercise can range from 4cm during a walk to 15cm when running, researchers have found. The exact mechanics are not entirely understood, but it’s thought exercise, especially high-impact exercise like running or jumping, places tension on the supporting structures of the breast, this multi-directional movement can cause breast pain. Not only can exercising with poorly supported breasts cause pain and sagging, it can cause embarrassment and put women off physical activity. A survey by the University of Portsmouth – Research Group in Breast Health 37) found breasts were the fourth biggest barrier to exercise for women after lack of motivation, time and poor health. Exercising with a well-fitted sports bra is just as important as running in the right type of trainers!

What’s the problem with bras?

Research suggests most women – perhaps more than 70% – wear the wrong bra size. This may result in pain, discomfort and irreversible sagging.

A researcher from the University of Portsmouth – Research Group in Breast Health 38), says women need better advice on getting the right fit. “The most common mistake is to wear the underband too loose and the cup size too small.” It’s important women find the best fit sports bra, rather than using a tape measure to dictate their bra size.

Why do breasts sag?

There are no muscles in the breast. The only supporting structures are the skin and the Cooper’s ligaments – thin, paper-like tissues that weave throughout the breast and attach to the chest wall. It’s thought sagging, which is irreversible, occurs when these ligaments are overstretched.

How do breasts move during exercise?

The breast has limited natural support, and any unsupported movement causes the breasts to move: up-down, in-out, and side-to-side. This multi-directional movement has been shown to increase from 4cm during walking to 15cm during running in a study of women exercising without a bra. And breast motion is not just an issue for larger-breasted women.

Which sports bra is right for me?

There are three types of sports bra:

  1. Compression (pushing the breast against the chest),
  2. Encapsulation (lifting and separating each breast) or
  3. A combination of both.

Not every sports bra suits every person, and wearing the wrong size or style can reduce support. You should always try on a sports bra before you buy it. Jump around in the fitting room to make sure it is giving you the support you need for your chosen activity.

  • It’s essential that a sports bra fits properly for it to be effective.

Whether it’s for exercise or not, a correctly fitting and supportive bra can alleviate breast pain and help prevent back and neck pain, as well as irreversible breast sag.

The University of Portsmouth – Research Group in Breast Health 39) recommends these simple steps for choosing the right sports bra:

  • Underband: the band should fit firmly around the chest. It shouldn’t slide around as you move, but it shouldn’t be too tight as to be uncomfortable, affect your breathing, or make flesh bulge over the band. The band should be level all the way around the chest.
  • Cup: the breasts should be enclosed within the cups, with no bulging or gaping at the top or sides. If the cup material is puckering, then the cup size is probably too big.
  • Shoulder straps: the shoulder straps should be adjusted to comfortably provide breast support without being too tight (digging into the skin). The main support for the breast should come from a firm band, not tight shoulder straps.
  • Underwire: for sports bras that are underwired, the underwire should follow the natural crease of the breasts and not rest on any breast tissue. If the underwire is resting too far down the ribcage (where the rib cage gets slightly narrower), the band size is probably too small.

When should I wear a sports bra?

A well-fitted, supportive sports bra is just as important for occasional exercise as it is for regular exercise. It’s also important for all types of physical activity, including both low- and high-impact activities, and exercise of short and long duration.

How often should I replace my sports bra?

It’s important to replace your sports bra regularly to make sure it’s still giving you the best support it can. How often you need to replace your bra will depend on a number of factors, including how often you wear it and how often you wash it. The University of Portsmouth – Research Group in Breast Health 40) recommends you replace your sports bra when you replace your running shoes.

How to run correctly

Good running technique can help reduce your risk of injury and make your runs feel less tiring and more enjoyable.

To avoid injury and enjoy the experience, it’s essential to ease yourself into running slowly and increase your pace and distance gradually over several outings.

Start each run with a gentle warm-up of at least five minutes. This can include quick walking, marching on the spot, knee lifts, side stepping and climbing stairs.

Start walking for an amount of time that feels comfortable.

When you first start out, try alternating between running and walking during your session.

As time goes on, make the running intervals longer until you no longer feel the need to walk.

Regular running for beginners means getting out at least twice a week. Your running will improve as your body adapts to the consistent training stimulus.

It’s better to run twice a week, every week, than to run six times one week and then do no running for the next three weeks.

Stretching and flexibility

As a general rule, stretch your major muscle groups after you exercise. In some studies, stretching right before an athletic event has been shown to decrease athletic performance, especially before activities requiring ballistic movements, jumping or running.

Overall, however, stretching after exercise can help you to optimize your joint range of motion. If you don’t exercise regularly, you may want to stretch a few times a week after a brief warmup to maintain flexibility.

When you’re stretching, keep it gentle. Breathe freely as you hold each stretch for around 30 seconds. Try not to hold your breath. Don’t bounce or hold a painful stretch. Expect to feel tension while you’re stretching. If you feel pain, you’ve gone too far.

Keep your head straight

Look straight ahead of you, about 30 to 40 meters out in front, and avoid looking down at your feet. Looking down will create tension in your neck and shoulders. Keep your jaw and neck relaxed.

Don’t hunch your shoulders

Your shoulders should be back and down. Keep them relaxed and avoid tensing them. Don’t hunch over as this restricts breathing, allowing less oxygen to get to the muscles.

Keep your hands relaxed

Your hands should be relaxed, but don’t let them flop. Tight hands can cause tension all the way up to the back and shoulders.

Keep your arms at 90 degrees

Your arms should be bent at a 90-degree angle. Try to swing them forward and back, not across your body. The arm movement helps to propel you forward, so swinging them sideways is a waste of energy.

Lean forward while running

Don’t bend forward or backward from the waist as this places pressure on the hips. Some experts advise running in an upright position, but Phillips believes using your body weight to lean forward a bit while running can reduce heel strike and help you land on the middle of your foot.

Keep your hips stable

Your hips should remain stable and forward-facing. Don’t stick your bottom out or rock your hips from side to side. Keeping this position in your hips can help prevent low back and hip pain.

Don’t lift your knees too high

Land with a slight bend in the knee. This helps to absorb the impact of running on hard surfaces. Don’t lift your knees too high and avoid bouncing up and down. Your knees should be lifting forwards rather than upwards.

Aim for a mid-foot strike

Landing on the middle of your foot is the safest way to land for most recreational runners. Avoid striking the ground with your heel or your forefoot first. Your foot should land below your hips – not out in front of you.

Don’t strike the ground heavily

Aim for short light steps. Good running is light and quiet. Whatever your weight, your feet should not slap loudly as they hit the ground. Light steps are more efficient and cause less stress to the body.

Breathe deeply and rhythmically

Whether you breathe through your nose or mouth, try to breathe deeply and rhythmically. Avoid shallow and quick breaths. Try to aim for one breath for every two strides, but don’t be afraid to try longer breathing.

What if I’m not very active?

If you’re not very active but are able to walk, increase your walking distance gradually.

If your joints are a problem, check whether your local swimming pool holds exercise classes.

The water helps to support your joints while you move, and once you lose a bit of weight, the pressure on your joints will reduce.

If you’re not active because of a medical condition, get advice on exercising with a disability.

How to stretch after a run

Give yourself a few minutes to cool down after each run by walking and a doing few stretches.

Performing stretching exercises after a run will help you cool down gradually and improve your flexibility.

These stretches are best done after exercising, when your muscles are warm and more elastic.

Breathe deeply and regularly during the stretches. Aim to stretch to the point of feeling tightness or slight discomfort.

You shouldn’t feel any pain when doing these exercises. If you do, stop and seek medical advice.
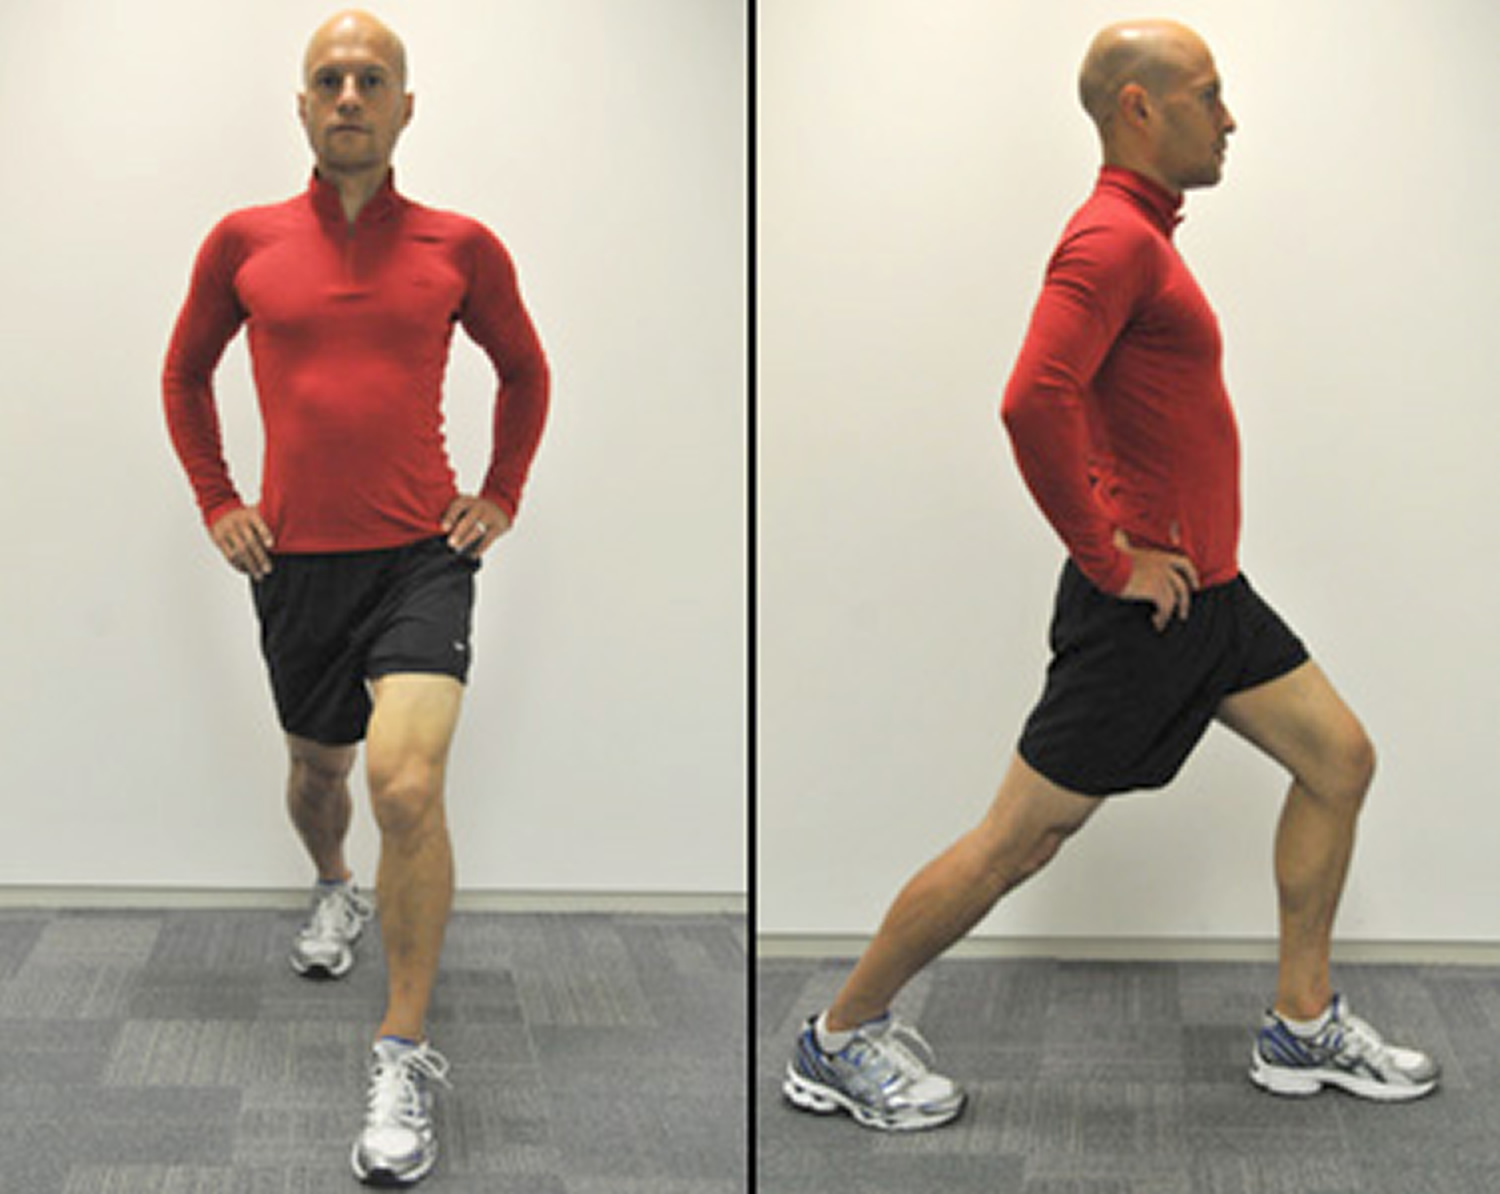
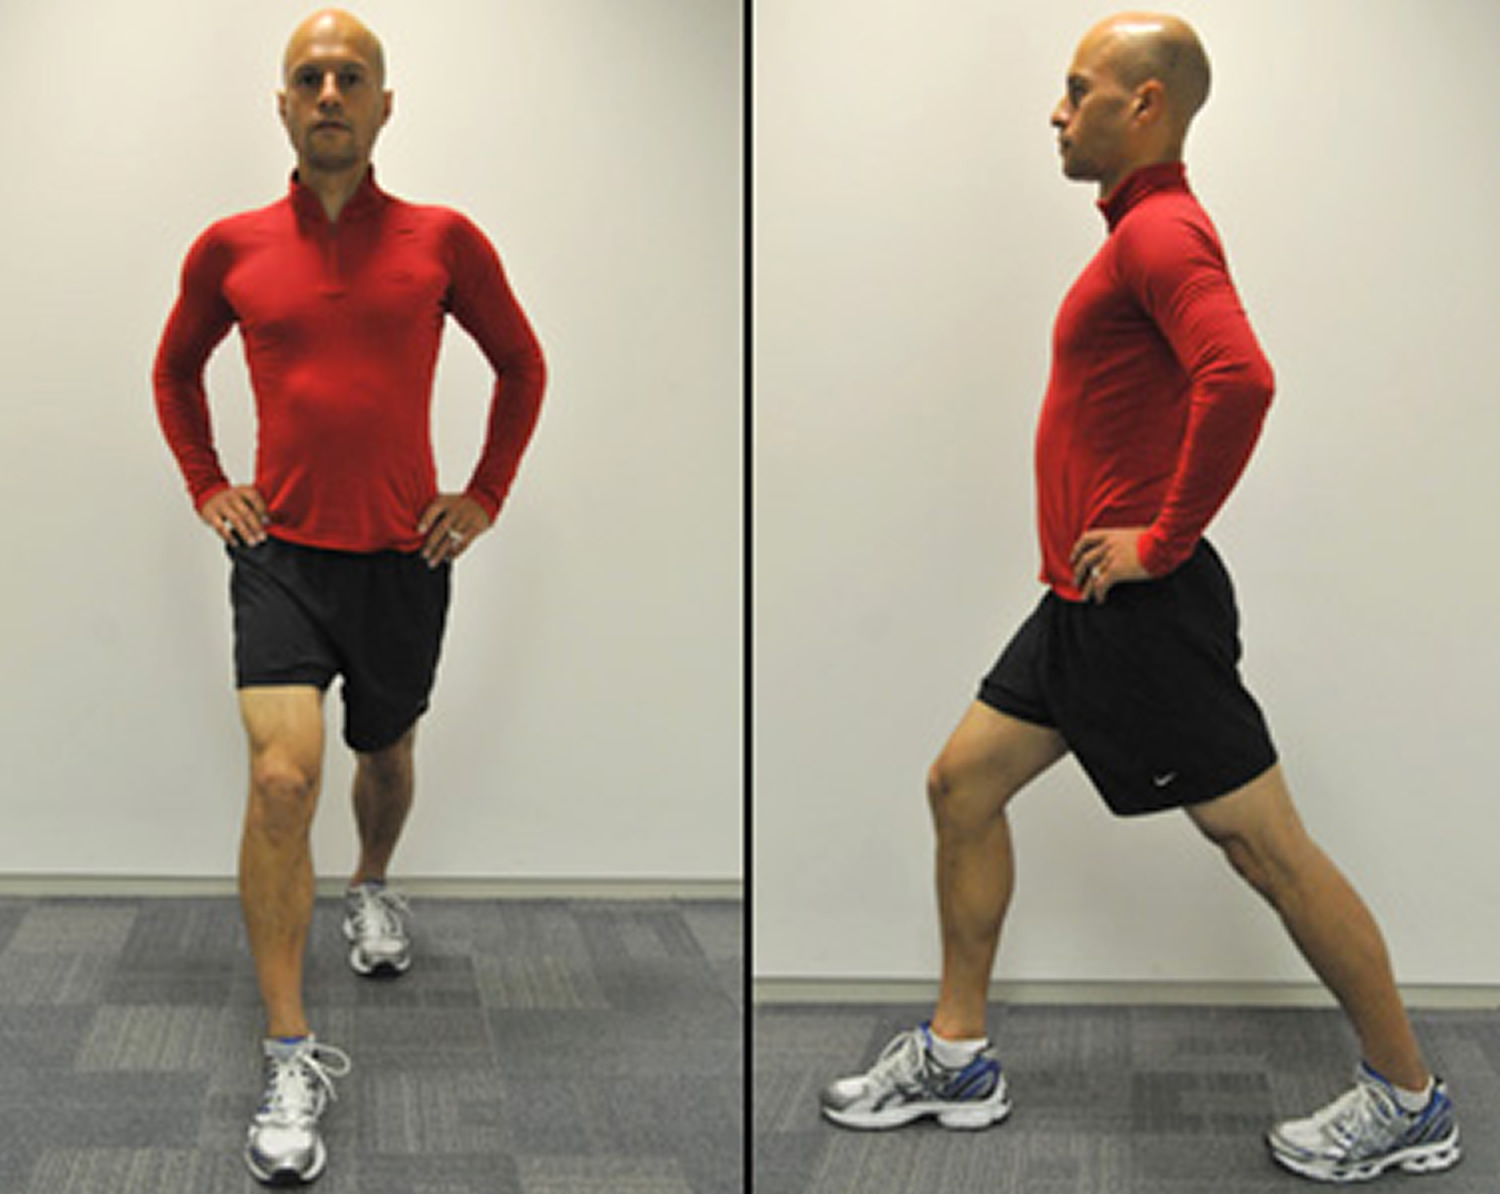
Hip flexor stretch

Step your left leg forward, keeping both feet pointing straight ahead. Keeping your back leg straight and avoiding sticking your buttock out and arching your back, slowly bend your front leg and push your right buttock forward until you feel a stretch across the front of your right hip joint – hold for 15 seconds. Repeat with the other leg.

Figure 1. Hip flexor stretch
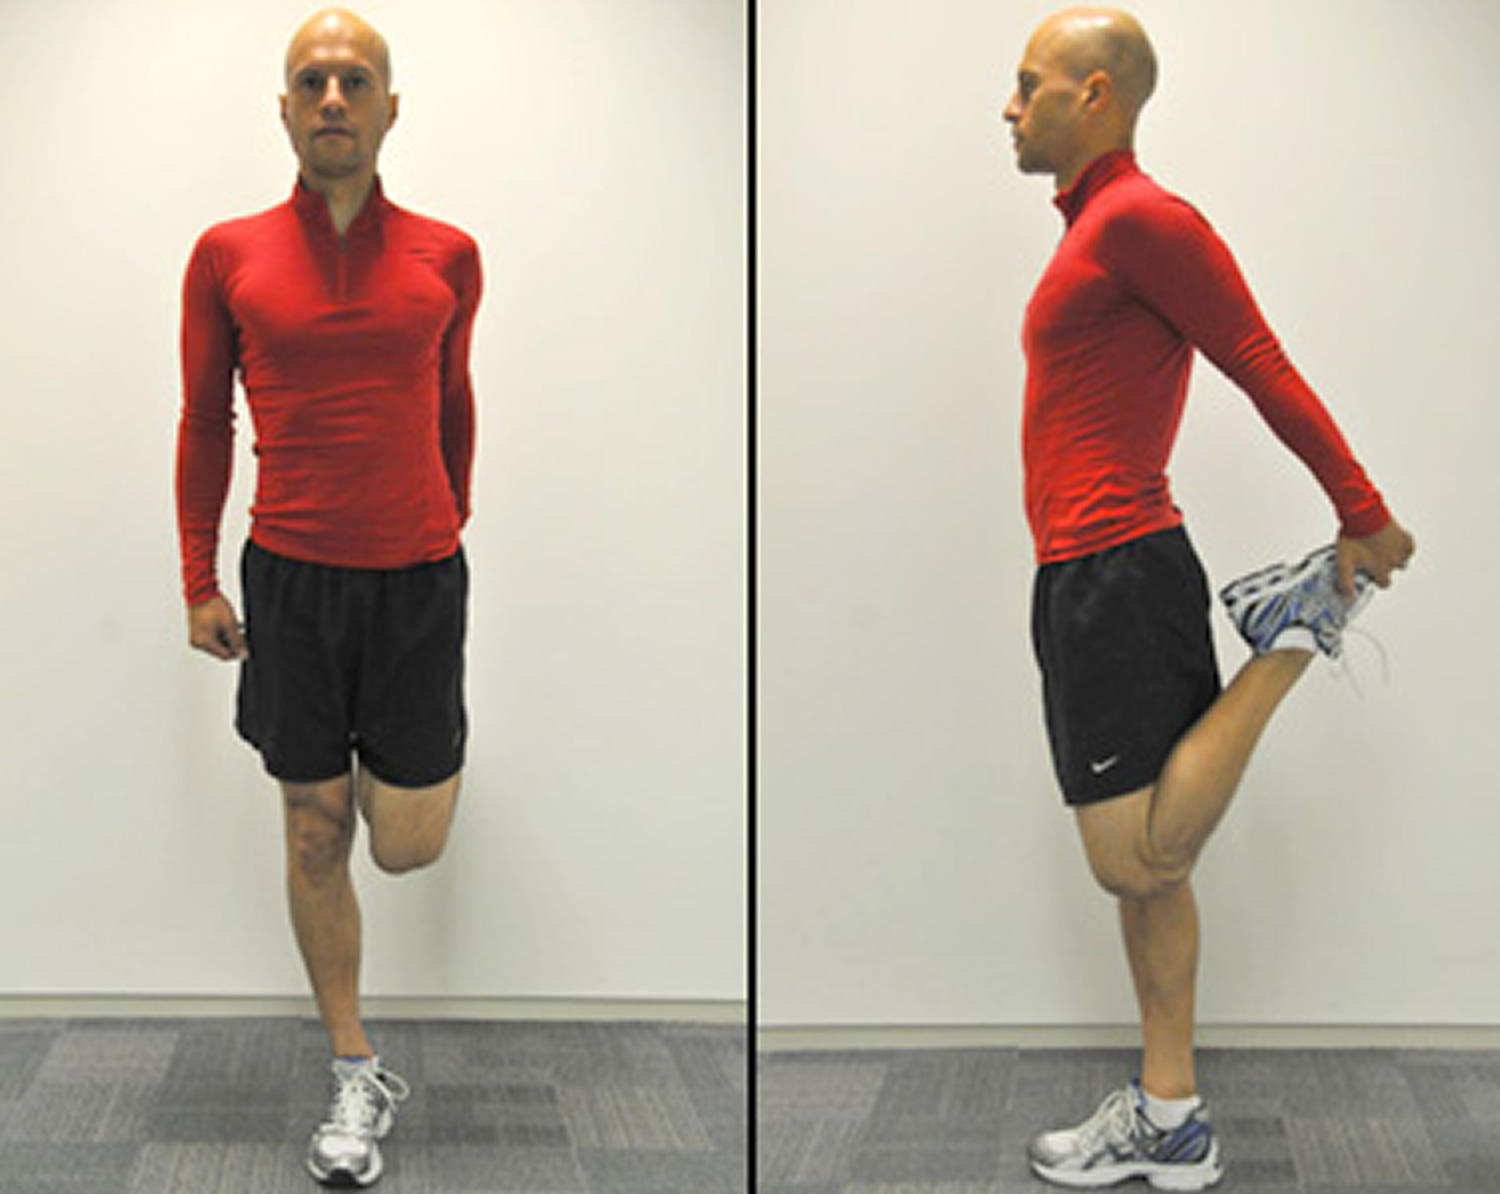
Hip flexor stretch after running

Thigh stretch

Grab the top of your left foot behind you and gently pull your heel towards your left buttock to stretch the front of the thigh, keeping the knees touching – hold for 15 seconds. Avoid leaning forwards or to the side. Repeat with the other leg.

Tip: place a hand on a wall or bench for balance

Figure 2. Thigh stretch

Thigh stretch after running

Hamstring stretch

Stand with your right leg just in front of the other and your hands on your hips. Keeping your right leg straight and toes pointing up, bend your left leg. Bend towards your right leg, keeping your back straight – hold for 15 seconds. Repeat with the other leg.

Figure 3. Hamstring stretch

Hamstring stretch after running

Iliotibial band stretch

To stretch your right iliotibial band, cross your right leg behind your left leg. Keeping both feet on the ground, lean to your left side and push your right hip outwards – hold for 15 seconds. Don’t bend forward or stick your buttocks out. You should feel the stretch along your outer right thigh and hip. Repeat with the other leg.

Figure 4. Iliotibial band stretch

Iliotibial band stretch after running

Calf stretch

Step your right leg forward. Bend your front leg and keep your back leg straight. Both feet should point forwards. Push your left heel into the ground, keeping your left leg straight. You should feel the stretch at the back of your left leg, below the knee – hold for 15 seconds. Repeat with the other leg.

Figure 5. Calf stretch
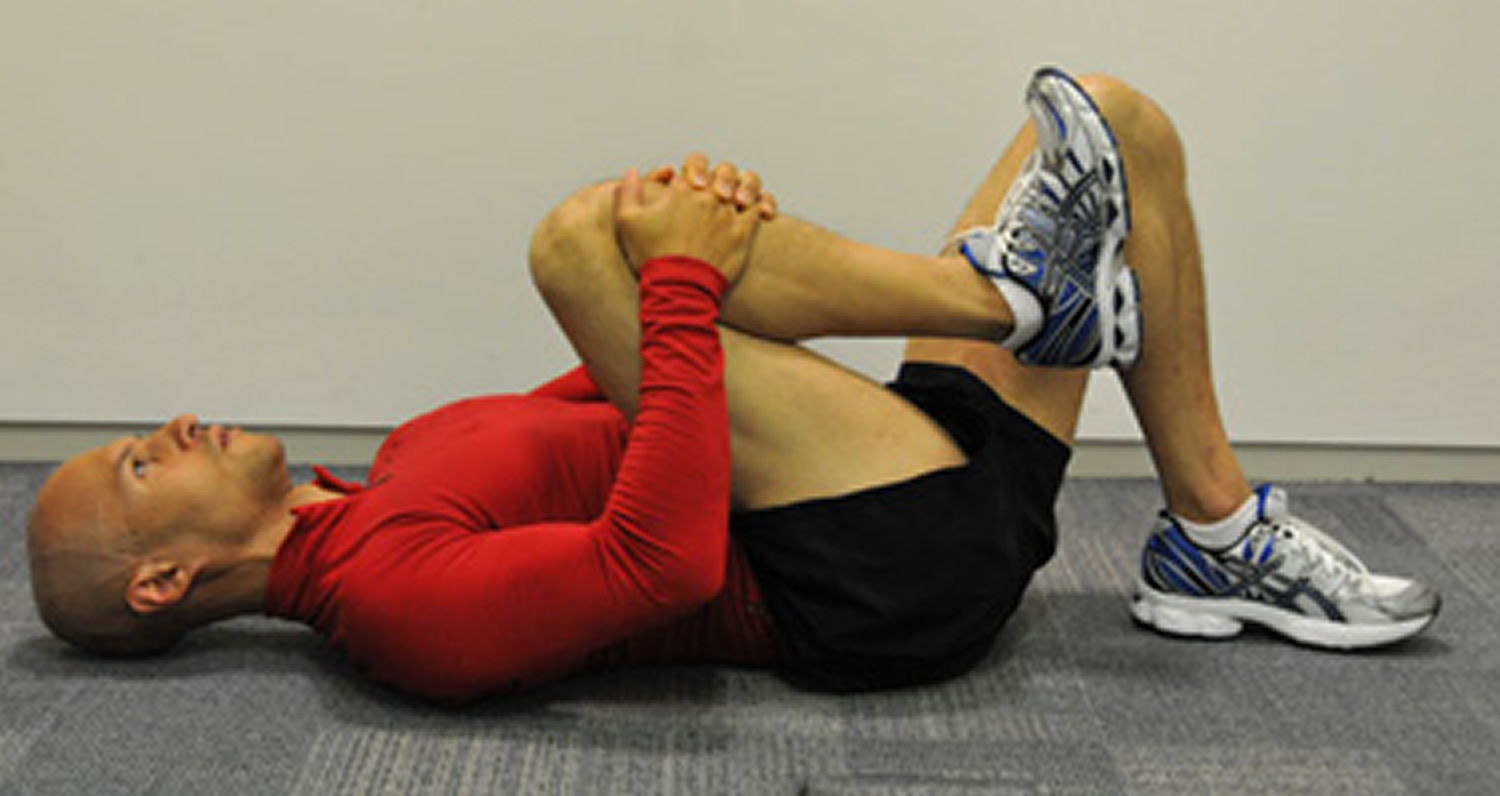
Calf stretch after running

Lower back stretch

Lie on your back with both feet flat. Pull your right knee to your chest until you feel a stretch in your lower back. Hold for up to 15 seconds and repeat with the left leg. Then pull both knees to your chest and hold for up to 15 seconds.

Figure 6. Lower back stretch
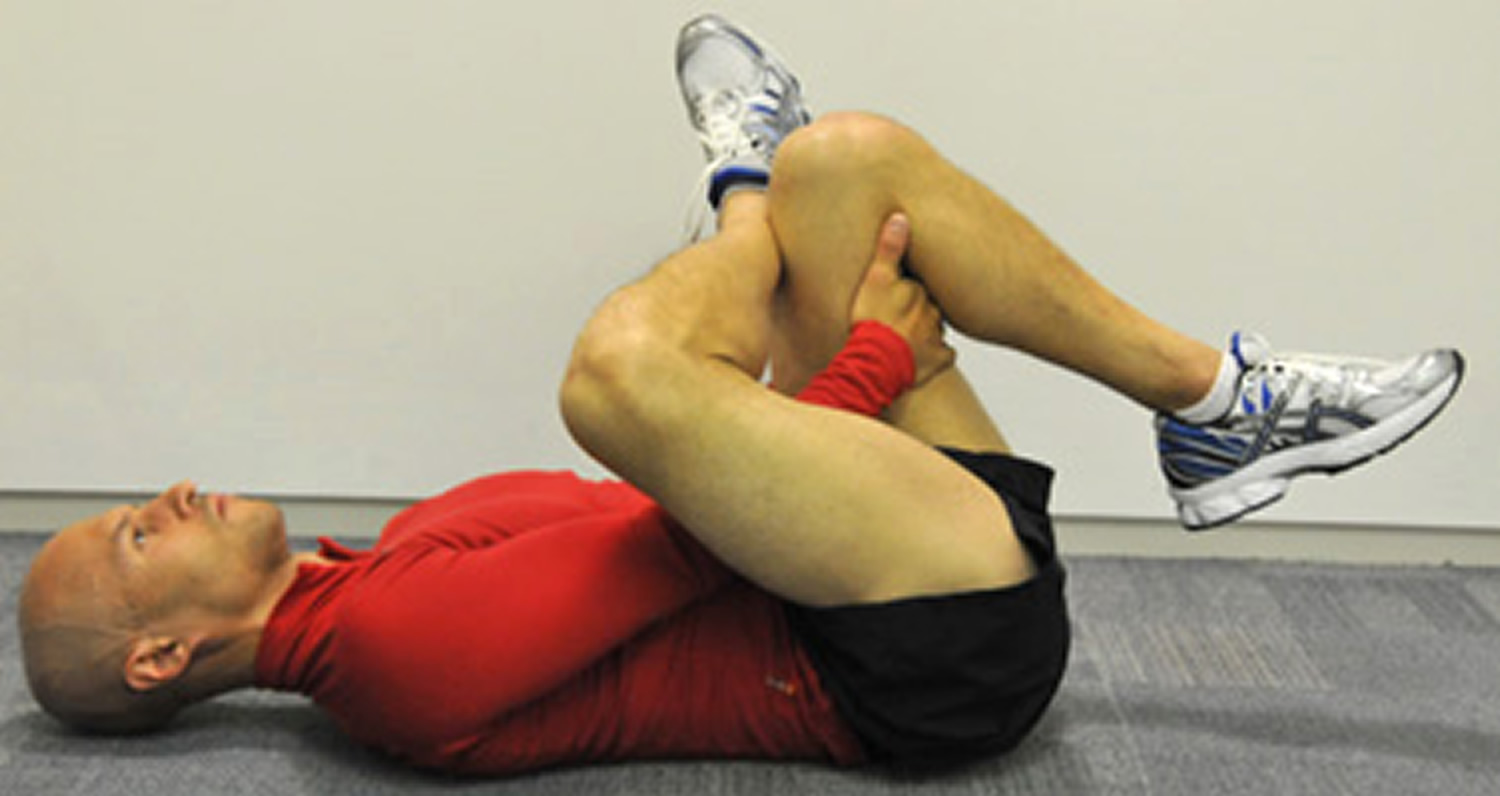
Lower back stretch after running

Buttock stretch

Lie on your back with your knees bent and both feet flat on the floor. Cross your right leg over your left thigh. Grasp the back of your left thigh with both hands and pull the left leg toward your chest – hold for 15 seconds. Repeat with the other leg.

Figure 7. Buttock stretch

Buttock stretch after running

Running potential problems and when to seek the help

Pain is the body’s way of letting you know something is wrong. Listen to your body and act on it.

Running can cause normal aches and pains. Something called Delayed Onset Muscle Soreness (DOMS) is a normal response from muscles repairing themselves after running. This typically occurs one to two days after a running session, and only lasts a couple of days. An injury is typically something that does not go away and causes you to stop or reduce your training.

The most common injuries for runners are listed below:

Pain at the front of the knee

Referrered to as Patellofemoral pain syndrome this is pain in and/or around the front of the knee or knee cap. This typically is worse with repeated bending of the knee (i.e., running) and going up or down stairs. The knee pain is typically non-specific with little or no swelling.

Pain typically on the outside of the knee

Referred to as Iliotibial band friction syndrome (ITBFS), this is typically an overuse injury with a tightening of the band of tissue which runs down the outside of the thigh and inserts into the outside of the knee. Pain typically occurs as the foot hits the ground when running, due to the increased angle of the leg.

Achilles Tendon pain

Achilles Tendinopathy is another overuse injury, involving the tendon at the back of the leg and foot. This can either have a gradual onset or become painful after a particularly gruelling session. Early treatment is ideal with Ice, Compression and Elevation (ICE), addressing any mechanical abnormalities that are present, leading on to a strengthening programme.

Shin splints

Known as Medial Tibial Stress Syndrome (MTSS), this a pain that occurs either in the front or inside of the shin which typically improves once you have warmed up and then is painful the following morning after exercise. A mechanical cause in relation to lower leg alignment can be a big influence in shin pain, and this should be addressed.

Heel pain

Otherwise known as Plantar fasciitis, this usually happens on standing up first thing in the morning or after a period of rest. This improves as you warm up but then gets worse the more activity you do. Podiatrists are in an ideal position to treat this, as orthoses can reduce the stress on the band of tissue under the foot.

Foot Blisters

Foot blisters are painful, fluid-filled lesions produced by friction and pressure. They can be caused by the following:

  • Ill-fitting shoes.
  • Stiff shoes.
  • Wrinkled socks against the skin.
  • Excessive moisture.
  • Foot deformities.

How to prevent foot blisters

  • Keep your feet dry.
  • Always wear socks as a cushion between your feet and shoes.
  • Wear properly fitting shoes.

If a blister does occur, do not pop it. Cut a hole in a 1.5”piece of foam or felt, forming a ‘doughnut’ over the blister; tape the foam or felt in place or cover with a soft gel-type dressing. Treat an open blister with mild soap and water; cover it with an antiseptic ointment and protective soft gel dressing to prevent infection and speed up the healing process

All of the above injuries need treatment

If you think you have one of the above problems you should consult a podiatrist or an orthopedic surgeon. The podiatrist can also assess your ‘mechanics’ – the way you run or walk and offer advice, stretches or exercises to aid performance and prevent injury in the future. They will also assess the need for orthoses, which are special inserts that go inside your shoe to address abnormalities in the way your foot works.

Staying motivated

Set yourself a goal

Whatever your level, setting challenges is useful to stay motivated. Training for a race, such as a 5K, or a charity run is a good way to keep going.

Run with a friend

It really helps to have someone about the same level of ability as you to run with. You’ll encourage each other when you’re not so keen to run. You’ll feel you don’t want to let your running partner down, and this will help motivate you.

Mix it up

Keep your running interesting by adding variety. Running the same route over and over again can become boring. Vary your distances, pace and routes.

Join a club

A running club is the perfect way to commit to running regularly. Most clubs have running groups for different levels, including beginners. Clubs are also a great way to find running partners to run with outside of club sessions.

Interval running for weight loss

An interval training workout involves alternating periods of high-intensity effort with periods of low-intensity effort, which is called the recovery. For runners, this would typically involve interspersing bouts of fast running with slower running.

The long-term health benefits from interval training are similar to those achieved from most types of longer-duration, moderate-intensity aerobic exercise, namely a lower risk of many chronic diseases, such as heart disease, type 2 diabetes, stroke and some cancers.

Interval training is also one of the best techniques for runners to improve their speed. Alternating bursts of fast running with a recovery period trains your muscles to work more efficiently and economically at higher speeds. Another benefit is that your routine moderately paced runs will feel easier.

Can interval training help me lose weight?

During the high-intensity phase, your body burns mainly carbs for energy, but during the recovery, your body burns mainly fat to produce the energy needed to help your body recover from the intense effort. This process can continue for hours after training, which can help you lose weight, as long as you’re also eating healthily.

There is growing evidence to support the notion that interval training might be as effective, if not more so, than longer, moderate-intensity aerobic workouts.

Researchers at McMaster University in Canada found that three 20-minute sessions of interval training a week provided the same benefits as 10 hours of steady exercise over a two-week period.

How often should I do interval training?

You shouldn’t be doing interval training every day. Intervals are hard work and you need to give your body time to recover. If you don’t, you’re likely to lose motivation, tire yourself out and possibly injure yourself.

The recovery phase is a really important part of interval training. The stop-and-start pattern trains your body to recover quickly between bursts of faster running, which, over time, will gradually increase your ability to run faster for longer.

If you’re used to running three days a week, you could set aside one of those runs for an interval training session.

Is interval training safe?

Interval training is hard work on the whole body, but particularly the heart, lungs and muscles. If you’re out of shape or you’ve not exercised for a while, you should get the all-clear from your doctor before starting.

It is generally advisable to have a good level of overall aerobic fitness before performing high-intensity training of any kind.

Running in winter

With the shorter and colder days, lacing up for a run might be the last thing you feel like doing. But don’t let the winter weather stop you from being physically active and keeping fit.

Try the following tips to help you stay safe and motivated when you’re running in colder weather.

What to wear

Dressing appropriately for the weather conditions will help ensure you enjoy your run.

Consider wearing lightweight layers of breathable clothing, known as the layer system.

The layer system works well for keeping you warm and any layer can be removed as conditions change during your run.

When choosing your layers, remember your body heats up during exercise. You should be slightly cool when you start your run.

For example, depending on the weather, a layer system could consist of:

  • A base layer: the first layer, such as a breathable synthetic fabric to draw the sweat away from your skin.
  • A mid layer: such as a fleece to keep the warmth in and remove any moisture from the base layer.
  • An outer layer: such as a light water-resistant jacket: to expel moisture and protect you from the wind and rain.

Use any zips and air vents to help regulate your body temperature to stay comfortable during your run.

Avoid running in cotton tops. Cotton soaks up moisture and takes time to dry and may make you feel cold.

A pair of leggings or running tights underneath a pair of shorts, or some tracksuit bottoms will keep your legs warm.

A pair of gloves and a hat or fleece headband are a good idea to stop you losing heat from your head and hands.

Stay safe – be seen

If you go running before or after work during the winter, it’s likely you’ll be running in the dark.

When running after dark, it’s essential that you’re visible to other people, particularly motorists.

Your clothes should be reflective or a bright, light color, such as white or fluorescent yellow. Don’t wear dark clothes as drivers may not see you.

Most good running brands make clothes that feature reflective strips.

A fluorescent bib that can be worn over your running clothes is also perfect for running after dark.

Stick to well-lit areas and avoid running anywhere you don’t feel completely safe.

Warm up and cool down

Easing into your run is a good way to warm-up, especially in cold weather.

Start slowly with some very gentle running or even walking to ready the muscles for exercise.

Gradually increase your pace until, after around 10 minutes, you get to the pace you’re going to maintain for most of the run.

Don’t stop after your warm-up to stretch. That will cool your muscles down again.

To cool down, reduce your pace or walk for five to ten minutes. This will help your body recover after your run.

Don’t stop and stretch outside or you could get too cold. Do some stretches indoors instead.

Running with a cold or asthma

Colds are more common in winter, but you don’t necessarily have to stop running if you’re feeling under the weather.

Use common sense and listen to your body. If your symptoms are not severe and you generally feel OK, then you can go running. If you feel absolutely rotten, then it’s best not to go.

However, it’s important not to run if you have a fever. A fever is when your body’s temperature is 38 °C (100.4 °F) or above and is rarely a symptom of a cold. If you run with a fever, it’ll make you feel worse. In very rare cases, running with a fever can lead to the virus affecting your heart, which can be dangerous.

If you have asthma, take extra care when running in winter as cold air can trigger symptoms. Doctors recommend using your inhaler before you go running and taking it with you when you run.

Running schedule for weight loss

When you’re designing your personal running schedule, it’s very important that you consider your fitness and weight loss goals, because without a goal you’ll never have a target and you’ll never know when you’ve achieved those goals. By planning carefully and pacing yourself, you can make fitness a healthy habit that lasts a lifetime.

Plan your runs. Work out when and where (the exact route and time) you’re going to run and put it in your diary. That way, it won’t slip your mind.

7-week training schedule for running beginners

Doing a 5K (3.1 miles) run can add a new level of challenge and interest to your exercise program. Don’t be daunted by the distance. A 5K run is a great distance for a beginner. You can prepare for a 5K run in just two months.

Consider using this seven-week 5K run training schedule as your guide. This 5K run training schedule was created by Olympian Jeff Galloway 41). It’s tailored for beginners or anyone who wants to complete a 5K race. You don’t have to use this training schedule only for a 5K run. You can also adapt it for a 5K walk.

How to use the 5K training schedule

This 5K training schedule incorporates a mix of running, walking and resting. This combination helps reduce the risk of injury, stress and fatigue while boosting your enjoyment of physical activity. Remember, you can run or walk slowly to help your body adjust to this 5K training schedule.

Under this 5K run training schedule, you’ll spend a portion of your time walking. For instance, during week one on run/walk days, you’ll run for 15 seconds and then walk for 45 seconds, repeating that cycle for 30 minutes.

As the weeks progress, you’ll gradually increase the amount of time running and reduce the amount of time walking. If you’re adapting the training for a 5K walk, then you always walk, even on run/walk days.

One day a week, which is Friday on this 5K schedule, is a day of rest from exercise, giving your muscles time to recover. On Sunday, you can either take a second day of rest, or you can enjoy a walk at your choice of distance. On this 5K run training schedule, race day falls on Saturday of your seventh week.

Figure 8. Running schedule for weight loss

Running schedule for weight loss

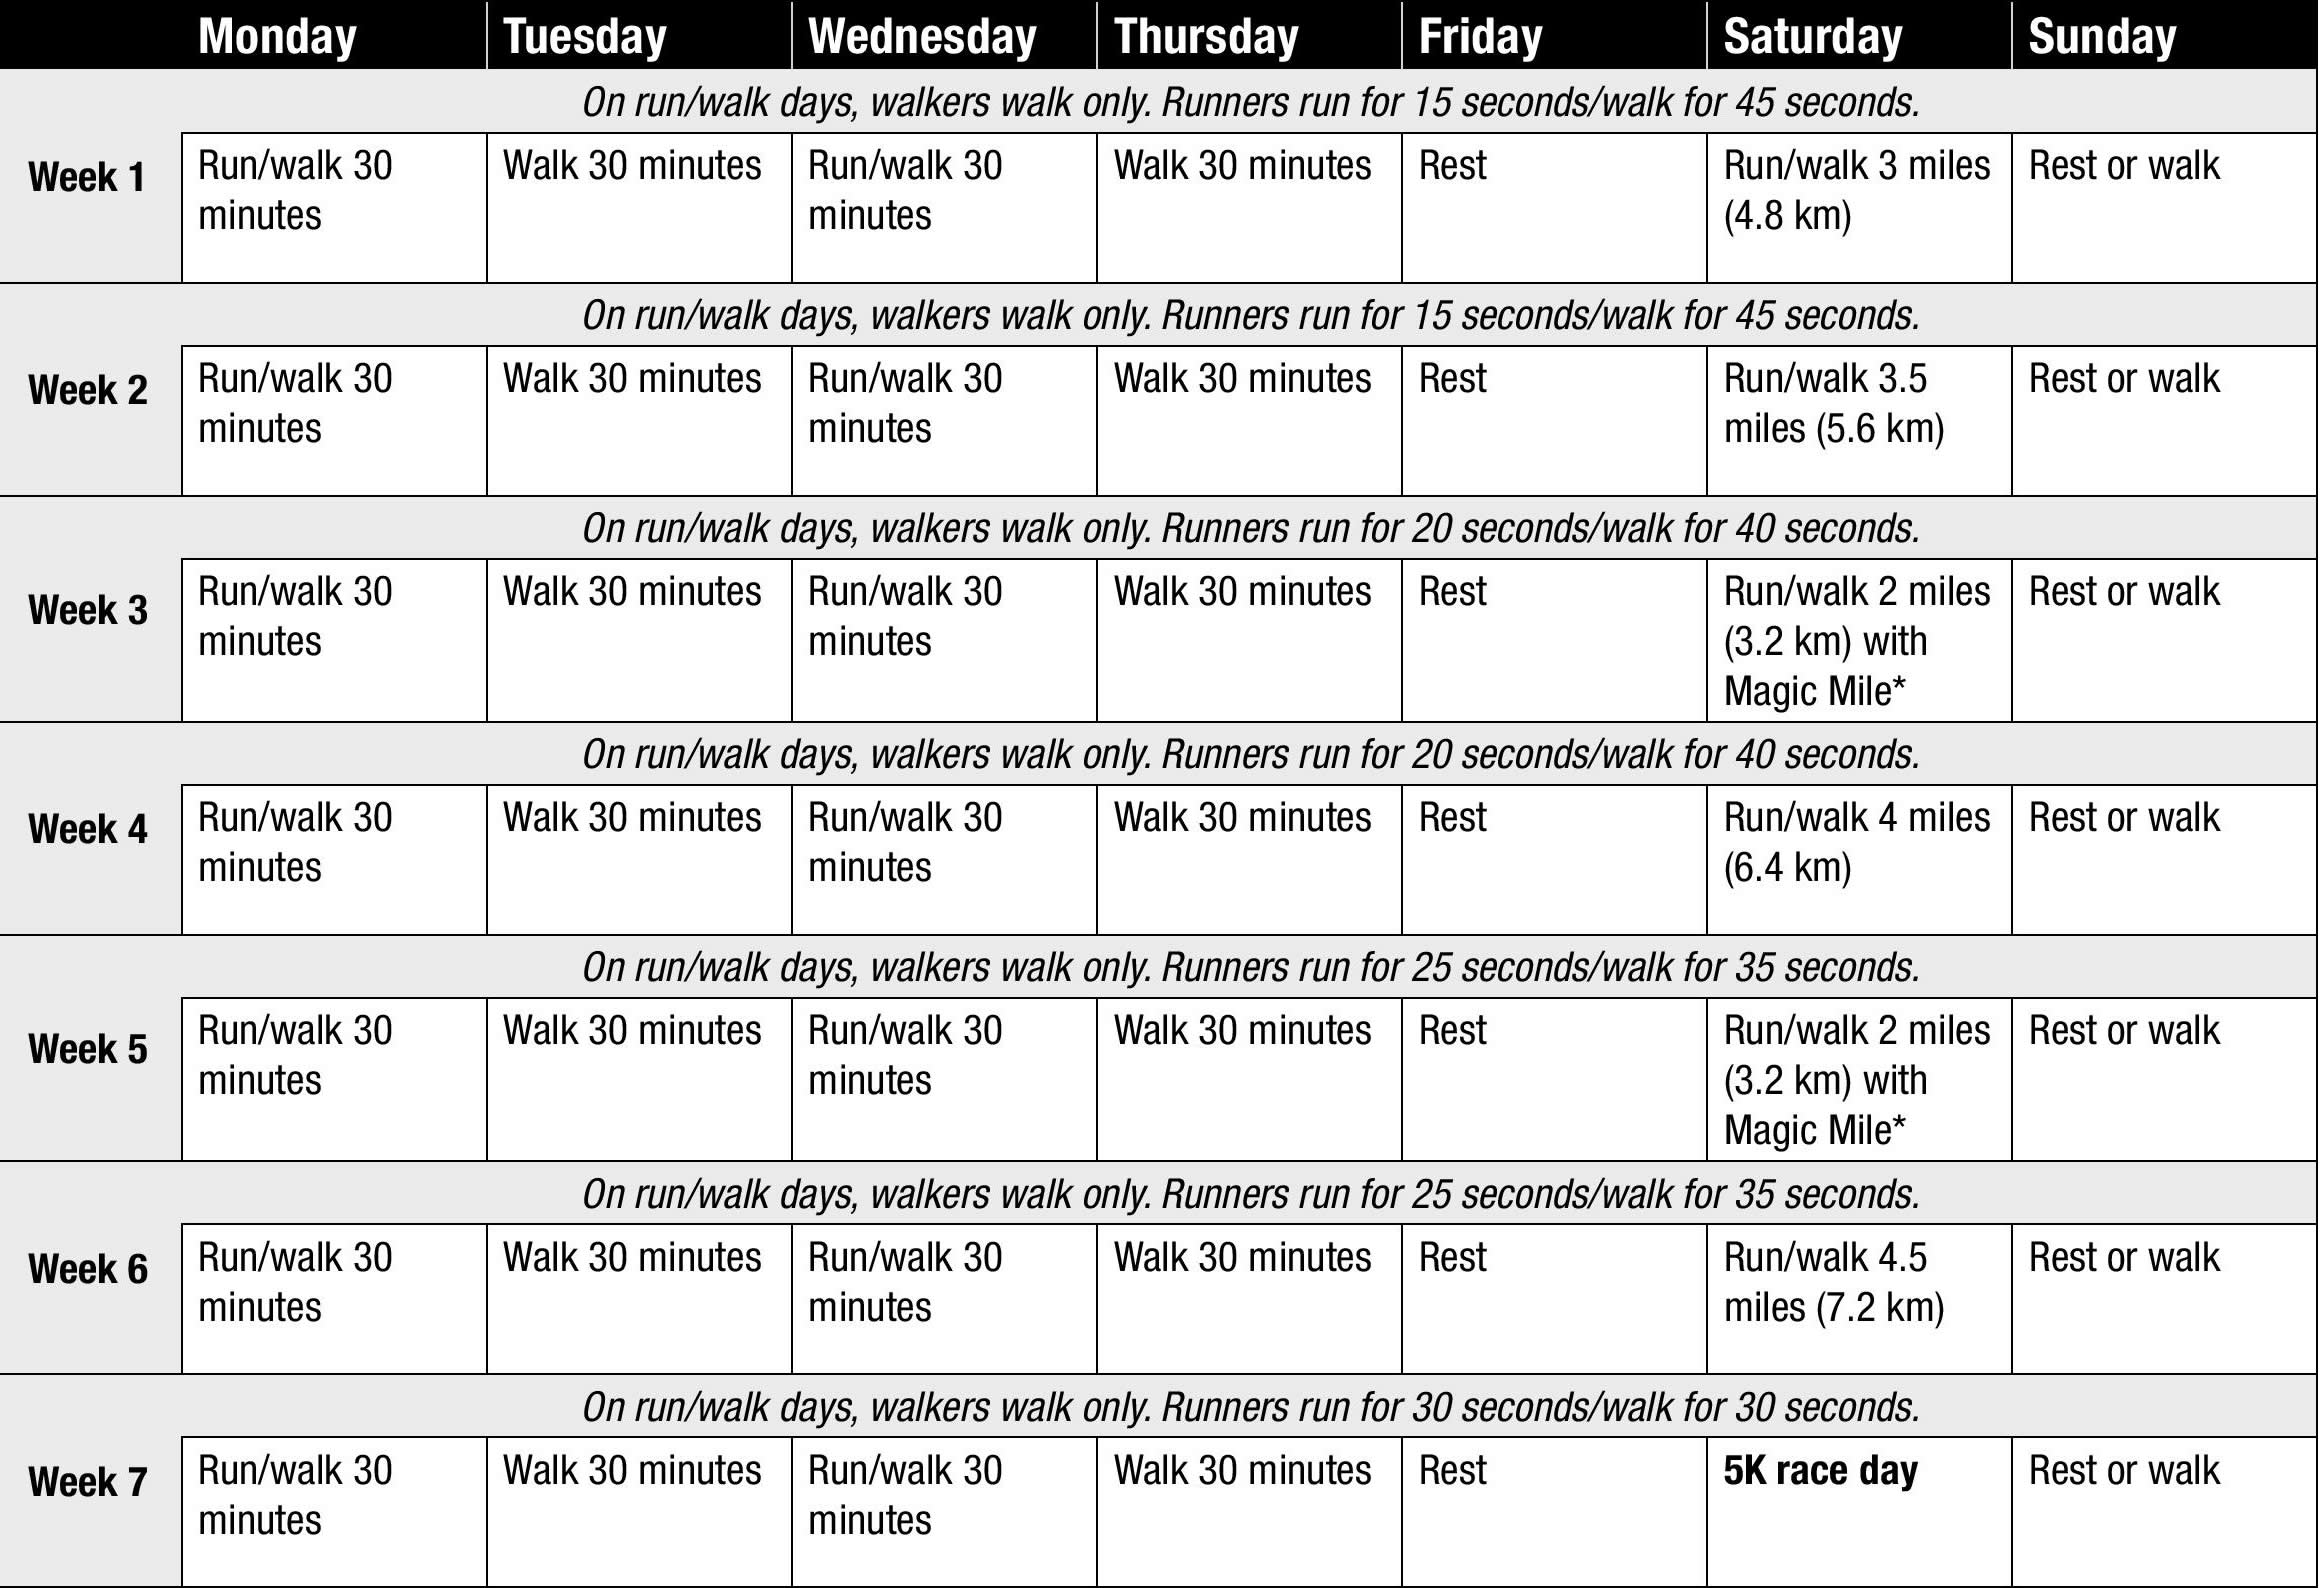
Note: *The Magic Mile is a training tool designed to help you find a realistic race pace. On the first Magic Mile, warm up as usual and then run or walk one mile (1.6 km) slightly faster than your normal pace. Time your one-mile run/walk with a stopwatch. Run or walk easily the rest of the distance assigned for the day. On each successive Magic Mile, warm up as usual and then try to beat your previous one-mile run/walk time. Your 5K race pace should be one to two minutes slower than your fastest Magic Mile time.

Week 1 – Running schedule for weight loss

On run/walk days, walkers walk only. Runners run for 15 seconds/walk for 45 seconds.

MondayRun/walk 30 minutes
TuesdayWalk 30 minutes
WednesdayRun/walk 30 minutes
ThursdayWalk 30 minutes
FridayRest
SaturdayRun/walk 3 miles (4.8 km)
SundayRest or walk

Week 2 – Running schedule for weight loss

On run/walk days, walkers walk only. Runners run for 15 seconds/walk for 45 seconds.

MondayRun/walk 30 minutes
TuesdayWalk 30 minutes
WednesdayRun/walk 30 minutes
ThursdayWalk 30 minutes
FridayRest
SaturdayRun/walk 3.5 miles (5.6 km)
SundayRest or walk

Week 3 – Running schedule for weight loss

On run/walk days, walkers walk only. Runners run for 20 seconds/walk for 40 seconds.

MondayRun/walk 30 minutes
TuesdayWalk 30 minutes
WednesdayRun/walk 30 minutes
ThursdayWalk 30 minutes
FridayRest
SaturdayRun/walk 2 miles (3.2 km) with Magic Mile*
SundayRest or walk

Week 4 – Running schedule for weight loss

On run/walk days, walkers walk only. Runners run for 20 seconds/walk for 40 seconds.

MondayRun/walk 30 minutes
TuesdayWalk 30 minutes
WednesdayRun/walk 30 minutes
ThursdayWalk 30 minutes
FridayRest
SaturdayRun/walk 4 miles (6.4 km)
SundayRest or walk

Week 5 – Running schedule for weight loss

On run/walk days, walkers walk only. Runners run for 25 seconds/walk for 35 seconds.

MondayRun/walk 30 minutes
TuesdayWalk 30 minutes
WednesdayRun/walk 30 minutes
ThursdayWalk 30 minutes
FridayRest
SaturdayRun/walk 2 miles (3.2 km) with Magic Mile*
SundayRest or walk

Week 6 – Running schedule for weight loss

On run/walk days, walkers walk only. Runners run for 25 seconds/walk for 35 seconds.

MondayRun/walk 30 minutes
TuesdayWalk 30 minutes
WednesdayRun/walk 30 minutes
ThursdayWalk 30 minutes
FridayRest
SaturdayRun/walk 4.5 miles (7.2 km)
SundayRest or walk

Week 7 – Running schedule for weight loss

On run/walk days, walkers walk only. Runners run for 30 seconds/walk for 30 seconds.

MondayRun/walk 30 minutes
TuesdayWalk 30 minutes
WednesdayRun/walk 30 minutes
ThursdayWalk 30 minutes
FridayRest
Saturday5K race day
SundayRest or walk

9-week training schedule for running beginners

Couch to 5K

Couch to 5K is a running plan for absolute beginners. It was developed by a new runner, Josh Clark, who wanted to help his fifty-something mum get off the couch and start running, too.

The plan involves 3 runs a week, with a day of rest in between, and a different schedule for each of the 9 weeks.

Couch to 5K is for everyone. Whether you’ve never run before or if you just want to get more active, Couch to 5K is a free and easy way of getting fitter and healthier.

If you have any health concerns about beginning an exercise regime like Couch to 5K, make an appointment to see your doctor and discuss it with them first.

How does Couch to 5K work?

Probably the biggest challenge a new runner faces is not knowing how or where to start.

Often when trying to get into exercise, we can overdo it, feel defeated and give up when we’re just getting started.

Couch to 5K works because it starts with a mix of running and walking to gradually build up your fitness and stamina.

Week 1 involves running for just a minute at a time, creating realistic expectations and making the challenge feel achievable right from the start.

How do I get started on the Couch to 5K?

1. Download the free Couch to 5K podcasts to your mobile device or computer. If downloading to a computer, you’ll then need to copy the podcast on to your mobile device.

The podcasts feature a narrator, Laura, who guides you through the session, explaining when you need to run and when it’s time to walk.

Download the Couch to 5K Podcasts (get your free copy here https://www.nhs.uk/LiveWell/c25k/Pages/couch-to-5k.aspx or at iTunes https://itunes.apple.com/gb/podcast/nhs-couch-to-5k/id394384987)

Week 1 Podcast:

For the runs in Week 1, you will begin with a brisk 5-minute warm-up walk, then you will alternate 60 seconds of running, with 90 seconds of walking, for a total of 20 minutes.

Week 2 Podcast:

For the runs in Week 2, you will begin with a brisk 5-minute warm-up walk then you will alternate 90 seconds of running, with 2 minutes of walking, for a total of 20 minutes.

Week 3 Podcast:

For the runs in Week 3, you will begin with brisk 5-minute warm-up walk followed by 2 repetitions of the following; 90 seconds of running, 90 seconds of walking, 3 minutes of running, 3 minutes of walking.

Week 4 Podcast:

For the runs in Week 4, you will begin with a brisk 5-minute warm-up walk then 3 minutes of running, 90 seconds walking, 5 minutes running, 2 ½ minutes walking, 3 minutes running, 90 seconds walking, 5 minutes running.

Week 5 Podcast:

There are three different workouts for this week. They are as follows:

  • Run 1: brisk 5-minute warm-up walk, then 5 minutes running, 3 minutes walking, 5 minutes running, 3 minutes walking, 5 minutes running.
  • Run 2: brisk 5-minute warm-up walk, then 8 minutes running, 5 minutes walking, 8 minutes running.
  • Run 3: brisk 5-minute warm-up walk, then 20 minutes running, with no walking.

Week 6 Podcast:

As with Week 5, there are three different runs for this week.

  • Run 1: brisk 5-minute warm-up walk, then 5 minutes running, 3 minutes walking, 8 minutes running, 3 minutes walking, 5 minutes running.
  • Run 2: brisk 5-minute warm-up walk, then 10 minutes running, 3 minutes walking, 10 minutes running
  • Run 3: brisk 5-minute warm-up walk, then 25 minutes with no walking.

Week 7 Podcast:

For the runs in Week 7, you will begin with a brisk 5-minute warm-up walk then 25 minutes of running.

From now on, the plan gets you used to running for solid blocks of time, without the distraction of walking intervals.

Week 8 Podcast:

For the runs in Week 8, you will begin with a brisk 5-minute warm-up walk then 28 minutes of running.

By now, you should be getting comfortable with the longer runs but you still need to concentrate on completing the 28 minutes without going too fast.

Week 9 Podcast:

For the runs in Week 9, you will begin with a brisk 5-minute warm-up walk then 30 minutes of running.

You’ve nearly reached the end of your programme and you’ve made some great progress. This is the week when you can reach your goal. Well done!

2. When will you run? The best way to ensure you stick with your running plan is to carefully work out how to fit Couch to 5K into your day.

3. Plan your route. You may want to look at a map to plan your route first so you can focus on running. There are lots of great websites out there to help you with this.

4. Think about safety. If you’re planning to run outdoors, bear in mind that you may be less aware of your surroundings if you’re wearing headphones. Watch out for other pedestrians, cyclists and vehicles. When running in the dark, make sure you can see where you’re going and that other road users can see you. Consider running along routes with adequate lighting or wearing reflective clothing.

5. What gear? The most essential piece of kit is a pair of running trainers.

Tips on progression

The Couch to 5K running plan for beginners is designed for beginners to gradually build up their running ability so they can eventually run 5km without stopping.

The pace of the nine-week running plan has been tried and tested by thousands of new runners.

You can, however, repeat any one of the weeks until you feel physically ready to move on to the next podcast.

Structure is important for motivation, so try to allocate specific days of the week for your runs and stick to them.

Rest days

Rest days are critical. Having one between each week’s runs will reduce your chance of injury and also make you a stronger, better runner.

Resting allows your joints to recover from what is a high-impact exercise, and your running muscles to repair and strengthen.

Alternatively, you could do Strength and Flex on your rest days. This is a five-week plan designed to improve your strength and flexibility, which will help your running.

Strength and Flex exercise plan

The Strength and Flex five-week plan consists of a series of equipment-free exercises designed to improve your strength and flexibility.

The workout instructions and pace are easy to follow to ensure you perform each exercise correctly and in time.

You can easily combine Strength and Flex with your Couch to 5K running plan, by following the plans on alternate days of the week.

Strength and Flex will help you achieve your recommended two weekly sessions of strength exercises.

Strength and Flex features:

  • Equipment-free
  • Easy to follow
  • Full body workout
  • How-to video clips
  • Use anywhere, anytime
  • Can be used with Couch to 5K

Starting with Strength and Flex Week 1, your goal is to work your way up to Week 5 in five weeks. To achieve this, you need to do each podcast at least three times in a week.

By Week 5, you’ll be doing back, arm and leg stretches along with press-ups and squats with ease. You’ll be feeling stronger, more flexible and full of energy to go about your daily life.

You can do these full body workouts anywhere and any time you choose. They can be done indoors or out in the park or garden, on your own or with a friend.

All you need is enough space to walk about freely, a fixed bench, a wall and either some shoulder-height railings or a shoulder-height horizontal bar.

Week 1 of Strength and Flex

A gentle workout starting with a warm-up followed by a series of strength and flexibility exercises, finishing off with a cool down. Duration: 35:28

Week 2 of Strength and Flex

In week 2 some of the podcast week 1 exercises have been made a bit more challenging and the duration of your workout increased. Duration: 36:31

Week 3 of Strength and Flex

In week 3 some new moves have been added and the difficulty level of some of the podcast week 2 exercises increased. Duration: 35:32

Week 4 of Strength and Flex

In week 4 some new exercises have been added and the intensity stepped up as well as the length of your workout. Duration: 45:12

Week 5 of Strength and Flex

Week 5 exercises are more challenging than previous week to give you the definitive strength and flexibility workout. Duration: 43:32

Beyond week 5 of Strength and Flex

Once you’ve completed week 5, download the ‘without intro’ version for ongoing use, beyond the end of the programme. Duration: 41:38


References   [ + ]

read more

Sauna

sauna

What is a sauna

The sauna (or Finnish bath) has dry air and a high temperature, unlike the Turkish bath 1). Traditional saunas use either wood stoves or 220-V heaters to heat the air to approximately 85°C, which then heats the occupant, mainly via convection 2). Whilst the basic modern sauna is an unpainted, wood-panelled room with wooden platforms and a rock-filled electric heater. The walls are made of spruce or pine, and the benches are made of obeche, spruce or aspen because these types of wood are less hot to sit on. The recommended temperature is 80°C to 100°C at the level of the bather’s face and 30°C at floor level 3). The air should have a relative humidity of 10% to 20% 4). A good sauna has efficient ventilation; the air should change three to eight times per hour 5).

In a sauna, the skin temperature increases rapidly to approximately 40°C 6), whereas the increase in rectal temperature depends on heat exposure 7). Sweating begins quickly and reaches its maximum at approximately 15 min, with an average total secretion of 0.5 kg 8). Skin blood flow increases from 5% to 10%, becoming 50% to 70% of the cardiac output, while blood flow to internal organs decreases 9). Cardiac output increases by 60% to 70% in relation to the increase in heart rate 10), while cardiac stroke volume does not change 11).

Very few sudden deaths take place during or after sauna bathing. Of all sudden deaths in Finland within one year, only 102 (1.7%) occurred within 24 h of the sauna bath 12). One-third of these were accidental, due to consumption of alcohol or drowning; the majority of the non-accidental deaths were due to acute myocardial infarction (heart attack)  in which alcohol intake was an important contributing factor 13). An epidemiological study by Romo 14) showed that very few acute heart attacks occur during sauna bathing. Of 1631 acute heart attacks or sudden coronary deaths that occurred during a 16-month period in Helsinki, Finland, ischemic symptoms began or death occurred within 3 h of sauna bathing in only 29 patients (1.8%) 15).

In a large prospective study of 12,310 Finnish men and women, 30 to 59 years of age, there were 77 sudden coronary deaths during the six-year follow-up period but only two of these occurred in saunas 16).

Generally, sauna bathing has been contraindicated for patients with chronic heart failure 17). However, it has been well tolerated and improved hemodynamics has been shown in patients with chronic heart failure after a single exposure and after a four-week period of sauna bathing (five days per week). Left ventricular ejection fraction increased from 24±7% to 31±9% and left ventricular end-diastolic dimension decreased from 66±6 mm to 62±5 mm after four weeks 18).

Sauna bathing has the potential to be an effective therapeutic option for patients with hypertension or heart failure, as well as for patients with known coronary artery disease risk factors. The common mechanism of action is improvement in vascular endothelial function, which reduces cardiac preload and after-load. It would also be interesting to know – provided the improvement is permanent – whether some of the damage on the cardiovascular system can be reversed by sauna therapy. Sauna bathing can be risky in patients receiving alcohol, beta blockade and nitrates 19).

Severe aortic stenosis, unstable angina pectoris and recent heart attack are contraindications to sauna bathing 20). Decompensated heart failure and cardiac arrhythmia are relative contraindications 21). Elderly persons prone to orthostatic hypotension should be cautious in the sauna because a decrease in blood pressure may cause syncope, usually just after sauna bathing 22).

Sauna in healthy volunteers and in patients with heart failure

The physiological effects of exposure to Finnish saunas (80°C to 90°C with 30% to 40% relative humidity) were investigated in 60 healthy volunteers (33 men and 27 women, aged 18 to 63 years). Marked physiological changes appeared in the first few minutes in the sauna without any prodromal warning. After 20 min the mean heart rate was 143±25 beats/min, mean rectal temperature was 38.6±0.6°C and skin temperature was 40.4±1°C. In addition, mean systolic blood pressure was 130.5±26.6 mmHg and mean diastolic blood pressure was 66.6±15.9 mmHg. Three subjects experienced syncope, and one developed an anginal attack with electrocardiogram changes suggestive of an acute coronary event 23).

Recently, the temperature of sauna baths worldwide was decreased to 60°C, and a study 24) in Japan evaluated the safety and efficacy of repeated 60°C sauna bathing in patients with chronic systolic heart failure. This study included 15 heart failure patients with New York Heart Association (NYHA) class III, all in stable condition. Sauna bathing was performed once per day for four weeks. No adverse effect was observed. Symptoms improved in 13 of 15 patients after four weeks. Sauna bathing decreased systolic blood pressure without affecting heart rate, resulting in a significant decrease in the rate-pressure product. Left ventricular ejection fraction, by echocardiography, was significantly increased from 30±11% to 34±11%. Sauna bathing significantly improved exercise tolerance manifested by prolonged 6 min walking distance, increased peak respiratory oxygen uptake and enhanced anaerobic threshold. It also significantly reduced plasma adrenaline and noradrenaline levels, and reduced the number of hospital admissions for heart failure.

Sauna health benefits

The acute hemodynamic effects of thermal vasodilation were studied in 34 patients with chronic heart failure (most of them in NYHA class III and IV with a mean age of 58 years and a mean ejection fraction of 25±9%) 25). All patients had a sauna bath for 15 min at 60°C. There was a mild increase in oxygen consumption, a 1.2°C increase in pulmonary arterial blood temperature and the heart rate increased by 20 to 25 beats/min at the end of the treatment. Systolic blood pressure showed no significant change; however, the diastolic blood pressure decreased significantly during the sauna treatment. Cardiac and stroke indexes increased and systemic vascular resistances decreased significantly during and after the treatment. This study 26) has demonstrated that sauna baths improve the hemodynamics in patients with heart failure.

Sauna treatment has increased cardiac output and peripheral perfusion 27), and improved hemodynamic variables and clinical symptoms 28) in patients with heart failure.

Experimental studies 29), 30) have demonstrated that heart failure impairs endothelial-dependent vasodilation. One of the proposed mechanisms by which this occurs is through decreased peripheral vascular production of endothelium-derived nitric oxide in patients with heart failure 31). Shear stress is an important stimulus for nitric oxide production 32) and the expression of eNOS [endothelial nitric oxide synthase (eNOS)] 33). Several studies 34), 35) have shown that endothelial function in patients with heart failure was improved by treatment with L-arginine, angiotensin-converting enzyme inhibitors 36), physical training 37), dobutamine 38) or oral vitamin C 39).

In another study 40), 20 heart failure patients (30 to 75 years of age) with NYHA class II and III were studied. Mean left ventricular ejection fraction was 38±14%. Ten patients served as the control group. Thermal therapy with a far infrared dry sauna was performed. Patients were placed in a supine position on a bed in a 60°C sauna for 15 min, and once removed, kept on bedrest for another 30 min with a blanket to keep them warm. In the control group, patients were placed in a supine position on a bed in a temperature-controlled (24°C) room for 45 min. Two weeks of sauna therapy improved endothelial function (measured by the noninvasive brachial artery method) and decreased plasma brain natriuretic peptide (BNP) concentrations in patients with heart failure. A correlation was found between the degree of improvement in the per cent flow-mediated dilation (%FMD) and plasma brain natriuretic peptide concentrations. Repeated 60°C sauna therapy improved peripheral vascular endothelial function, resulting in an improvement in cardiac function in patients with heart failure.

This study 41) demonstrated that endothelial function in the brachial artery significantly improved after two weeks of sauna therapy. It was also found that systemic vascular resistance significantly decreased after two weeks of sauna therapy, suggesting an improvement in endothelial function in resistance vessels. Improved endothelial function leads to dilation of vessels by an increase in NO (nitric oxide) production. The fact that two weeks of sauna therapy significantly decreased systolic blood pressure in this study may reflect the improvement in endothelial function. This results in decreased afterload and, thus, increased cardiac output. These changes improved peripheral circulation, which was probably responsible for the improvement in clinical symptoms. A significant improvement in the per cent flow-mediated dilation (%FMD) was observed in patients whose clinical symptoms improved, whereas the per cent flow-mediated dilation (%FMD) did not improve in patients whose clinical symptoms did not change 42). The improvement in endothelial function after long-term repeated sauna therapy was most probably due to improved NO production by eNOS [endothelial nitric oxide synthase (eNOS)] upregulation in patients with heart failure. Endothelial nitric oxide synthase (eNOS) upregulation was due to a prolonged increase in shear stress; endothelial nitric oxide synthase (eNOS) upregulation in the coronary artery may have directly improved cardiac function due to an increase in coronary perfusion  43).

Another important issue in heart failure is ventricular arrhythmias. In a study by Giannetti et al 44), 30 patients (59±3 years of age) with NYHA class II or III and at least 200 premature ventricular complexes in 24 h were studied. They were randomly assigned into sauna-treated (20 patients) or nontreated (10 patients) groups. The sauna-treated group underwent a two-week program of a daily 60°C far infrared dry sauna for 15 min, followed by 30 min bedrest with blankets, five days a week. Patients in the nontreated group had bedrest in a temperature-controlled room (24°C) for 45 min. The total number of premature ventricular complexes per 24 h in the sauna-treated group decreased compared with that of the non-treated group (848 versus 3097). Heart rate variability increased and plasma brain natriuretic peptide (BNP) concentrations decreased in the sauna-treated group compared with those in the nontreated group. This study 45) has demonstrated that sauna treatment improved ventricular arrhythmias in patients with heart failure.

Fifteen patients with heart failure (mean age 64 years with NYHA class II or III) were assigned to six weeks of hydrotherapy or six weeks’ restriction in a crossover intervention trial 46). Patients with hydrotherapy had a significant improvement in mood, physical capacity and enjoyment, and a significant reduction in heart failure-related symptoms compared with those of the restricted patients. Patients’ heart rates at rest and at 50 W workload were significantly reduced by hydrotherapy. In conclusion, the use of a home-based hydrotherapy sauna was found to improve quality of life, heart failure-related symptoms and heart rate response to exercise in patients with mild chronic heart failure 47).

Another study 48) evaluated the effects of thermal therapy on endothelial function in patients with coronary risk factors. Twenty-five men with at least one coronary risk factor and 10 healthy men without coronary risk factors were enrolled. Patients in the risk group were treated with a 60°C far infrared dry sauna for 15 min and then kept in a bed covered with blankets for 30 min, once a day for two weeks. To assess endothelial function, brachial artery diameter was measured at rest, during reactive hyperemia (%FMD), again at rest and after sublingual nitroglycerin administration (per cent flow independent dilation [%FID]) using high-resolution ultrasound. At the start of the study, the %FMD was significantly impaired in the risk group compared with the level in the control group, while the %FID was similar in both groups. Two weeks of sauna therapy significantly improved the %FMD in the risk group; however, the %FID did not change. Repeated sauna treatment improved impaired vascular endothelial function in the setting of coronary risk factors, suggesting a therapeutic role for sauna treatment in patients with risk factors for atherosclerosis 49).

Summary

Repeated sauna therapy (60°C for 15 min) improved hemodynamic parameters, clinical symptoms, cardiac function and vascular endothelial function in patients with heart failure. In patients with heart failure, clinical symptoms such as fatigue, heaviness in the limbs, edema, appetite loss and constipation are often observed due to increased peripheral vascular resistance and reduced peripheral perfusion. Sauna therapy improved the cardiac index, mean pulmonary wedge pressure, systemic and pulmonary vascular resistance, and cardiac function. Sauna treatment is considered safe for heart failure patients with NYHA classes I, II and III. It seems that sauna treatment may help improve clinical symptoms and hemodynamic parameters secondary to an improvement in the endothelial function of patients with heart failure whose endothelial function is impaired 50).

Infrared sauna benefits

Traditional saunas use either wood stoves or 220-V heaters to heat the air to approximately 85°C, which then heats the occupant, mainly via convection. Some people find the traditional sauna (Finnish sauna) heat uncomfortable. In contrast, far-infrared saunas heat to approximately 60°C, providing a more comfortable and relaxing experience 51). Far-infrared saunas utilize 120-V infrared elements, similar to the infrared warmers on neonatal resuscitation beds, to radiate heat with a wavelength of around 10 μm (see Figure 1). As infrared heat penetrates more deeply than warmed air, users develop a more vigorous sweat at a lower temperature than they would in traditional saunas. The cardiovascular demand imparted by thermoregulatory homeostasis (sweating, vasodilation, decreased afterload, increased heart rate, increased cardiac output) is similar to that achieved by walking at a moderate pace. As such, far-infrared saunas might be of particular benefit to those who are sedentary due to various medical conditions, such as osteoarthritis or cardiovascular or respiratory problems 52).

Far-infrared saunas are approved by the Canadian Standards Association and are sold to the public as recreational saunas. Manufacturers advertise numerous therapeutic effects, including weight loss, improved cardiovascular health, normalized blood pressure (BP), lowered cholesterol, and reduced pain, stress, and fatigue 53).

Figure 1. Light spectrum used in far-infrared saunas

infrared sauna

[Source 54)]


Table 1. Studies supporting use of Far-infrared saunas

STUDYNDURATIONLEVEL OF EVIDENCEINDICATIONPRIMARY OUTCOMESCOMMENTS
Kihara et al, 2004 55)3014 dICongestive heart failureFewer PVCs and lowered BNP levelsInfrared sauna treatment improves ventricular arrhythmias in patients with CHF
Kihara et al, 2002 56)3014 dICongestive heart failureClinical symptoms improved and BNP levels decreased; endothelial function improvedClinical improvement in CHF seen after FIRS therapy might be owing to improved endothelial function
Miyamoto et al, 2005 57)1528 dIICongestive heart failureCHF symptoms, ejection fraction, and walking distance improved; catecholamine levels decreasedInfrared sauna therapy is a safe and effective treatment of CHF
Sugahara et al, 2003 58)1228 dIIPediatric CHF due to VSDClinical signs and symptoms of CHF decreased, urine nitrate levels decreased, and 75% of patients avoided surgical repairInfrared sauna therapy is safe and might be helpful in treating pediatric CHF; VSDs have a high incidence of spontaneous improvement
Masuda et al, 2004 59)2814 dIPrevention of atherosclerosis by decreasing oxidative stressSystolic BP decreased, as did serum PGFInfrared sauna therapy might be cardioprotective
Imamura et al, 2001 60)3514 dIIImpaired endothelial function in those with coronary risk factorsEndothelium-dependent vasodilatation improved; BP and fasting glucose levels decreasedInfrared sauna therapy is safe and improves vascular endothelial function
Biro et al, 2003 61)1014 dIIObesityDespite weight loss, plasma ghrelin and leptin levels did not changeInfrared sauna therapy might blunt neurohormonal effects of weight loss due to calorie restriction
Masuda et al, 2005 62)4628 dIChronic painIncreased likelihood of return to work; trend toward decreased pain and angerInfrared sauna therapy might be promising for the treatment of chronic pain
Masuda et al, 2005 63)235 dII*Chronic fatigue syndromeFatigue, pain, sleep, and low- grade fever improvedInfrared sauna treatment might be helpful for chronic fatigue syndrome

BNP—brain natriuretic peptide, BP—blood pressure, CHF—congestive heart failure, FIRS—far-infrared sauna, PGF—prostaglandin F, PVC—premature ventricular contraction, VSD— ventricular septal defect.

*Although this study represents level II evidence, it is very weak owing to small sample size.

Levels of evidence

Level I: At least one properly conducted randomized controlled trial, systematic review, or meta-analysis

Level II: Other comparison trials, non-randomized, cohort, case-control, or epidemiologic studies, and preferably more than one study

Level III: Expert opinion or consensus statements

[Source 64)]

Congestive heart failure (CHF)

Four papers support the use of infrared sauna therapy for those with CHF (congestive heart failure) 65), 66), 67), 68).

In one randomized controlled trial 69) (level I evidence), 30 subjects with New York Heart Association (NYHA) class II or III heart failure and more than 200 premature ventricular contractions (PVCs) per 24 hours were randomized into treatment and nontreatment groups. Treatment consisted of 10, 15-minute infrared sauna sessions over a 2-week period. After 2 weeks the sauna group had significantly fewer premature ventricular contractions (mean = 848 vs 3097 per 24 hours) and lower brain natriuretic peptide (BNP) levels (mean = 229 pg/mL vs 419 pg/mL) compared with the untreated group 70). Secondary findings included significant improvements to NYHA heart failure class (class II/III = 5/15 before treatment vs 15/5 after treatment), weight (mean = 57 kg before vs 56 kg after), cardiothoracic ratio (mean = 59% before vs 56% after), and left ventricular ejection fraction (LVEF) (mean = 29% before vs 33% after); although BP levels appeared to decrease, results did not reach statistical significance. The authors concluded that repeated far-infrared saunas treatment improved ventricular arrhythmias in patients with NYHA class II and III heart failure 71). Strengths of this study included a control group that was well matched; although the study was not blinded, the control group relaxed in an environment similar to that of the far-infrared saunas (but at 24°C) for the same amount of time. All measurements taken after the intervention were performed on the day after the last treatment and can therefore be considered reliable, as this allowed adequate time for rehydration and fluid compartment redistribution. Patients in this study population, however, had asymptomatic premature ventricular contractions; as such, we cannot generalize these findings to those with symptomatic premature ventricular contractions, although the improvement in NYHA class is clinically relevant.

Another randomized controlled trial 72) (level I evidence) studied 30 patients with NYHA class II or III heart failure: 10 control subjects matched to 20 intervention subjects. The intervention group had 10, 15-minute far-infrared saunas treatments over a 2-week period. There were no adverse events and there were no changes in liver or renal function, electrolyte levels, or hematocrit levels. Clinical symptoms improved in 17 out of 20 patients in the intervention group and were unchanged in the remaining 3 patients 73). Patients’ NYHA classes improved (NYHA class I/II/III = 0/10/10 before treatment vs 1/14/5 after treatment), as did their systolic BP (mean = 107 mm Hg before vs 97 mm Hg after). Diastolic BP, body weight, and left ventricular ejection fraction (LVEF) did not improve significantly. Brain natriuretic peptide levels decreased significantly (mean = 441 pg/mL before vs 293 pg/mL after). In contrast, the control group did not improve either clinically or in terms of brain natriuretic peptide levels. Endothelial function, as assessed by high-resolution ultrasound to determine endothelium-dependent flow-mediated dilation, improved with treatment (mean = 4.4% vs 5.7%, n = 20). The authors 74) concluded that far-infrared saunas treatment improved cardiac function and clinical symptoms in those with heart failure and that this improvement was the result of improved vascular endothelial function. Strengths of the study were similar to those in the study by Kihara et al 75) . Furthermore, before study entry all subjects were in stable clinical condition for at least 1 month, medications had not been changed for at least 2 weeks, and adverse events were defined (dyspnea, angina pectoris, palpitations, hypotension, or dehydration). Although clinical symptoms were assessed using an unvalidated tool, it is reassuring to note the correlation between flow-mediated dilation improvement and both clinical and brain natriuretic peptide improvement.

In a sequential, longitudinal, interrupted time series trial 76) (level II evidence), 15 hospitalized patients with NYHA class II or III heart failure underwent daily 15-minute far-infrared saunas treatment for 4 weeks. Sauna treatment was safely completed without any adverse effects. Symptoms improved in 13 of 15 patients (87%); LVEF increased (mean = 30% vs 34%); every patient’s 6-minute walking distance increased (mean = 388 m vs 448 m); and plasma epinephrine and norepinephrine concentrations both decreased (mean = 40 pg/mL vs 21 pg/mL, 633 pg/mL vs 443 pg/mL, respectively). Further, systolic BP and cardiothoracic ratios improved (mean = 101 mm Hg vs 98 mm Hg, 59% vs 58%, respectively). Changes in weight and brain natriuretic peptide levels did not reach statistical significance, nor did changes in NYHA class (class II/III = 3/12 vs 6/9). The authors 77) concluded that far-infrared saunas treatment was a safe and effective adjunct therapy for heart failure. This is the longest study of far-infrared saunas therapy for heart failure; it is also the only study to document the effect of far-infrared saunas therapy on exercise tolerance. It was, however, not randomized and had a small sample size. Further, adverse events were not defined, clinical symptoms were not evaluated using validated questionnaires, and measurements were taken “immediately after” participants’ last sauna sessions.

Although an additional study supports the use of far-infrared saunas therapy for neonates with heart failure78) , review of that study is beyond the scope of this paper, as the cause of neonatal heart failure is fundamentally different from that of adult heart failure. A brief overview is provided in Table 1 above.

Regular saunas can harm sperm quality

Researchers wanted to look at the effect of long-term sauna use on sperm quality, as previous research has indicated that higher scrotal temperatures in men can lead to poorer sperm health. The researchers 79) recruited 10 healthy male volunteers (average age 33.2 years) to take part in a Finnish sauna programme consisting of two sauna sessions per week for three months at 80-90°C, each lasting 15 minutes. Very few details about the men were reported, so their nationality, demographics and lifestyle behaviors are unknown. Men who had used a sauna in the previous year were not included in the study, so the 10 men didn’t have a history of regular sauna exposure.

Sex hormones, sperm parameters, sperm DNA structure, sperm death (‘apoptosis’, a process where the sperm self-destructs in response to external stimuli) and the expression of genes involved in sperm response to heat and lack of oxygen were all evaluated at the start (baseline). Further measurements were then taken:

  • at the end of each sauna exposure
  • at the end of the sauna programme (three months after the baseline)
  • six months after the baseline (three months after the men had stopped using saunas)

Scrotal temperature was measured with an infrared thermometer before and immediately after each sauna session.

The statistical analysis was basic and compared sperm measures at baseline with the different time points so the effect of the sauna visits on sperm health could be measured.

What were the basic results ?

The average scrotal temperature before the sauna sessions was 34.5°C, which increased to 37.5°C after the session, a statistically significant increase of 3°.

The study found a statistically significant impairment of sperm count and sperm motility both at the end of each sauna session and again at three months 80). No significant difference in sex hormones was found.

Decreases in the percentage of sperm with normal DNA structure and other internal biological sperm structures were also observed after each sauna session and three months after sauna exposure 81).

This corresponded with an increase in the activity of sperm genes associated with coping with heat stress and lack of oxygen, which the researchers believe was brought on by the sauna experience.

The major effects of the sauna were to reduce sperm count and motility 82). Semen volume, sperm structure, and how often the sperm self-destructed did not change throughout the study.

Crucially, the researchers reported that all the effects were reported to be reversed at the six-month time point 83). This suggests the adverse effects of sauna exposure appear to be temporary, at least in men with healthy sperm 84).

How did the researchers interpret the results ?

The researchers concluded that in men with normal sperm, “sauna exposure induces a significant but reversible impairment of spermatogenesis [making sperm], including alteration of sperm parameters, mitochondrial function and sperm DNA packaging” 85).

They went on to suggest that, “the large use of Finnish sauna in Nordic countries and its growing use in other parts of the world makes it important to consider the impact of this lifestyle choice on men’s fertility” 86).

Conclusion

Past research has shown that higher scrotal temperatures in men can lead to poorer sperm health. This proof of concept study tells us that this may also apply to men who use saunas regularly.

The study found that in men with initially healthy sperm, repeated sauna exposure over a three-month period lowered sperm count and reduced sperm motility. Many other aspects of sperm health were unchanged.

Crucially, it also showed that these negative effects were completely reversed at the six-month time point – that is, following a further period of three months without using a sauna.

On its own, this research provides very weak evidence due its tiny sample size – just 10 men were recruited. A study that plucks 10 men from a general population of millions is prone to chance findings and significant bias that may not be applicable to the vast majority of men. For these findings to have more weight, more men would need to be recruited to participate in a larger study.

Other areas that need further investigation include the effects of sauna exposure in men who already have abnormal sperm. These findings may be different (for example, the negative effects may not be as reversible) and this issue was not addressed by this study.

It is also worth pointing out that the majority of British men may not use saunas twice a week for months at a time, so the results are only applicable to the minority that do. Even then, larger studies need to confirm this theory before it can be believed with any certainty.

Overall, this research is consistent with existing fertility advice for men hoping to conceive. Men are advised to keep their testicles cool at around 34.5°C, a few degrees colder than the rest of the body. This helps your body produce the best quality sperm.

Is it safe to use a sauna or jacuzzi if I’m pregnant ?

There’s little research on using saunas, jacuzzis, hot tubs and steam rooms during pregnancy. However, it’s advisable to avoid them because of the risks of overheating, dehydration and fainting.

You’re likely to feel warmer than normal during pregnancy. This is caused by hormonal changes and an increase in blood supply to the skin. These hormonal changes can also make pregnant women feel faint.

Overheating

When you use a sauna, jacuzzi, hot tub or steam room, your body is unable to lose heat effectively by sweating. Your body’s core temperature therefore rises.

It’s possible that a significant rise in your core temperature may affect your unborn baby’s development, particularly in the first 12 weeks of pregnancy.

Feeling faint

If you overheat, more blood flows close to your skin to help cool your body by sweating. This means there’s less blood flow to internal organs, such as your brain. If you don’t get enough blood and oxygen to your brain, it can make you feel faint.

When you’re pregnant, the hormonal changes in your body can make you feel faint more often. You therefore may want to avoid situations where you could get too hot, such as sitting in a jacuzzi or steam room.

Water temperature

The Royal College of Obstetricians and Gynaecologists recommends that if you’re exercising in water – for example, at an antenatal class – the temperature of the water shouldn’t be above 32°C (89.6°F).

If you’re using a hydrotherapy pool, the temperature shouldn’t be above 35°C (95°F). Some hot tubs can be as hot as 40°C (104°F), so it’s best to avoid them.

References   [ + ]

read more

Does detox water work for weight loss ?

detox water

What is detox water

You have probably come across this term “detox water” while searching the internet for quick weight loss products. To the best of our knowledge, no randomised controlled trials have been conducted to assess the effectiveness of “detox water” diets in humans. This is an area that deserves attention so that consumers can be informed of the potential benefits and risks of detox programmes. Currently there is no medical literature on this planet that tells you what “detox water” is or what it’s made of. However, the word “detox” is short for detoxification and the Google definition is “the process of removing toxic substances” or “medical treatment of an alcoholic or drug addict involving abstention from drink or drugs until the bloodstream is free of toxins.”

The people who are promoting detox water for weight loss define detox water as “infused water” that helps flush your system of toxins and improves your health —-but the catch is they say “the main ingredient is water.” According to the detox water promoters, you can make your own detox water simply by adding or “immersing” fruits, vegetables and herbs to water. Furthermore, according to these marketers of “detox water” who are all trying to sell you their “detox water” products detox water, they say “detox water” have zero calories and water detox has many additional health benefits, including:

  • “Improves your mood”
  • “Flushes toxins from your system”
  • “Fills you up so you don’t eat as much junk”
  • “Naturally helps your body release fat cells for water weight loss”
  • “Keeps food moving through your system”
  • “Keeps your organs healthy while you’re sweating”
  • “Reduces muscle fatigue while working out”
  • “Helps you recuperate faster from a workout”
  • “Keeps you from feeling groggy in the afternoon”

The marketers of “detox water” usually throw in a scientific study – to make themselves sound credible – like this one systematic review 1) on water consumption and body weight outcomes that appeared in the 2013 edition of the American Journal of Nutrition. If you take the time to read this article 2), you’ll find that it’s a study on “plain tap water” the one you get from your home tap and it has nothing to do with “detox water.” In fact that same article pointed out that:

“the increasing prevalence of obesity may be connected with the shift from the consumption of water to sugar containing beverages such as soft drinks and fruit juices. Although the causal association is still arguable, sugar containing beverages were proposed to be the dietary risk factor for obesity with the most consistent evidence in children. Thus, increasing water consumption to replace sugar-containing beverages could prevent obesity. Drinking water instead of drinking sugar-containing beverages was shown to reduce the total energy intake with the subsequent meal in adults. Further short-term effects of water consumption include increased satiety, reduced feeling of hunger and slightly increased energy expenditure as the result of a proposed  water-induced thermogenic effect.”

We agree with the research authors of that systematic review 3) that showed increased water consumption has the potential to reduce body weight (despite the weak evidence due to the poor quality of the studies being reviewed) and we have written extensively on this subject matter here:

The bottom line is — we all need to drink water. Water is your body’s principal chemical component and makes up roughly about 60 percent of your body weight. Your body depends on water to survive. Without water, humans would die in a few days. All the cells and organs need water to function. If you do not get enough water each day, the body fluids will be out of balance, causing dehydration. When dehydration is severe, it can be life threatening.

The Dietary Reference Intake for water is between 91 to 125 fluid ounces (2.7 to 3.7 liters) of water per day for adults. However, how much water you need depends on your size, activity level, and the weather where you live. Clean and safe drinking water is critical to sustain human life. Every cell, tissue and organ in your body needs water to work properly.

For example, water:

  • Gets rid of wastes through urination, perspiration and bowel movements
  • Keeps your temperature normal
  • Lubricates and cushions joints
  • Protects sensitive tissues

Lack of water can lead to dehydration — a condition that occurs when you don’t have enough water in your body to carry out normal functions. Even mild dehydration can drain your energy and make you tired. Every day you lose water through your breath, perspiration, urine and bowel movements. Plus you don’t need to rely only on what you drink to meet your fluid needs. What you eat also provides a significant portion. For example, many fruits and vegetables, such as watermelon and spinach, are almost 100 percent water by weight. For your body to function properly, you must replenish its water supply by consuming beverages and foods that contain water.

But there isn’t any convincing evidence that “detox water” or cleansing programs actually remove toxins from your body or improve your health. Weight loss on a detox water may be because tap water have no calories and by increasing your water consumption may lead to certain people (especially older but not younger) to reducing their calorie intake 4), 5). In the 2 interventional studies 6), 7) indicating that water consumption may reduce weight, the middle- to older-aged participants were also instructed to drink 500 ml water before each main meal. Another potential mechanism of water consumption on body weight is the so-called thermogenic, energy consuming effect of ingested water. In 2 experimental studies 8), 9) the consumption of 500 ml of water increased the metabolic rate and resulted in excess energy expenditure by 100 kJ in normal-weight adults and 95 kJ in overweight adults, including the energy needed to warm the water up to body temperature. However, the thermogenic effect of water consumption has not been confirmed by other experimental studies and appears to be minor 10), 11).

If you want to protect yourself from environmental hazards or control your weight, visit the resources that are reputable and reliable. There’s information supported by research that can help you reach your goals.

Here are some trusted sources:

Body Weight Planner. https://www.supertracker.usda.gov/bwp/index.html

To find out about how many calories you should eat to lose weight according to your weight, age, sex, height and physical activity, you can use a FREE online app Body Weight Planner 12)

ChooseMyPlate. https://www.choosemyplate.gov/

To find out about the 5 Food Groups you should have on your plate for a meal, you can use a FREE online app ChooseMyPlate 13)

SuperTracker website: https://supertracker.usda.gov

To find out What and How Much To Eat, you can use a FREE, award-winning, state-of-the-art, online diet and activity tracking tool called SuperTracker 14) from the United States Department of Agriculture Center for Nutrition Policy and Promotion 15). This free application empowers you to build a healthier diet, manage weight, and reduce your risk of chronic diet-related diseases. You can use SuperTracker 16) to determine what and how much to eat; track foods, physical activities, and weight; and personalize with goal setting, virtual coaching, and journaling.

  • BMI Calculator Adults. https://www.cdc.gov/healthyweight/assessing/bmi/adult_BMI/english_bmi_calculator/bmi_calculator.html
  • BMI Calculator Children. https://nccd.cdc.gov/dnpabmi/Calculator.aspx

To find out about your body mass index (BMI), you can use a FREE online BMI calculators from the Centers for Disease Control and Prevention (CDC) – for Adults 17) and for Children 18)

For Women and Weight Loss go here: The Office on Women’s Health 19)

For Weight Control in general go here: The National Center for Complementary and Integrative Health 20)

For Healthy Weight Loss go here: The Centers for Disease Control and Prevention 21)

For Tips on Choosing a Safe and Successful Weight-loss Program go here: The National Institute of Diabetes and Digestive and Kidney Diseases Health Information Center. 22)


Safety Concerns

Red Flags for Fraud:

  • CURE ALL! For unrelated diseases
  • QUICK FIX! Within days
  • ANCIENT REMEDY! Or a secret formula
  • REVOLUTIONARY! Or new science
  • AMAZING RESULTS! Difficult to verify
  • MY TUMOR SHRUNK! Unproven testimonials
  • ACT NOW! Limited availability
  • LOSE WEIGHT! No diet or exercise

The risks of fad dieting

The weight-loss industry is worth more than $Billion in America. However, it is important to realisz that not all diets work and some can also be potentially harmful. Going on a very restrictive fad diet can lead to:

  • slowing of the body’s metabolism (how quickly you burn kilojoules), meaning you will put on weight more easily in future
  • constant feelings of hunger, leading to food cravings and an increased appetite
  • rapid weight loss followed by rapid weight gain
  • an eating disorder, such as anorexia nervosa or bulimia
  • less muscle tissue and lower bone density
  • headaches, insomnia and fatigue
  • lower body temperature
  • constipation and/or diarrhea.

Most of the weight you lose on a fad diet is water and lean muscle, not fat. That’s because when you eat too little, your body breaks down muscle to get enough kilojoules. It is easier for your body to get kilojoules from muscle than from fat.

  • To maintain a lower weight permanently, it is better to change your eating behavior in a way you can keep up long term.

Some of the products and procedures used in detox/cleansing programs may be harmful to your health.

  • The U.S. Food and Drug Administration (FDA) and Federal Trade Commission have taken action against several companies selling detox/cleansing products because they contained illegal, potentially harmful ingredients; were marketed using false claims that they could treat serious diseases; or (in the case of medical devices used for colon cleansing) were marketed for unapproved uses 23), 24). You may want to visit the FDA’s Health Fraud Scams Website here 25): Health Fraud Scams at https://www.fda.gov/ForConsumers/ProtectYourself/HealthFraud/default.htm
  • Drinking large quantities of juice may be risky for people with kidney disease because some juices are high in oxalate, which can worsen kidney problems.
  • People with diabetes should follow the eating plan recommended by their health care team. If you have diabetes, consult your health care provider before making major changes in your eating habits, such as going on a detox diet.
  • Diets that severely restrict calories or the types of food you eat usually don’t lead to lasting weight loss and may not provide all the nutrients you need.
  • Colon cleansing procedures may have side effects, some of which can be serious. Harmful effects are more likely in people with a history of gastrointestinal disease, colon surgery, kidney disease, or heart disease.
  • Detoxification programs often include laxatives, which can cause diarrhea severe enough to lead to dehydration and electrolyte imbalances.

How to lose weight healthily

The key to healthy weight loss is to focus on a healthy lifestyle with plenty of regular exercise and a balanced diet with foods mainly from these 5 healthy food groups:

  • different colored vegetables
  • fruit
  • whole grains
  • lean meats and poultry, fish, eggs, tofu, nuts and seeds, and legumes/beans
  • milk, yogurt and cheese, mostly reduced fat.

You should also drink plenty of water, and limit your intake of foods that contain saturated fat, added sugars, added salt and alcohol.

Tips for losing weight

  • swap foods high in fat, sugar and salt with foods from one of the 5 healthy food groups
  • cut down on takeaways – eat leftovers from last night’s meal instead
  • eat regularly and plan ahead with healthy snacks
  • choose smaller portions
  • eat breakfast
  • enjoy a wide variety of foods
  • exercise for 30-60 minutes every day
  • eat plenty of fiber to fill you up
  • eat more vegetables.

References   [ + ]

read more

Can Sleep Apnea Make Me Gain Weight ?

Sleep-Apnea-Causes

What is Sleep Apnea ?

Obstructive sleep apnea is a potentially serious sleep disorder in which breathing repeatedly stops and starts. It is caused by collapse of the upper airways during sleep and is strongly associated with obesity.

The main symptom of obstructive sleep apnea is daytime sleepiness and it has been suggested it is linked to premature death, hypertension, ischaemic heart disease, stroke and road traffic accidents.

Sleep apnea does not make you gain weight. However, you’re more likely to have sleep apnea if you’re overweight or morbidly obese, a man, African-American, or Latino. Weight has a direct effect on diagnosis of sleep apnea. People who are heavier tend to have severe sleep apnea. The heavier you are, the severer the sleep apnea usually is. Around half the people with obstructive sleep apnea are overweight. Fat deposits around the upper airway may obstruct breathing. However, not everyone with obstructive sleep apnea is overweight and vice versa. We look at a BMI, which is Body Mass Index. If it’s above 30, it is considered obesity, if it’s above 40, it is considered morbid obesity. And the disorder also tends to run in families.

There are more than 80 different sleep disorders and there are several types of sleep apnea, but the most common is obstructive sleep apnea (OSA). This type of apnea occurs when your throat muscles intermittently relax and block your airway during sleep. A noticeable sign of obstructive sleep apnea is snoring, but not everyone who has sleep apnea snores !

People with obstructive sleep apnea may not be aware that their sleep was interrupted. In fact, some people with this type of sleep apnea think they sleep well all night.

When the muscles relax, your airway narrows or closes as you breathe in, and you can’t get an adequate breath in. This may lower the level of oxygen in your blood. Your brain senses this inability to breathe and briefly rouses you from sleep so that you can reopen your airway. This awakening is usually so brief that you don’t remember it.

You may make a snorting, choking or gasping sound. This pattern can repeat itself five to 30 times or more each hour, all night long. People with the condition actually stop breathing up to 400 times throughout the night. These pauses last 10 to 30 seconds, and they’re usually followed by a snort when breathing starts again. This breaks your sleep cycle and can leave you tired during the day. All those breaks in sleep take a toll on your body and mind. These disruptions impair your ability to reach the desired deep, restful phases of sleep, and you’ll probably feel sleepy during your waking hours. When the condition goes untreated, it’s been linked to job-related injuries, car accidents, heart attacks, and strokes.

The most common signs and symptoms of obstructive and central sleep apneas include:

  • Loud snoring, which is usually more prominent in obstructive sleep apnea
  • Episodes of breathing cessation during sleep witnessed by another person
  • Abrupt awakenings accompanied by shortness of breath, which more likely indicates central sleep apnea
  • Awakening with a dry mouth or sore throat
  • Morning headache
  • Difficulty staying asleep (insomnia)
  • Excessive daytime sleepiness (hypersomnia)
  • Attention problems
  • Irritability.

Consult a medical professional if you experience, or if your partner notices, the following:

  • Snoring loud enough to disturb the sleep of others or yourself
  • Shortness of breath, gasping for air or choking that awakens you from sleep
  • Intermittent pauses in your breathing during sleep
  • Excessive daytime drowsiness, which may cause you to fall asleep while you’re working, watching television or even driving

There are no certain foods that will help with sleep apnea, but losing weight by eating a low-calorie, low-fat diet and increasing your exercise will definitely help you manage your sleep apnea better. It’s best you avoid caffeine. And of course, you should avoid high-fat, high-calorie diets. We also highly recommend avoiding alcohol, narcotics, sedatives. Anything that makes you more sleepy will make your sleep apnea worse. Alcohol relaxes the muscles in the back of your throat. That makes it easier for the airway to become blocked in people with sleep apnea. Sleeping pills have the same effect.

If you sleep on your back, gravity can pull the tissues in the throat down, where they’re more likely to block your airway. Sleep on your side instead to open your throat. Certain pillows can help keep you on your side. Some people even go to bed in shirts with tennis balls sewn onto the back.

A dentist or orthodontist can fit you with a mouthpiece or oral appliance to ease mild sleep apnea. The device is custom-made for you, and it adjusts the position of your lower jaw and tongue. You put it in at bedtime to help keep your airway open while you sleep.

Treatment of Obstructive Sleep Apnea

The mainstay of medical treatment is a machine used at night to apply continuous positive airways pressure (CPAP). The machine blows air through the upper air passages via a mask on the mouth or nose to keep the throat open. You can adjust the flow until it’s strong enough to keep your airway open while you sleep. It’s the most common treatment for adults with moderate to severe obstructive sleep apnea.

Reviewed of all randomised controlled trials (source 1)) that had been undertaken to evaluate the benefit of CPAP in adult patients with sleep apnoea. The overall results demonstrate that in people with moderate to severe sleep apnoea, continuous positive airways pressure can improve measures of sleepiness, quality of life, bodily pain and associated daytime sleepiness 2). CPAP leads to lower blood pressure compared with control, although the degree to which this is achieved may depend upon whether people start treatment with raised blood pressures. Oral appliances are also used to treat sleep apnoea but, whilst some people find them more convenient to use than CPAP, they do not appear to be as effective at keeping the airway open at night. Further good quality trials are needed to define who benefits, by how much and at what cost. Further trials are also needed to evaluate the effectiveness of CPAP in comparison to other interventions, particularly those targeted at obesity.

How might sleep deficiency and sleep apnea be related to weight gain

Almost all of us require 7-8 hours sleep per night. For optimal neurocognitive function, you may require 9 hours of sleep per 24 hour period. After 18 hours without sleep, your cognitive function falls to the equivalent of 1 alcholic drink and at 24 hours of sleep deprivation, you are legally “drunk” 3). These data suggest that chronic sleep restriction (insufficient sleep duration over consecutive days), commonplace in millions of Americans, can negatively impact cognitive performance immediately upon awakening and have prolonged effects for at least one hour, even in the absence of extended wakefulness. Young adults’ performance on spatial working memory task deteriorated following cumulative sleep deprivation whereas their performance on decision making task was not affected. The present study indicates that sleep deprivation has a differential impact on the neurobehavioural functoning of young adults 4). In adolescents (aged 15 to 17 years), who are sleep deprived, suffered from dose-dependent and time-of-day dependent deficits to sustained attention 5).  These findings are important for individuals needing to perform tasks quickly upon awakening, especially those who do not regularly obtain sufficient sleep 6). And in voluntary experimental sleep restriction (an experiment on volunteers who are sleep restricted) results in decreases in self-reported psychological health and wellbeing and increases in measures of inflammation 7).

There are more and more data that support a link between obesity and insufficient sleep. The growth of America’s obesity epidemic over the past 40 years correlates with a progressive decline in the amount of sleep reported by the average adult. In large population-based studies, obesity has been found to be related to reduced amounts of sleep (see Figure 1 below) 8).

Sleep restriction or chronic partial sleep loss, increases obesity and diabetes risk by disrupting glucose metabolism and reducing whole-body insulin sensitivity without a compensatory increase in insulin secretion. Healthy adipocytes suppress hormone sensitive lipase activity in response to insulin, which severely limits non-esterified fatty acid release. Elevated overnight non-esterified fatty acid (NEFA) levels are correlated with the reduction in insulin sensitivity that occurs in sleep restriction. Additionally, subcutaneous adipose biopsies from sleep-restricted subjects have reduced pAKT, evidence that sleep restriction decreases insulin sensitivity in adipocytes. Sleep restriction induces symmetrical changes in both glucose and lipid markers of insulin sensitivity. Preliminary evidence indicates that non-esterified fatty acid rate of utilization is increased in response to sleep restriction. In the context of whole-body metabolism, this indicates a shift in Randle cycle fuel selection by metabolic tissues. Additionally, a greater concentration of glucose was required to initiate non-esterified fatty acid suppression, evidence that sleep restriction functionally impairs hormone sensitive lipase activity 9).

A recent experimental study 10) published in the journal Sleep provides some clues. Sleep restriction to 4.5 hours per night was compared with normal sleep duration for 4 nights each in a group of young, healthy adults. When measured at the end of 4 days, the ratio of 2 hormones responsible for hunger levels, ghrelin (which increases appetite) and leptin (which reduces appetite) was altered to favor greater appetite. Other studies have observed the same thing. However, this study measured something the others hadn’t: snack consumption, particularly items with greater fat and protein content, was higher after sleep restriction — and, strikingly, the participants’ levels of endocannabinoids increased corresponding to the time of greater snack consumption. Endocannabinoids are chemicals that kindle appetite (like ghrelin), but more importantly, also stimulate reward centers in the brain. Thus, this finding suggests that sleep restriction may make the act of eating more satisfying. Could it be that insufficient sleep contributes to weight gain by stimulating the brain to make eating more pleasurable ? If so, the “lack of willpower” may not be due to personal weakness, but rather a result of an addictive chemical imbalance resulting from sleep loss 11).

Lack of sufficient sleep may also compromise the effectiveness of your typical weight loss diets for weight loss and related metabolic risk reduction. Sleep deprivation decreased the proportion of weight lost as fat by 55% and increased the loss of lean-body mass by 60% 12). The amount of sleep contributes to the maintenance of fat-free body mass at time of caloric restriction (reduced calorie intake). For example, night-shift worker often have more metabolic and cardiovascular disease. Sleep restriction and circadian misalignment have been shown to decrease glucose tolerance. In an experiment 13) involving restricting the sleep time to 5h for five nights, researchers have been able to show that subjects blood glucose become impaired and elevated after a oral glucose tolerance test (a test to diagnose diabetes). Despite the test subjects were also given a one 8h recovery sleep episode, their blood glucose impairment remains. However, a one night of sleep deprivation did not affect glucose tolerance and did not add to the effects of prior sleep restriction 14).

In addition, chronic sleep loss for five days also exhibited long-lasting effects on the reduction of positive affect which were not reset by one recovery night. (Positive affect helps people cope with difficult situations. People with high positive affect have been shown to be happier, have more success in life and better relationships than people scoring low). Positive affect decreased further following acute sleep deprivation, indicating that people’s sleep curtailing lifestyles could make them more vulnerable to additional acute sleep loss. Five days of chronically reduced sleep exhibited a comparable reduction in positive affect as a sleepless night 15).

The study also showed that repetitive sleep deprivation and sleep disruption resulted greater feelings of fatigue and sleepiness, which could indicate a greater health and safety risk, that will not resolve with just a single night of recovery sleep 16).

Night-shift workers (see Figure 1), often have sleep disorders (which can become chronic), gastroinstestinal disease, increased incidence of cardiovascular disease, increased triglyceride and possibly an increase in late-onset diabetes 17).

Figure 1. Showing the number of hours sleep and the body weight gain over the years.

weight trends with hours of sleep

[Source 18) ]

All these exciting findings require further investigation. However, they already provide additional evidence that sufficient sleep is important for optimal health, and in particular, for combating obesity. They also suggests that greater efforts need to be made on the part of the general public to get the 7 hours or more of nightly sleep as recommended by the American Academy of Sleep Medicine.

Summary Sleep Deprivation and Sleep Apnea

  • Causes are multifactorial and complex
  • Inadequate sleep has major health consequences
  • Impaired brain function not surprising
  • Increased metabolic and cardiovascular complications, like weight gain and more respiratory events, also present
  • Research data are evolving.

Sleep Deprivation and Childhood Obesity

Dozens of studies spanning five continents have looked at the link between sleep duration and obesity in children. Most (but not all) have found a convincing association between too little sleep and increased weight 19), 20), 21), 22), 23), 24), 25). The strongest evidence has come from studies that have tracked the sleep habits of large numbers of children over long periods of time (longitudinal studies), and have also adjusted for the many other factors that could increase children’s obesity risk, such as parents’ obesity, television time, and physical activity.

A British study, for example, that followed more than 8,000 children from birth found that those who slept fewer than 10 and a half hours a night at age 3 had a 45 percent higher risk of becoming obese by age 7, compared to children who slept more than 12 hours a night 26). Similarly, Project Viva, a U.S. prospective cohort study of 915 children, found that infants who averaged fewer than 12 hours of sleep a day had twice the odds of being obese at age 3, compared with those who slept for 12 hours or more 27). Maternal depression during pregnancy, introduction of solid foods before the age of 4 months, and infant TV viewing were all associated with shorter sleep duration 28).

Childhood sleep habits may even have a long-term effect on weight, well into adulthood. Researchers in New Zealand followed 1,037 children from birth until age 32, collecting information from parents on the average number of hours their children slept at ages 5, 7, 9, and 11 29). Each one hour reduction in sleep during childhood was associated with a 50 percent higher risk of obesity at age 32.

Keep in mind that these are all observational studies-and even though they suggest an association between sleep and weight, they cannot conclusively show that getting enough sleep lowers children’s risk of obesity. More definitive answers may come from randomized clinical trials that test whether increasing infant or childhood sleep lowers the risk of obesity.

The first such trial to look at the influence of a sleep intervention on childhood obesity, fielded in Australia, enrolled 328 7-month-old infants who already had sleep problems, as reported by their mothers 30). The trial sought to test whether counseling mothers on behavioral techniques to manage infant sleep problems would improve infants’ sleep and also lower mothers’ rates of depression; the researchers followed up at intervals over six years to see if the intervention had any effect on obesity. At one year of age, infants in the intervention group had fewer reported sleep problems than infants in the control group, but there was no difference in sleep duration between the groups; at 2 and 6 years of age, there was no difference in sleep problems or sleep duration between the groups. Thus, it is perhaps no surprise that at 6 years of age, obesity rates were the same in both groups. The study also had serious shortcomings, among them, the fact that 40 percent of the participants had dropped out by the six-year follow-up.

Two large trials currently underway, one in the U.S. and the other in New Zealand, should offer more conclusive evidence on the relationship between sleep duration and obesity 31), 32). Both trials are testing whether teaching parents how to develop good sleep and feeding habits in their newborn infants helps prevent the development of obesity during the toddler years. Early results from the U.S. study have been encouraging 33).

Sleep Deprivation and Adult Obesity

Most studies that measure adults’ sleep habits at one point in time (cross-sectional studies) have found a link between short sleep duration and obesity 34). Longitudinal studies, though, can better answer questions about causality-and in adults the findings from such studies have been less consistent than those in children 35).

The largest and longest study to date on adult sleep habits and weight is the Nurses’ Health Study, which followed 68,000 middle-age American women for up to 16 years 36). Compared to women who slept seven hours a night, women who slept five hours or less were 15 percent more likely to become obese over the course of the study. A similar investigation in the Nurses’ Health Study and the Nurses’ Health Study II, a cohort of younger women, looked at the relationship between working a rotating night shift-an irregular schedule that mixes day and evening work with a few night shifts, throwing off circadian rhythms and impairing sleep-and risk of type 2 diabetes and obesity 37). Researchers found that the longer women worked a rotating night shift, the greater their risk of developing diabetes and obesity.

Other researchers have fielded smaller, shorter longitudinal studies on adult sleep habits and weight in the U.S. and Canada as well as the U.K. and Europe 38).  Some have found a link between short sleep duration and obesity, while others have not. Interestingly, a few studies in adults have reported that getting too much sleep is linked to a higher risk of obesity 39), 40). This is most likely due to a phenomenon that researchers call “reverse causation.” People who sleep for longer than normal may have an obesity-related condition that has led to their longer sleep habits-sleep apnea, obstructive lung disease, depression, or cancer, for example-rather than long sleep coming first and then leading to obesity.

An in-process pilot study may provide more answers on whether getting a longer night’s sleep can help with weight loss 41). Researchers are recruiting 150 obese adults who are “short sleepers” (who sleep fewer than 6.5 hours a night) and randomly assigning them to either maintain their current sleep habits or else receive coaching on how to extend their nightly sleep by at least half an hour to an hour. Investigators will track study participants’ sleep habits and weight for three years.

How Does Sleep Affect Your Body Weight

Researchers speculate that there are several ways that chronic sleep deprivation might lead to weight gain, either by increasing how much food people eat or decreasing the energy that they burn 42).

Sleep deprivation could increase your energy intake by

  • Increasing hunger: Sleep deprivation may alter the hormones that control hunger 43). One small study, for example, found that young men who were deprived of sleep had higher levels of the appetite-stimulating hormone ghrelin and lower levels of the satiety-inducing hormone leptin, with a corresponding increase in hunger and appetite-especially for foods rich in fat and carbohydrates 44).
  • Giving you more time to eat: People who sleep less each night may eat more than people who get a full night’s sleep simply because they have more waking time available 45). Recently, a small laboratory study found that people who were deprived of sleep and surrounded by tasty snacks tended to snack more-especially during the extra hours they were awake at night-than when they had adequate sleep 46).
  • Prompting you to choose less healthy diets: Observational studies have not seen a consistent link between sleep and food choices 47). But one study of Japanese workers did find that workers who slept fewer than six hours a night were more likely to eat out, have irregular meal patterns, and snack than those who slept more than six hours 48).

Sleep deprivation could decrease your energy expenditure by

  • Decreasing your physical activity: People who don’t get enough sleep are more tired during the day, and as a result may curb their physical activity 49). Some studies have found that sleep-deprived people tend to spend more time watching TV, less time playing organized sports, and less time being physically active than people who get enough sleep. But these differences in physical activity or TV viewing are not large enough to explain the association between sleep and weight 50).
  • Lowering your body temperature: In laboratory experiments, people who are sleep-deprived tend to see a drop in their body temperatures 51). This drop, in turn, may lead to decreased energy expenditure. Yet a recent study did not find any link between sleep duration and total energy expenditure 52).

Twelve Simple Tips to Improve Your Sleep

Following healthy sleep habits can make the difference between restlessness and restful slumber 53). Researchers have identified a variety of practices and habits—known as “sleep hygiene”—that can help anyone maximize the hours they spend sleeping, even those whose sleep is affected by insomnia, jet lag, or shift work.

Sleep hygiene may sound unimaginative, but it just may be the best way to get the sleep you need in this 24/7 age. Here are some simple tips 54) for making the sleep of your dreams a nightly reality:

1) Avoid Caffeine, Alcohol, Nicotine, and Other Chemicals that Interfere with Sleep

As any coffee lover knows, caffeine is a stimulant that can keep you awake. So avoid caffeine (found in coffee, tea, chocolate, cola, and some pain relievers) for four to six hours before bedtime. Similarly, smokers should refrain from using tobacco products too close to bedtime.

Although alcohol may help bring on sleep, after a few hours it acts as a stimulant, increasing the number of awakenings and generally decreasing the quality of sleep later in the night. It is therefore best to limit alcohol consumption to one to two drinks per day, or less, and to avoid drinking within three hours of bedtime.

2) Turn Your Bedroom into a Sleep-Inducing Environment

A quiet, dark, and cool environment can help promote sound slumber. Why do you think bats congregate in caves for their daytime sleep ? To achieve such an environment, lower the volume of outside noise with earplugs or a “white noise” appliance. Use heavy curtains, blackout shades, or an eye mask to block light, a powerful cue that tells the brain that it’s time to wake up. Keep the temperature comfortably cool—between 60 and 75°F—and the room well ventilated. And make sure your bedroom is equipped with a comfortable mattress and pillows.

Also, if a pet regularly wakes you during the night, you may want to consider keeping it out of your bedroom.

It may help to limit your bedroom activities to sleep and sex only. Keeping computers, TVs, and work materials out of the room will strengthen the mental association between your bedroom and sleep.

3) Establish a Soothing Pre-Sleep Routine

Ease the transition from wake time to sleep time with a period of relaxing activities an hour or so before bed. Take a bath (the rise, then fall in body temperature promotes drowsiness), read a book, watch television, or practice relaxation exercises. Avoid stressful, stimulating activities—doing work, discussing emotional issues. Physically and psychologically stressful activities can cause the body to secrete the stress hormone cortisol, which is associated with increasing alertness. If you tend to take your problems to bed, try writing them down—and then putting them aside.

4) Go to Sleep When You’re Truly Tired

Struggling to fall sleep just leads to frustration. If you’re not asleep after 20 minutes, get out of bed, go to another room, and do something relaxing, like reading or listening to music until you are tired enough to sleep.

5) Don’t Be a Nighttime Clock-Watcher

Staring at a clock in your bedroom, either when you are trying to fall asleep or when you wake in the middle of the night, can actually increase stress, making it harder to fall asleep. Turn your clock’s face away from you.

And if you wake up in the middle of the night and can’t get back to sleep in about 20 minutes, get up and engage in a quiet, restful activity such as reading or listening to music. And keep the lights dim; bright light can stimulate your internal clock. When your eyelids are drooping and you are ready to sleep, return to bed.

6) Use Light to Your Advantage

Natural light keeps your internal clock on a healthy sleep-wake cycle. So let in the light first thing in the morning and get out of the office for a sun break during the day.

7) Keep Your Internal Clock Set with a Consistent Sleep Schedule

Going to bed and waking up at the same time each day sets the body’s “internal clock” to expect sleep at a certain time night after night. Try to stick as closely as possible to your routine on weekends to avoid a Monday morning sleep hangover. Waking up at the same time each day is the very best way to set your clock, and even if you did not sleep well the night before, the extra sleep drive will help you consolidate sleep the following night.

8) Nap Early—Or Not at All

Many people make naps a regular part of their day. However, for those who find falling asleep or staying asleep through the night problematic, afternoon napping may be one of the culprits. This is because late-day naps decrease sleep drive. If you must nap, it’s better to keep it short and before 5 p.m.

9) Lighten Up on Evening Meals

Eating a pepperoni pizza at 10 p.m. may be a recipe for insomnia. Finish dinner several hours before bedtime and avoid foods that cause indigestion. If you get hungry at night, snack on foods that (in your experience) won’t disturb your sleep, perhaps dairy foods and carbohydrates.

10) Balance Fluid Intake

Drink enough fluid at night to keep from waking up thirsty—but not so much and so close to bedtime that you will be awakened by the need for a trip to the bathroom.

11) Exercise Early

Exercise can help you fall asleep faster and sleep more soundly—as long as it’s done at the right time. Exercise stimulates the body to secrete the stress hormone cortisol, which helps activate the alerting mechanism in the brain. This is fine, unless you’re trying to fall asleep. Try to finish exercising at least three hours before bed or work out earlier in the day.

12) Follow Through

Some of these tips will be easier to include in your daily and nightly routine than others. However, if you stick with them, your chances of achieving restful sleep will improve. That said, not all sleep problems are so easily treated and could signify the presence of a sleep disorder such as apnea, restless legs syndrome, narcolepsy, or another clinical sleep problem. If your sleep difficulties don’t improve through good sleep hygiene, you may want to consult your physician or a sleep specialist.

References   [ + ]

read more

Can I Boost My Metabolism to Lose Weight ?

basal metabolic rate with age and sex

How To Boost Your Metabolism

What is metabolism ?  Metabolism is the sum of the chemical reactions that take place within each cell of your body that provide energy for vital processes in order to maintain life. It is the process by which your bodies combine nutrients with oxygen to produce the energy your body needs in order to maintain normal bodily functions. This energy is measured in calories and calories are considered fuel to your bodies.

Daily total energy expenditure (TEE) is the net amount of energy utilized by animals and humans to maintain core physiological functions and to allow locomotion 1). Three main components of energy balance determine total energy expenditure:

  1. Resting Energy Expenditure (REE) or Resting Metabolic Rate (RMR) or Basal metabolic rate (BMR),
  2. the Thermic Effect of Food (TEF), which is also called diet induced thermogenesis. The Thermic Effect of Food (TEF) represents approximately 8–15% of total daily energy expenditure (TEE) 2) and
  3. the energy expended for physical activity 3).

In this study 4) comparing the thermic effect of food responsiveness in habitually exercising and sedentary healthy adult humans found greater Thermic Effect of Food (TEF) in habitual exercisers than sedentary healthy adult humans. Thermic Effect of Food (TEF) is believed to be mediated in part by sympathetic nervous system activation and consequent beta-adrenergic receptor (beta-AR) stimulation of metabolism. The greater Thermic Effect of Food (TEF) in habitual exercisers is attributable in part to their augmented beta-AR thermogenic responsiveness. The study results also suggest that peripheral thermogenic responsiveness to beta-adrenergic receptor (beta-AR) stimulation is a physiological determinant of TEF and hence energy balance in healthy adult humans 5).

Additional components may exist (i.e. energy costs of emotion), but play a minor role with respect to energy balance 6), 7), 8). Multiple factors affect our daily energy needs whereby age, body composition, thyroid hormone status, catecholamine levels, sympathoadrenergic activity, ambient and body temperature, disease states and drug treatment regimens are among the most important determinants 9).

The largest component of total daily energy expenditure (TEE), at least among individuals not involved in extremely high volumes of exercise, is resting energy expenditure (REE), which is often mentioned interchangeably with resting metabolic rate (RMR) or basal metabolic rate (BMR). Basal metabolic rate is the energetic cost of the biological processes required for survival at rest. As a matter of technical trivia, it is not uncommon that the term resting energy expenditure (REE) is synonymously interchanged with with resting metabolic rate (RMR) or basal metabolic rate (BMR). However, the basal metabolic rate (BMR) is measured in an overnight fasted state, lying supine at complete rest, in the postabsorptive state (the condition in which the gastrointestinal tract is empty of nutrients and body stores must supply required energy) 10). By contrast, resting energy expenditure (REE) or resting metabolic rate (RMR) represents fasted-state energy expenditure at rest at any time of the day and can range 3–10% higher than BMR due to the residual influence of TEF and physical activity 11).

Basal metabolic rate typically amounts to 60–70% of total daily energy expenditure (TEE). The other main component of total daily energy expenditure (TEE) is non-resting energy expenditure, which is comprised of 3 sub-components: non-exercise activity thermogenesis (NEAT), exercise activity thermogenesis (ExEE), and finally, the Thermic Effect of Food (TEF). The non-exercise activity thermogenesis (NEAT) encompasses the energy expenditure of occupation, leisure, basic activities of daily living, and unconscious/spontaneous activity such as fidgeting. While Resting Metabolic Rate (RMR) and Thermic Effect of Food (TEF) are relatively static, non-exercise activity thermogenesis (NEAT) and exercise activity thermogenesis (ExEE) vary widely within and across individuals. Exercise activity thermogenesis (ExEE) has been reported to range from 15 to 30% of total daily energy expenditure (TEE) 12), but the role of non-exercise activity thermogenesis (NEAT) is more easily overlooked. Non-exercise activity thermogenesis (NEAT) comprises ~15% of total daily energy expenditure (TEE) in sedentary individuals and perhaps 50% or more in highly active individuals 13). The impact of non-exercise activity thermogenesis (NEAT) can be substantial since it can vary by as much as 2000 kcals between individuals of similar size 14). Table 1 ( see below) outlines the components of total daily energy expenditure (TEE), with examples of low, moderate, and high total daily energy expenditure (TEE) 15), 16), 17).

Table 1. Components of total daily energy expenditure

Component of TEE    Percent of TEEExample:
1600 kcal TEE
Example:
2600 kcal TEE
Example:
3600 kcal TEE
Thermic effect of food (TEF)8–15%128–240208–390288–540
Exercise activity thermogenesis (ExEE)15–30%240–480390–780540–1080
Non-exercise activity thermogenesis (NEAT)15–50%240–800390–1300540–1800
Basal metabolic rate (BMR) or Resting EE (REE)60–70%960–11201560–18202160–2520
[Source 18)]

What is Resting Energy Expenditure (REE) ?

Resting Energy Expenditure (REE) represents the minimal amount of energy expended for homeostatic processes (for the normal functioning of cells and organs), in other word, it’s the minimum amount of energy required by your body just to survive at rest. Resting Energy Expenditure (REE) is essentially a function of lean body mass (LBM), as about 80% of REE is accounted for by this variable within and across species. In free-living individuals the largest component of total daily energy expenditure (TEE), at least among individuals not involved in extremely high volumes of exercise, is the resting energy expenditure (REE), which typically occupies the main percentage ~ 60-70% of your total daily energy expenditure (TEE) (see figure 1).

As a matter of technical trivia, it is not uncommon that the term resting energy expenditure (REE) is synonymously interchanged with with resting metabolic rate (RMR) or basal metabolic rate (BMR). However, the basal metabolic rate (BMR) is measured in an overnight fasted state, lying supine at complete rest, in the postabsorptive state (the condition in which the gastrointestinal tract is empty of nutrients and body stores must supply required energy) 19). By contrast, resting energy expenditure (REE) or resting metabolic rate (RMR) represents fasted-state energy expenditure at rest at any time of the day and can range 3–10% higher than BMR due to the residual influence of TEF and physical activity 20).

The other main component of total daily energy expenditure (TEE) is non-resting energy expenditure, which is comprised of 3 subcomponents:

  • Non-exercise activity thermogenesis (NEAT),
  • Exercise activity thermogenesis (ExEE), and finally,
  • Thermic Effect of Food (TEF).

NEAT encompasses the energy expenditure of occupation, leisure, basic activities of daily living, and unconscious/spontaneous activity such as fidgeting. While BMR and TEF are relatively static, Non-exercise activity thermogenesis (NEAT) and Exercise activity thermogenesis (ExEE) vary widely within and across individuals. Exercise activity thermogenesis (ExEE) has been reported to range from 15 to 30% of total daily energy expenditure (TEE) 21), but the role of non-exercise activity thermogenesis (NEAT) is more easily overlooked. Non-exercise activity thermogenesis (NEAT) comprises ~15% of total daily energy expenditure (TEE) in sedentary individuals and perhaps 50% or more in highly active individuals 22). The impact of non-exercise activity thermogenesis (NEAT) can be substantial since it can vary by as much as 2000 kcals between individuals of similar size 23). Table 1 ( see above) outlines the components of total daily energy expenditure (TEE), with examples of low, moderate, and high total daily energy expenditure (TEE) 24), 25), 26).

The rate at which your body uses up kilojoules (or energy) to carry out these vital metabolism functions is called the metabolic rate:

  • Around five to ten per cent of your energy is used to eat, digest and metabolise food.
  • Another 20 per cent goes to burning kilojoules during physical activity (if you are a normally-active person).
  • The remaining 50–80 per cent is the amount of energy used while you are at rest. This is known as your basal metabolic rate or BMR. The faster your BMR is, the more efficiently your body burns up kilojoules.

Your BMR can be influenced by many factors including your body size, age, gender, genetic predisposition, hormones and what you eat. The amount of exercise you do can have an effect as well.

Table 2. Energy Expenditure of Different Tissues/Organs

Organ or tissueMetabolic rate (kcal/kg/day)% Overall REEWeight (kg)% of Total body weight
Adipose4.541521.4
Other (bone, skin, intestine, glands)121623.233.1
Muscle13222840.0
Liver200211.82.6
Brain240221.42.0
Heart40090.30.5
Kidneys40080.30.5
[Source 27)]

Note: Muscles, Brain and Liver are the top 3 users of energy at rest.

An awareness of tissue-specific metabolism can be helpful in understanding the resting metabolic benefits of improving body composition. It can also serve to clarify the widely misunderstood and often overestimated contribution of muscle to Resting Energy Expenditure (REE). McClave and Snider 28) reported that the greatest contributors to Resting Energy Expenditure (REE), per unit of mass, are the heart and kidneys, each spending approximately 400 kcal/kg/day. Next in the hierarchy are the brain and the liver, at 240 and 200 kcal/kg/day, respectively. These four organs constitute up to 70–80% of Resting Energy Expenditure (REE). In contrast, muscle and adipose tissue expend 13 and 4.5 kcal/kg/day, respectively. This should debunk the notion that increases in muscle mass give individuals the license to reduce dietary discretion. Even a relatively significant muscular gain of 5 kg would increase Resting Energy Expenditure (REE) by only ~65 kcal/day. However, on a net basis (accounting for the total mass of each tissue in the body), muscle, brain, and liver are the top-3 contributors to overall Resting Energy Expenditure (REE). Thus, substantial losses in lean muscle mass – including muscle – can meaningfully impact Resting Energy Expenditure (REE).

Figure 1.  Model of human energy expenditure compartments 29). Exercise related activity (e.g. jogging, walking, cycling, weight lifting) is exercise energy expenditure (ExEE), while spontaneous physical activity relates to nonexercise activity thermogenesis (NEAT) (e.g. maintenance of posture and other physical activities of daily life). Note that parts of spontaneous physical activity are beyond voluntary control, i.e. “fidgeting”.

resting energy expenditure

Rather than slow metabolism, factors more likely to contribute to weight gain include:

  • Eating too many calories > if you eat and drink more kilojoules than we need for your metabolism and exercise, you store it mostly as fat.
  • Getting too little physical activity (sedentary lifestyle)
  • Genetics and family history
  • Certain medications
  • Unhealthy habits, such as routinely not getting enough sleep
  • Aging
  • Starvation and Dieting
  • Being female.

If you’re concerned about slow metabolism and your weight, talk to your doctor about healthy changes you can make. And if you still think you have slow metabolism, your doctor can check your metabolism or check for rare conditions that can cause problems with metabolism and weight, such as hypothyroidism and Cushing’s syndrome.

Influences on Basal Metabolic Rate

Your basal metabolic rate is influenced by multiple factors working in combination, including:

  • Body size – larger adult bodies have more metabolising tissue and a larger BMR
  • Amount of lean muscle tissue – muscle burns kilojoules rapidly
  • Amount of body fat – fat cells are ‘sluggish’ and burn far fewer kilojoules than most other tissues and organs of the body
  • Crash dieting, fad diets – eating too few kilojoules encourages the body to slow the metabolism to conserve energy. BMR can drop by up to 15 per cent. Loss of lean muscle tissue further reduces BMR
  • Age – metabolism slows with age due to loss of muscle tissue, but also due to hormonal and neurological changes
  • Growth – infants and children have higher energy demands per unit of body weight due to the energy demands of growth and the extra energy needed to maintain their body temperature
  • Gender – generally, men have faster metabolisms than women because they tend to be larger
  • Genetic predisposition – your metabolic rate may be partly decided by your genes
  • Hormonal and nervous controls – BMR is controlled by the nervous and hormonal systems. Hormonal imbalances can influence how quickly or slowly the body burns kilojoules
  • Environmental temperature – if temperature is very low or very high, the body has to work harder to maintain its normal body temperature, which increases the BMR
  • Infection or illness – BMR increases because the body has to work harder to build new tissues and to create an immune response
  • Amount of physical activity – hard-working muscles need plenty of energy to burn. Regular exercise increases muscle mass and teaches the body to burn kilojoules at a faster rate, even when at rest
  • Drugs – some drugs, like caffeine or nicotine, can increase the BMR
  • Dietary deficiencies – for example, a diet low in iodine reduces thyroid function and slows the metabolism.

Boosting metabolism is believed by some people to be the holy grail of weight loss. However, trying to boost your metabolism probably won’t lead to weight loss, at least not to the degree that changing your diet and lifestyle habits will. Only rarely is excessive weight gain caused by a medical problem that slows metabolism, such as Cushing’s syndrome or an underactive thyroid gland (hypothyroidism).

Is it possible to be overweight because of a slow metabolism ?

There is such a thing as a slow metabolism. But slow metabolism is rare, and it’s usually not what’s behind being overweight or obese — that’s ultimately a result of interactions among genetics, diet, physical activity and other factors 30). Currently, there is no hard evidence except for a theory called “adaptive thermogenesis” 31). Joosen and Westerterp 32) examined the literature (11 studies) to see if “adaptive thermogenesis” existed in overeating experiments. No evidence beyond the theoretical costs of increased body size and thermic effect of food were found. Nevertheless, there is substantial interindividual variability in the energetic response to overfeeding. They found in overfeeding experiments, weight gain is often less than expected from the energy excess intake. In part this is the result of an obligatory increase in energy expenditure associated with the increased body weight and fat-free mass 33) and the larger amount of food to be digested and absorbed 34). In addition, some individuals appear to be resistant to weight/fat gain, showing a concurrent increase in resting energy expenditure alongside increased food intake. Others show less homeostatic drive and greater efficiency of energy storage. This inter-individual variability is due, at least in part, to differences in non-exercise activity thermogenesis (NEAT) 35). They also found that the nonexercise activity thermogenesis (NEAT) which is associated with fidgeting, maintenance of posture and other physical activities of daily life, is the most variable component of total energy expenditure between persons 36) and thus is most likely the main contributor to variation in weight gain during overeating. Indeed, several overfeeding experiments show that those subjects with the largest increase or decrease in nonexercise activity thermogenesis (NEAT) have respectively the lowest and highest weight gains 37), 38). But relatively large changes in nonexercise activity thermogenesis (NEAT) (as percentage of total daily energy expenditure) above increased costs of performing physical activity due to an increased body weight, might reflect behavioral changes rather than adaptive thermogenesis. In summary, evidence for adaptive thermogenesis as a mechanism to explain interindividual differences in weight gain on the same overeating regimen is still inconsistent and hard to prove 39).

  • In a small study on the thermic effect of food and exercise in lean and obese men of similar lean body mass 40). Segal and colleagues put eight lean and eight obese men to 30 min of cycle exercise over 5 days to determine whether exercise before or after a meal enhances thermogenesis. The groups were matched for age, height, and lean body mass in order to study the relationship between thermogenesis and body fat independent of lean body mass. Treatments on respective days were Day 1) 3 hour rest, no meal; Day 2) 3 hour rest after a 750-kcal mixed meal (14% protein, 31% fat, 55% carbohydrate); Day 3) during and 3 h after 30 min of cycling, no meal; Day 4) during and 3 h after 30 min of cycling, meal 30 min before exercise; and Day 5) 3 h after 30 min of cycling, meal immediately after exercise. The thermic effect of food, was significantly greater for the lean than the obese men under the resting state, exercise and both post-exercise conditions. However, for the lean men the thermic effect of food was significantly greater for the meal-before-exercise than the resting and the meal-after-exercise conditions 41).
  • The thermic effects of food and exercise were studied on groups of 10 normal weighted and 14 obese subjects using oxygen consumption as the criterion of energy expenditure. The results indicated that the increased resting metabolism resulting from the ingestion of a 4.200 kJ (1003 kCal) mixed content meal was similar in the two groups (12–17%). But the further potentiation of this thermic effect resulting from exercise following a meal was virtually absent in the obese group (0.8%), while in the normally weighted controls it amounted to a further 17% 42).

basal metabolic rate calculator

Thermic Effect of Food

The thermic effect of food (TEF), also called diet-induced thermogenesis, is the increment of energy expenditure above resting energy expenditure (REE) following meal ingestion and is a relatively stable component (see figure 1). The thermic effect of food lies in a range of 8-15% of your total energy expenditure (TEE) and is related to food digestion, absorption and storage. The variance of thermic effect of food has been associated with nutrient composition and energy content of consumed foods 43).

Your BMR rises after you eat because you use energy to eat, digest and metabolise the food you have just eaten. The rise occurs soon after you start eating, and peaks two to three hours later. This rise in the BMR can range between two per cent and 30 per cent, depending on the size of the meal and the types of foods eaten. However in a small study on the effect of meal frequency on the thermic effect of food in women who were fed either high carbohydrate-low fat meal and low carbohydrate-high fat meal, showed meal frequency and meal composition did not seem to influence the thermic effect of food 44). And in an another study on meal or feeding frequency and human energy metabolism 45). Wilhelmine and colleagues found no significant effect of meal frequency to the contribution of average daily metabolic expenditure (TEE) could be demonstrated 46).

Theoretically, based on the amount of ATP (adenosine triphosphate is the energy currency of life or a source of energy found in every cell, ATP main role is to store and supply the cell with needed energy for physiological reactions) required for the initial steps of metabolism and storage, the thermic effect of food (TEF) is different for each nutrient 47). Reported thermic effect of food values for separate nutrients 48)49) are:

  • Fat ~ 0 to 3%
  • Carbohydrate ~ 5 to 10%
  • Protein 20 to 30%
  • Alcohol ~ 10 to 30%.

The thermic effect of food reported by Jéquier 50):

  • Protein 25–30%,
  • Carbohydrate 6–8%, and
  • Fat2–3%.

However, Halton and Hu 51) reported greater variability, with the thermic effect of:

  • Protein being 20–35%,
  • Carbohydrate at 5–15%, and
  • Fat being subject to debate since some investigators found a lower thermic effect than carbohydrate while others found no difference.

The main effect of protein on energy balance is thought to be thermic effect of food (TEF) related satiety. Satiety scores were higher during meals with a high-protein/high-carbohydrate diet, as well as over 24 h, than with a high-fat diet 52). The observed thermic effect of food related satiety might be ascribed to the high protein rather than the high carbohydrate content of the diet. Postprandial thermogenesis was increased 100% on a high-protein/low-fat diet versus a high-carbohydrate/low-fat diet in healthy subjects 53). The thermic effect of food increases body temperature, which may be translated into satiety feelings. High-protein diets are favored for weight maintenance, also after weight loss, by favoring maintenance or regain of fat-free mass, by reducing the energy efficiency through a higher thermogenesis, and by reducing intake through an increased satiety 54).

Variability in the thermic effect of fat can be attributed to differences in molecular structure that significantly alter its metabolism. For example, Seaton et al. 55) found that medium chain triglycerides (MCTs) produced a significantly greater thermic effect than long chain triglycerides during a 6-hour postprandial period (12 vs. 4% higher than basal oxygen consumption). Differences in the thermic effect of food of protein have also been observed in direct comparisons. Acheson et al. 56) demonstrated that within mixed-macronutrient meals (50% protein, 40% carb, 10% fat) meals, whey had a higher thermic effect than casein, which had a higher thermic effect than soy protein. All protein sources had a higher thermic effect than an all-carbohydrate meal. Importantly, the thermic effect of each macronutrient can vary within and across individuals 57). In any case, protein has consistently shown a higher thermic effect than carbohydrate or fat. Alcohol has been reported to have a similar thermic effect to protein but with a wider range of 10–30% 58).

A study on effect of meal composition and energy content on the thermic effect of food with sixteen adult, non-obese female subjects, who were given either high-carbohydrate-low-fat and low-carbohydrate-high-fat, the energy contents of the test meals for each composition were 2520 kJ (600 kcal) and 5040 kJ (1200 kcal). The study found that thermic effect of food is significantly influenced by the energy content of a meal but not by meal composition 59).

In a study to find out if weight loss has any effect on the thermic effect of food 60). The thermic effects of food (TEF) were measured before and after weight reduction in moderately overweight adult women. Nine women weighing between 62.1 and 84.7 kg lost an average of 7.3 kg while on a reduced calorie, low fat diet for between 12 and 14 weeks. After weight reduction, the average resting energy expenditure of these subjects decreased by 8.8% or 515 kJ (123 kcal)/day. The researchers found no change in the thermic effects of food after weight reduction 61).

Different foods raise BMR by differing amounts. For example:

  • fats raise the BMR 0–5 per cent
  • carbohydrates raise the BMR 5–10 per cent
  • proteins raise the BMR 20–30 per cent
  • hot spicy foods, for example, foods containing chilli, horseradish and mustard can have a significant thermic effect.

Believe us, there are lots of companies out there trying to find something that will help your metabolic rates. For example, caffeine has been shown to very slightly increase metabolism, but it doesn’t appear to have a significant effect on long-term weight loss. Likewise, supplements claiming to boost your metabolism may have little or no benefit and may contain substances that can have serious health effects or may be banned.

How much you weigh you lose really depends on the number of calories you eat and how much physical activity you get. Your energy IN and energy OUT don’t have to balance exactly every day. Most of the energy you expend each day is used to keep all the systems in your body functioning properly. This is out of your control. However, you can make metabolism work for you when you exercise.It’s the balance over time that will help you maintain a healthy weight in the long run. For many people, this balance means  eating fewer calories and increasing their physical activity.

Boosting metabolism is the holy grail of weight watchers everywhere, but how fast your body burns calories depends on several things. Some people inherit a speedy metabolism. Men tend to burn more calories than women, even while resting. Your metabolism changes as you get older and for most people, metabolism slows steadily after age 40. You burn fewer calories and break down foods differently. You also lose lean muscle. Unless you exercise more and adjust your diet, the pounds can add up. Cutting back on calories is a matter of choice and middle-age spread can quickly become middle-age sprawl. Making healthy food choices that are lower in fats, especially saturated and
trans fats, as well as cholesterol, sodium (salt), and added sugar, can help you cut back on calories, as can paying attention to portion size. Although you can’t control your age, gender, or genetics, there are other ways to improve your metabolism.

basal metabolic rate with age and sex


These can help you manage your weight and may improve your metabolism. To lose weight, focus on the factors you have control over.

  • Whole-food vs Processed-food meals on Thermic Effect of Foods. The degree of processing or refinement of foods can influence their thermic effect. Barr and Wright 62) found a diet-induced thermogenesis of 137 kcal for a ‘whole food’ meal, and 73 kcal for the processed food meal. The ‘whole food’ meal had 5% more protein, and 2.5 g more fiber, but these factors are too small to account for the substantial difference in postprandial energy expenditure. The authors speculated that the greater mechanized preparation of the processed food caused less peristalsis and a greater loss of bioactive compounds, resulting in fewer metabolites, thus requiring less enzyme activity. This would lead to more energetically efficient absorption and metabolism. It is important to note that this was not a comparison of a highly processed food versus a whole food. Both of the meals in the comparison were cheese sandwiches. One just happened to have less mechanical refinement, and slightly more fiber and protein. The results of this study imply that processed foods are more fattening or less effective for weight management. However, the contrary has been demonstrated. Meal replacement products (powders, shakes, and bars) have matched or outperformed the effectiveness of whole food-based diets for weight loss and weight loss maintenance 63), 64), 65).
  • Calories. To lose weight, reduce the number of calories in your diet. And keep in mind that as you age, you may need even fewer calories. This is because the amount of muscle tends to decrease as you get older, leading to an overall increase in fat. Fat tissue burns fewer calories than does muscle.
  • Build Muscle Mass. The most efficient way to raise your metabolism is to increase and maintain muscle, which can most effectively be accomplished through correct muscular (resistance) training. Lifting weights raises your metabolism long after you’re finished—experts estimate that your metabolism stays elevated for up to 39 hours! Again, this is because lifting strains your body so much, that it needs extra time to recover. The more active your muscles are and the more you “break them down” during muscular training, the more energy your body needs for metabolism and repair; and most of that low intensity energy is from fat.
  • Compared to women, men’s bodies generally have more muscle and less fat which makes a difference to your BMR. While fat burns very few kilojoules, muscle is an active, ‘hungry’ tissue that uses up kilojoules even when you’re just sitting around. Your body constantly burns calories, even when you’re doing nothing. Muscle tissue is the most metabolically active tissue in your body, and the breakdown of old protein and synthesis of new protein in your muscles accounts for roughly one-fifth of your resting metabolic rate. This resting metabolic rate is much higher in people with more muscle. Every pound of muscle uses about 6 calories a day just to sustain itself, while each pound of fat burns only 2 calories daily. That small difference can add up over time. As a result, gaining muscle tissue helps you pack more metabolically active lean mass onto your frame, which will increase your calorie burn, even when you’re resting. To do that, you’ll need to get active with strength training. Include two or three strength training workouts that work every major muscle group in your body. As a bonus, strength training helps prevent or offset muscle loss as you age, so you’ll keep you basal metabolism higher for longer. After a session of strength training, muscles are activated all over your body, raising your average daily metabolic rate.


  • Exercise. During exercise, contracting skeletal muscles release the hormone irisin into circulation. Irisin can induce energy-storing white fat cells to take on characteristics of brown fat (or adipose) cells, which burn energy by generating heat. This muscle-fat crosstalk has intrigued scientists because it’s unclear why muscle tissue, which generates heat when active, would also stimulate fat cells to produce heat. A popular idea is that a major benefit of physical activity comes not only from the actual energy that is expended during the exercise itself but also from an after-effect of physical activity on resting energy expenditure 66). There are data showing a positive effect of vigorous or moderate physical activity on resting energy expenditure. This follows 2 separate phases: a large effect that lasts ∼ 2 h and a smaller but more prolonged effect that could take up to 48 h to return to baseline 67). This is called excess post-exercise oxygen consumption and accounts for ∼ 6–15% of the energy expended during an exercise session 68). These findings from non-obese male subjects suggest that individuals with a high VO2 max (such as aerobically trained athletes) show a greater the thermic effect of food (TEF) after eating, particularly after a large meal, than do individuals with a low VO2 max 69). In another study involving 10 healthy women who were given a 10 week graded exercise program of jogging. Pretraining thermic effect of food (TEF) was a linear function of VO2max. Following exercise training, the women showed a significant increase (20%) in VO2max and loss (10.4%) of body fat; body weight did not change. Fat loss was directly related to changes in VO2max and resting energy expenditure 70).


  • Do High High Intensity Interval Training. Aerobic exercise may not build big muscles, but it can rev up your metabolism in the hours after a workout. The key is to push yourself and step up your workout. High High Intensity Interval Training (HIIT) delivers a bigger, longer rise in resting metabolic rate than low- or moderate-intensity workouts. High High Intensity Interval Training raises your metabolism for hours afterward.(Source 71)).
    HIIT is performed by alternating highly intense bursts of exercise for 30 seconds to a minute (“highly intense” – not less than 85% of your maximum heart rate) with slow recovery for one to two minutes.Without getting too technical, HIIT spikes your metabolism after your finished (while you’re at rest) because your body is so strained, it needs extra time to recoverThink of it this way: gunning your car for 30 seconds, then braking down to 10 MPH, then gunning and braking again uses much more gas than driving at a steady pace. The same is true for your body, except in this case, the more fuel (body fat) you use, the better!An example of HIIT on a treadmill is running on 9.0 for 30 seconds, then walking on 3.0 for one minute. Repeat this 10 times and you’re looking at 28 minutes total (even including a 5 minute warm up and 5 minute cool down). Try to work your way up to 1 minute high intensity/1 minute low intensity.
  • To get the benefits, try a more intense class at the gym or include short bursts of jogging during your regular walk.


  • Drink Lots of Water. Your body needs water to process calories. Water is paramount to developing a lean, healthy physique. Not only is it a vehicle for flushing fat from your system, but it’s also crucial for your bodies messaging system to fire correctly. And drinking water can actually raise your metabolism. If you are even mildly dehydrated, your metabolism may slow down. In one study, adults who drank eight or more glasses of water a day burned more calories than those who drank four. To stay hydrated, drink a glass of water or other unsweetened beverage before every meal and snack. Also, snack on fresh fruits and vegetables, which naturally contain water, rather than pretzels or chips.
  • Being dehydrated can cause cravings, and tricks your mind into thinking you’re hungry, rather than thirsty. Staying hydrated keeps your body balanced, and helps you become more in tune with your internal senses of need.But how does drinking water raise your metabolism ? A German study tested drinking water and energy expenditures on healthy subjects who weren’t overweight. The researchers found that after drinking about “17 ounces of water, the subjects’ metabolic rates—or the rate at which calories are burned—increased by 30% for both men and women. The increases occurred within 10 minutes of water consumption and reached a maximum after about 30 or 40 minutes.”Over a year, drinking an extra 1.5 liters a day burns around 17,400 calories, which adds up to about five pounds. While five pounds a year may sound like only a little amount, this adds up to 25 pounds in five years, or 50 pounds in 10 years!


  • Spice Up Your Meals. Spicy foods have natural chemicals that can kick your metabolism into a higher gear. Cooking foods with a tablespoon of chopped red or green chili pepper can boost your metabolic rate. The effect is probably temporary, but if you eat spicy foods often, the benefits may add up. For a quick boost, spice up pasta dishes, chili, and stews with red pepper flakes.


  • Include More Protein in Your Diet.You know that protein fills you up, but did you know that protein has a greater thermogenic effect than the other macronutrients ? The thermogenic effect of food is a measure of energy that your body needs to digest food.Protein is harder for your body to digest and thus takes more energy than does fat or carbs. The thermogenic effect of food of protein is 25%, meaning 25% of the calories of each gram of protein is burned off through digestion, whereas the thermogenic effect of food of carbohydrates is 5%, and is only 2% for fats.Your body burns many more calories digesting protein than it does eating fat or carbohydrates. As part of a balanced diet, replacing some carbs with lean, protein-rich foods can boost metabolism at mealtime. Good sources of protein include lean beef, turkey, fish, white meat chicken, tofu, nuts, beans, eggs, and low-fat dairy products.


  • Green Tea. Drinking green tea or oolong tea offers the combined benefits of caffeine and catechins, substances shown to rev up the metabolism for a couple of hours. Although many studies have been done on green tea and its extracts, definite conclusions cannot yet be reached on whether green tea is helpful for most of the purposes for which it is used including its use for weight loss. There are just not enough reliable data to determine whether green tea can aid in weight loss.


  • Avoid Crash Diets. Crash diets involve eating fewer than 1,200 (if you’re a woman) or 1,800 (if you’re a man) calories a day — are bad for anyone hoping to quicken their metabolism. Although these diets may help you drop pounds quickly, that comes at the expense of good nutrition. Plus, it backfires, since you can lose muscle, which in turn slows your metabolism. The final result is your body burns fewer calories and gains weight faster than before the diet.


  • Cool Temperature. Humans have several types of fat. White fat stores extra energy. Too much white fat, a characteristic of obesity, increases the risk of type 2 diabetes and other diseases. Brown fat, in contrast, burns chemical energy to create heat and help maintain body temperature. Researchers have previously shown that, in response to cold, white fat cells in both animals and humans take on characteristics of brown fat cells.The increase in brown fat following a month of cold exposure was accompanied by improved insulin sensitivity after a meal during which volunteers were exposed to mild cold. Prolonged exposure to mild cold also resulted in significant changes in metabolic hormones such as leptin and adiponectin. There were no changes in body composition or calorie intake.The findings suggest that humans may acclimate to cool temperature by increasing brown fat, which in turn may lead to improvements in glucose metabolism. These changes can be dampened or reversed following exposure to warmer temperatures.

Summary

You are not a victim to a slow metabolism. Use these simple recommendation (regular exercise, lift weights, HIIT, drink water, eat more protein and avoid fad diets) will boost your metabolism to a higher level naturally — you can burn fat and reach your fitness goals sooner and as a result, a fitter, slimmer body.

References   [ + ]

read more

Can Drinking Green Tea Make You Lose Weight ?

Green tea

What is Green Tea

Tea is one of the most ancient and popular beverages consumed around the world. Green tea is the most popular tea in Japan and China. Whilst Black tea accounts for about 75 percent of the world’s tea consumption 1). In the United States, United Kingdom (UK), and Europe, black tea is the most common tea beverage consumed. Oolong and white tea are consumed in much lesser amounts around the world.

Green tea is made from the leaf of the plant Camellia sinensis, shortly after harvesting, tea leaves begin to wilt and oxidize. During oxidation, chemicals in the leaves are broken down by enzymes, resulting in darkening of the leaves and the well-recognized aroma of tea. This oxidation process can be stopped by heating, which inactivates the enzymes. The amount of oxidation and other aspects of processing determine a tea’s type.

Green tea is made from unwilted leaves that are not oxidized.

Black tea is produced when tea leaves are wilted, bruised, rolled, and fully oxidized.

Oolong tea is made from wilted, bruised, and partially oxidized leaves, creating an intermediate kind of tea.

White tea is made from young leaves or growth buds that have undergone minimal oxidation. Dry heat or steam can be used to stop the oxidation process, and then the leaves are dried to prepare them for sale.

Tea is brewed from dried leaves and buds (either in tea bags or loose), prepared from dry instant tea mixes, or sold as ready-to-drink iced teas. So-called herbal teas are not really teas but infusions of boiled water with dried fruits, herbs, and/or flowers.

  • Green, black and oolong teas all come from the same plant, Camellia sinensis, but are prepared using different methods. To produce green tea, fresh leaves from the plant are lightly steamed and crushed.
  • Tea has been used for medicinal purposes in China and Japan for thousands of years.
  • Current uses of green tea as a beverage or dietary supplement include improving mental alertness, relieving digestive symptoms and headaches, and promoting weight loss.
  • Green tea and its extracts, such as one of its components, EGCG (pigallocatechin gallate), have been studied for their possible protective effects against heart disease and cancer.
  • Green tea is consumed as a beverage. It is also sold in liquid extracts, capsules, and tablets and is sometimes used in topical products (intended to be applied to the skin).
  • White Tea is the least processed, and it has a light, sweet flavor. One laboratory study showed white tea sped up the breakdown of existing fat cells and blocked the formation of new ones. Whether it has the same effects in the human body remains to be seen.
  • Black Tea is the type of tea that’s often served in Chinese restaurants and used to make iced tea. Black tea is produced when tea leaves are wilted, bruised, rolled, and fully oxidized– a process that allows it to change chemically and often increases its caffeine content. The tea has a strong, rich flavor. Whether it helps with weight loss isn’t certain. But research done on rats suggests substances called polyphenols in black tea might help block fat from being absorbed in the intestines.
  • Oolong Tea is made by drying tea leaves in the hot sun. Like green tea, it’s a rich source of catechins. In one study, more than two-thirds of overweight people who drank oolong tea every day for six weeks lost more than 2 pounds and trimmed belly fat.
  • Except for decaffeinated green tea products, green tea and green tea extracts contain substantial amounts of caffeine.

All teas naturally have high amounts of health-promoting substances called flavonoids. So they’re thought to bring down inflammation and protect against conditions like heart disease and diabetes.

Teas have a type of flavonoid called catechins (epigallocatechin gallate) that may boost metabolism and help your body break down fats more quickly.

Green tea

What are the ingredients of tea ?

Tea is composed of polyphenols, alkaloids (caffeine, theophylline, and theobromine), amino acids, carbohydrates, proteins, chlorophyll, volatile organic compounds (chemicals that readily produce vapors and contribute to the odor of tea), fluoride, aluminum, minerals, and trace elements. The polyphenols, a large group of plant chemicals that includes the catechins, are thought to be responsible for the health benefits that have traditionally been attributed to tea, especially green tea. The most active and abundant catechin in green tea is epigallocatechin-3-gallate (EGCG). The active catechins and their respective concentrations in green tea infusions are listed in the table below. These chemical compounds act as antioxidants, which fight against free radicals in the body. Free radicals can alter DNA by stealing its electrons, and this mutated DNA can increase LDL “bad” cholesterol or alter cell membrane traffic – both harmful to our health. Though green tea is often considered higher in polyphenols than black or oolong (red) teas, studies show that – with the exception of decaffeinated tea – all teas have about the same levels of these chemicals, albeit in different proportions.

While the antioxidant action of tea is promising, some research suggests that the protein and possibly the fat in milk may reduce the antioxidant capacity of tea 2). Flavonoids, the antioxidant component in tea, are known to bind to proteins and “de-activate,” so this theory makes scientific sense 3). One study that analyzed the effects of adding skimmed, semi-skimmed, and whole milk to tea concluded that skimmed milk significantly reduced the antioxidant capacity of tea. The fattier milks also reduced the antioxidant capacity of tea, but to a lesser degree 4). Overall, it’s important to keep in mind that tea – even tea with milk – is a healthy drink. To reap the full antioxidant benefits of tea, however, it may be best to skip the milk.

Avoid purchasing expensive bottled teas or teas in coffee shops that contain added sugar or sweeteners. To enjoy the maximum benefits of drinking tea, consider brewing your own at home. You can serve it hot, or make a pitcher of home-brewed iced tea during warmer months.

Table 1. Catechin Concentrations of Green Tea Infusions

Catechin in Green Tea InfusionCatechin Concentration (mg/L)*Catechin Concentration (mg/8 fl oz)*
Epigallocatechin-3-gallate (EGCG)117–44225–106
Epigallocatechin (EGC)203–47149–113
Epicatechin-3-gallate (ECG)17–1504–36
Epicatechin (EC)25–816–19

*mg = milligram; L = liter; fl oz = fluid ounce.

[Source 5)]

Black tea contains much lower concentrations of these catechins than green tea 6). The extended oxidation of black tea increases the concentrations of thearubigins and theaflavins, two types of complex polyphenols. Oolong tea contains a mixture of simple polyphenols, such as catechins, and complex polyphenols 7). White and green tea contain similar amounts of EGCG but different amounts of other polyphenols 8).

Although iced and ready-to-drink teas are becoming popular worldwide, they may not have the same polyphenol content as an equal volume of brewed tea 9). The polyphenol concentration of any particular tea beverage depends on the type of tea, the amount used, the brew time, and the temperature 10). The highest polyphenol concentration is found in brewed hot tea, less in instant preparations, and lower amounts in iced and ready-to-drink teas 11). As the percentage of tea solids (i.e., dried tea leaves and buds) decreases, so does the polyphenol content 12). Ready-to-drink teas frequently have lower levels of tea solids and lower polyphenol contents because their base ingredient may not be brewed tea 13). The addition of other liquids, such as juice, will further dilute the tea solids 14). Decaffeination reduces the catechin content of teas 15).

Dietary supplements containing green tea extracts are also available 16). In a U.S. study that evaluated 19 different green tea supplements for tea catechin and caffeine content, the product labels varied in their presentation of catechin and caffeine information, and some values reported on product labels were inconsistent with analyzed values 17).

Green Tea and Weight Loss

Although many studies have been done on green tea and its extracts, definite conclusions cannot yet be reached on whether green tea is helpful for most of the purposes for which it is used including its use for weight loss. There are just not enough reliable data to determine whether green tea can aid in weight loss 18). Be wary of weight-loss claims. Some advertisements claim that tea can speed weight loss, but research on the effects of green tea and fat reduction have shown little promise of weight loss benefits. Moreover, it’s best to skip any so-called “diet” teas that may contain potentially harmful substances such as laxatives.

In a well-conducted 2012 Cochrane Review 19) the study authors looked at 15 weight loss studies and three studies measuring weight maintenance where some form of a green tea preparation was given to one group and results compared to a group receiving a control. Neither group knew whether they were receiving the green tea preparation or the control. Green tea preparations used for losing weight are extracts of green tea that contain a higher concentration of catechins and caffeine than the typical green tea beverage prepared from a tea bag and boiling water. A total of 1945 participants completed the studies, ranging in length from 12 to 13 weeks. In summary, the loss in weight in adults who had taken a green tea preparation was statistically not significant, was very small and is not likely to be clinically important. Similar results were found in studies that used other ways to measure loss in weight (body mass index, waist circumference). Studies examining the effect of green tea preparations on weight maintenance did not show any benefit compared to the use of a control preparation.

Green tea preparations appear to induce a small, statistically non-significant weight loss in overweight or obese adults. Because the amount of weight loss is small, it is not likely to be clinically important. Green tea had no significant effect on the maintenance of weight loss. Of those studies recording information on adverse events, only two identified an adverse event requiring hospitalisation. The remaining adverse events were judged to be mild to moderate.

Most adverse effects, such as nausea, constipation, abdominal discomfort and increased blood pressure, were judged to be mild to moderate and to be unrelated to the green tea or control intervention. No deaths were reported, although adverse events required hospitalisation. One study attempted to look at health-related quality of life by asking participants about their attitudes towards eating. Nine studies tracked participants’ compliance with green tea preparations. Studies did not include any information about the effects of green tea preparations on morbidity, costs or patient satisfaction.

In another study conducted in 2008, randomised blinded controlled trials that compared catechins (in green tea or capsules) – a epigallocatechin gallate + caffeine mixture, showed a small positive effect on weight loss and weight maintenance. However, the authors stated that further research was needed to assess whether (and to what extent) people are genetically predisposed to the effect of epigallocatechin gallate-caffeine mixtures. And due to the limitations in the review methodology mean that the overall effect size estimate was unlikely to be reliable and the conclusions should be treated with caution.

To get the same amount of EGCG used in the research, you’d need to drink about six to seven cups of your typical green tea every day. You could also try a green tea extract, but it might be risky. Though rare, high-dose tea extracts found in some weight-loss supplements have been linked to serious liver damage.

Green Tea and Cancer Prevention

Among their many biological activities, the predominant polyphenols in green tea―Epigallocatechin-3-gallate (EGCG), Epigallocatechin (EGC), Epicatechin-3-gallate (ECG) and Epicatechin (EC) and the theaflavins and thearubigins in black teas have antioxidant activity 20). These chemicals, especially Epigallocatechin-3-gallate (EGCG) and Epicatechin-3-gallate (ECG), have substantial free radical scavenging activity and may protect cells from DNA damage caused by reactive oxygen species 21).

Tea polyphenols have also been shown to inhibit tumor cell proliferation and induce apoptosis in laboratory and animal studies 22), 23). Research shows benefits for a variety of types of cancer, including ovarian cancer 24) and digestive system cancers 25). Green tea might also have a positive effect in reducing risk of breast, prostate, and endometrial cancers, though more evidence is needed 26). In other laboratory and animal studies, tea catechins have been shown to inhibit angiogenesis and tumor cell invasiveness 27). In addition, tea polyphenols may protect against damage caused by ultraviolet (UV) B radiation 28), 29), and they may modulate immune system function 30). Furthermore, green teas have been shown to activate detoxification enzymes, such as glutathione S-transferase and quinone reductase, that may help protect against tumor development 31). Although many of the potential beneficial effects of tea have been attributed to the strong antioxidant activity of tea polyphenols, the precise mechanism by which tea might help prevent cancer has not been established 32).

Although tea and/or tea polyphenols have been found in animal studies to inhibit tumorigenesis at different organ sites, including the skin, lung, oral cavity, esophagus, stomach, small intestine, colon, liver, pancreas, and mammary gland 33), the results of human studies—both epidemiologic and clinical studies—have been inconclusive. There is insufficient and conflicting evidence to give any firm recommendations regarding green tea consumption for cancer prevention.

The results of this 2009 Cochrane review 34), where fifty-one studies with more than 1.6 million participants, mainly of observational nature were included in this systematic review. Studies looked for an association between green tea consumption and cancer of the digestive tract, gynecological cancer including breast cancer, urological cancer including prostate cancer, lung cancer and cancer of the oral cavity. The majority of included studies were of medium to high methodological quality. The evidence that the consumption of green tea might reduce the risk of cancer was conflicting. Although many of the potential beneficial effects of tea have been attributed to the strong antioxidant activity of tea polyphenols, the precise mechanism by which tea might help prevent cancer has not been established 35). This means, that drinking green tea remains unproven in cancer prevention, but appears to be safe at moderate, regular and habitual use.

A more recent 2015 study 36) looked at the cancer-fighting effects of a compound found in green tea when combined with a drug called Herceptin, which is used in the treatment of stomach and breast cancer. Initial results in the laboratory were promising and human trials are now being planned. But this shouldn’t be taken as official advice that drinking green tea while taking Herceptin will make it more effective. This research remains at a very early stage of development. The results from the laboratory and mice studies need to be confirmed by other research groups before the team can consider testing potential treatments in humans.

Green and black tea and the prevention of cardiovascular disease

There are very few long-term studies to date examining green or black tea for the primary prevention of cardiovascular disease. Polyphenols, the antioxidants abundant in tea, have been shown to reduce the risk of death due to cardiovascular disease 37), including stroke 38). In one study of 77,000 Japanese men and women, green tea and oolong tea consumption which was assessed by questionnaires was linked with lower risk of death from cardiovascular disease 39). Other large-scale studies show that black tea also contributes to heart health, with research suggesting that drinking at least three cups of either black or green tea per day appears to reduce the risk of stroke by 21 percent. The study also stated that drinking tea may be one of the most significant changes a person can make to reduce his or her risk of stroke 40). A randomized clinical trial would be necessary to confirm the effect. In a study of green and oolong tea consumption, regular consumption for one year reduced the risk of developing hypertension 41). Long-term regular consumption of black tea has also been shown to lower blood pressure 42). The limited evidence suggests that tea has favourable effects on cardiovascular disease risk factors, but due to the small number of trials contributing to each analysis the results should be treated with some caution and further high quality trials with longer-term follow-up are needed to confirm this 43).

Does green tea cut cholesterol?

A good-quality review from 2013 44) of 11 studies involving 821 people found daily consumption of green and black tea (as a drink or a capsule) could help lower cholesterol and blood pressure thanks to tea and its catechins. The authors of the review caution that most of the trials were short term and more good quality long-term trials are needed to back up their findings.

Another good-quality review from 2011 45) found drinking green tea enriched with catechins led to a small reduction in cholesterol, a main cause of heart disease and stroke. However, it’s still not clear from the evidence how much green tea you’d need to drink to see a positive effect on your health, or what the long-term effects of drinking green tea are on your overall health.

Can green tea help prevent or delay Alzheimer’s disease?

Evidence of a positive link between drinking green tea and Alzheimer’s disease is weak. A 2010 laboratory study 46) using animal cells found a green tea preparation rich in antioxidants protected against the nerve cell death associated with dementia and Alzheimer’s disease.

Whether these lab results can be reproduced in human trials remains to be seen. As such, the findings do not conclusively show green tea combats Alzheimer’s disease.

Can green tea prevent tooth decay?

A small study from 2014 47) looked at how effective a green tea mouthwash was in preventing tooth decay compared with the more commonly used antibacterial mouthwash chlorhexidine. The results suggested they were equally effective, though green tea mouthwash has the added practical advantage of being cheaper.

Are there safety considerations regarding tea consumption ?

Tea as a food item is generally recognized as safe by the U.S. Food and Drug Administration. Safety studies have looked at the consumption of up to 1200 mg of Epigallocatechin-3-gallate (EGCG) in supplement form in healthy adults over 1- to 4-week time periods 48), 49). The adverse effects reported in these studies included excess intestinal gas, nausea, heartburn, stomach ache, abdominal pain, dizziness, headache, and muscle pain 50), 51). In a Japanese study, children aged 6 to 16 years consumed a green tea beverage containing 576 mg catechins (experimental group) or 75 mg catechins (control group) for 24 weeks with no adverse effects 52). The safety of higher doses of catechins in children is not known.

As with other caffeinated beverages, such as coffee and colas, the caffeine contained in many tea products could potentially cause adverse effects, including tachycardia, palpitations, insomnia, restlessness, nervousness, tremors, headache, abdominal pain, nausea, vomiting, diarrhea, and diuresis 53). However, there is little evidence of health risks for adults consuming moderate amounts of caffeine (about 300 to 400 mg per day). A review by Health Canada concluded that moderate caffeine intakes of up to 400 mg per day (equivalent to 6 mg per kilogram [kg] body weight) were not associated with adverse effects in healthy adults. The amount of caffeine present in tea varies by the type of tea; the caffeine content is higher in black teas, ranging from 64 to 112 mg per 8 fl oz serving, followed by oolong tea, which contains about 29 to 53 mg per 8 fl oz serving. Green and white teas contain slightly less caffeine, ranging from 24 to 39 mg per 8 fl oz serving and 32 to 37 mg per 8 fl oz serving, respectively. Decaffeinated teas contain less than 12 mg caffeine per 8 fl oz serving. Research on the effects of caffeine in children is limited. In general, caffeine doses of less than 3.0 mg per kg body weight have not resulted in adverse effects in children. Higher doses have resulted in some behavioral effects, such as increased nervousness or anxiety and sleep disturbances 54).

Aluminum, a neurotoxic element, is found in varying quantities in tea plants. Studies have found concentrations of aluminum (which is naturally taken up from soil) in infusions of green and black teas that range from 14 to 27 micrograms per liter (μg/L) to 431 to 2239 μg/L 55). The variations in aluminum content may be due to different soil conditions, different harvesting periods, and water quality 56). Aluminum can accumulate in the body and cause osteomalacia and neurodegenerative disorders, especially in individuals with renal failure 57). However, it is not clear how much of the aluminum in tea is bioavailable, and there is no evidence of any aluminum toxicity associated with drinking tea 58).

Black and green tea may inhibit iron bioavailability from the diet 59). This effect may be important for individuals who suffer from iron-deficiency anemia 60). The authors of a systematic review of 35 studies on the effect of black tea drinking on iron status in the UK concluded that, although tea drinking limited the absorption of non-heme iron from the diet, there was insufficient evidence to conclude that this would have an effect on blood measures (i.e., hemoglobin and ferritin concentrations) of overall iron status in adults 61). However, among preschool children, statistically significant relationships were observed between tea drinking and poor iron status 62). The interaction between tea and iron can be mitigated by consuming, at the same meal, foods that enhance iron absorption, such as those that contain vitamin C (e.g., lemons), and animal foods that are sources of heme iron (e.g., red meat) 63). Consuming tea between meals appears to have a minimal effect on iron absorption 64).

Summary

Green tea extracts haven’t been shown to produce a meaningful weight loss in overweight or obese adults. They also haven’t been shown to help people maintain a weight loss.

Desirable green tea intake is 3 to 5 cups per day (up to 1200 ml/day), providing a minimum of 250 mg/day catechins. If not exceeding the daily recommended allowance, those who enjoy a cup of green tea should continue its consumption. Drinking green tea appears to be safe at moderate, regular and habitual use.

If you like a cup of tea with your morning toast or afternoon snack or on its own, enjoy it. It’s safe to drink as long as you don’t add sugar or artificial sweeteners and the caffeine doesn’t make you feel jittery and shaky; interfere with sleep; and cause headaches. And the limited evidence currently available suggests that both green and black tea might have beneficial effects on some heart disease risk factors, including blood pressure and cholesterol.

Just don’t expect miracles to come in a teacup toward your weight-loss goals. Real weight loss requires a whole lifestyle approach that includes diet changes and activity.

Liver problems have been reported in a small number of people who took concentrated green tea extracts. Although the evidence that the green tea products caused the liver problems is not conclusive, experts suggest that concentrated green tea extracts be taken with food and that people discontinue use and consult a health care provider if they have a liver disorder or develop symptoms of liver trouble, such as abdominal pain, dark urine, or jaundice.

Tea has long been regarded as an aid to good health, and many believe it can help reduce the risk of cancer. Most studies of tea and cancer prevention have focused on green tea 65). Although tea and/or tea polyphenols have been found in animal studies to inhibit tumorigenesis at different organ sites, including the skin, lung, oral cavity, esophagus, stomach, small intestine, colon, liver, pancreas, and mammary gland, the results of human studies—both epidemiologic and clinical studies—have been inconclusive. Therefore we have to say that at present, with respect to tea and green tea and cancer prevention, the evidence regarding the potential benefits of tea consumption in relation to cancer is inconclusive.

References   [ + ]

read more

Apple Cider Vinegar For Weight Loss

Apple Cider Vinegar weight loss

Apple Cider Vinegar

Apple Cider Vinegar and Weight Loss

Drinking apple cider vinegar isn’t likely to be effective for weight loss. Proponents of the apple cider vinegar diet claim that drinking a small amount of apple cider vinegar before meals or taking an apple cider vinegar supplement helps curb appetite and burn fat. However, there’s little scientific support for these claims.

Although occasional use of apple cider vinegar is safe for most people, it won’t likely lead to weight loss — and it may pose problems of its own. For example:

  • Apple cider vinegar is highly acidic. It may irritate your throat or affect your teeth enamel if you drink it often or in large amounts.
  • Apple cider vinegar may interact with certain supplements or drugs, including diuretics and insulin. This may contribute to low potassium levels.
  • Women with osteoporosis should be wary of apple cider vinegar. Used regularly, apple cider vinegar could reduce bone density.

Several studies have found that vinegar — including apple cider vinegar — may lower blood sugar levels. This could have benefits for people with diabetes. Some types of vinegar have also been shown to make people feel fuller. This could support the traditional use of apple cider vinegar for weight loss. People use apple cider vinegar for many other uses, including vaginitis, general detoxification, skin health, and high blood pressure, though there are no clinical trials examining these conditions to refute or support the traditional use.

Animal and laboratory studies have found evidence that apple cider vinegar might help lower cholesterol and blood pressure and slow the growth of some cancer cells. However, this research is only in its early stages. It’s too soon to say whether the same results will be seen in people.

Because apple cider vinegar is an unproven treatment, there are no official recommendations on how to use it. Some people take 2 teaspoons or more a day of apple cider vinegar mixed in a cup of water or juice. Tablets with 285 milligrams of dehydrated apple cider vinegar are also commonly sold. Taking apple cider vinegar at full strength could erode the enamel of the teeth and burn the mouth and throat. Throat injury from an apple cider vinegar tablet has also been reported. For someone with diabetes, apple cider vinegar may worsen digestive problems.

Conclusion

Remember, there’s no magic bullet for weight loss. The key to losing weight is burning more calories than you consume. Choose a variety of healthy foods — such as fruits, vegetables, whole grains and lean sources of protein — and include physical activity in your daily routine.

read more

Waist Hip Ratio

waist hip ratio

What is the Waist Hip Ratio Measurement

Although waist circumference and body mass index (BMI) are interrelated, waist circumference provides an independent prediction of risk over and above that of BMI. Waist circumference measurement is particularly useful in patients who are categorized as normal or overweight on the BMI scale. At BMIs greater than or equal to 35, waist circumference has little added predictive power of disease risk beyond that of BMI. It is therefore not necessary to measure waist circumference in individuals with BMIs greater than or equal to 35 1). Given that your Body Mass Index measurement can be misleading if you have different body types and shapes, scientists and researchers have invented a more accurate measurement of your body fat distribution by measuring your waist circumference (WC) and waist-hip ratio. For example, Body Mass Index (BMI) does not take into account your age, gender or muscle mass. Nor does it distinguish between lean body mass and fat mass. As a result, some people, such as heavily muscled athletes, may have a high body mass index even though they don’t have a high percentage of body fat. In others, such as elderly people, BMI may appear normal even though muscle has been lost with aging. Take for example, basketball player Michael Jordan: When MJ was in his prime, his BMI was 27-29, classifying him as overweight, yet his waist size was less than 30. That’s one reason some experts think waist circumference can be a better overall health measurement than BMI.

Another reason why waist-hip-ratio is important to your health is that your health is not only affected by excess body fat, but also by where the fat is located. Some people gain weight in their abdominal regions (the so-called ”apple” body shape.) Others are ”pear-shaped,” with excess weight around the hips and buttocks. The waist hip ratio has been used as an indicator or measure of health and the risk of developing serious health conditions. Research shows that people with “apple-shaped” bodies (with more weight around the waist) face more health risks associated with being overweight than those with “pear-shaped” bodies who carry more weight around the hips.

waist hip ratio

The Waist-Hip Ratio has been shown to be a better predictor of mortality and morbidity after certain surgery than body mass index (BMI) or body surface area. According to Mayo Clinic research in 2012, people who are of normal weight but have fat concentrated in their bellies have a higher death risk than those who are obese. The researchers found those who had a normal body mass index but central obesity — a high waist-to-hip ratio — had the highest cardiovascular death risk and the highest death risk from all causes. Other researchers have found that waist, waist-to-hip ratio, and BMI are similarly strong predictors of type 2 diabetes 2), 3).

A high waist circumference is associated with an increased risk for type 2 diabetes, dyslipidemia, hypertension, and coronary heart disease in patients with a BMI in a range between 25 and 34.9 kg/m2 4). Monitoring changes in waist circumference over time may be helpful, in addition to measuring BMI, since it can provide an estimate of increased abdominal fat even in the absence of a change in BMI. Furthermore, in obese patients with metabolic complications, changes in waist circumference are useful predictors of changes in CVD risk factors 5).

There are ethnic and age-related differences in body fat distribution that modify the predictive validity of waist circumference as a surrogate for abdominal fat 6). These variations may partly explain differences between ethnic or age groups in the power of waist circumference or waist-to-hip (WHR) ratio to predict disease risks 7), 8).

In some populations, waist circumference is a better indicator of relative disease risk than is BMI: examples include Asian Americans or persons of Asian descent living elsewhere 9), 10), 11). Waist circumference also assumes greater value for estimating risk for obesity-related disease at older ages. The table below incorporates both BMI and waist circumference in the classification of overweight and obesity, and provides an indication of disease risk.

Table 1: Classification of Overweight and Obesity by BMI, Waist Circumference, and Associated Disease Risk* 

Disease Risk* Relative to Normal
Weight and Waist Circumference

BMI (kg/m2)
Obesity Class
Men <102 cm
(40 in.)
Women <88 cm
( 35 in.) 

Men >102 cm
( >40 in.)
Women >88 cm
( >35 in.) 

Underweight
18.5
—–
—–
Normal+
18.5 – 24.9
—–
—–
Overweight
25.0 – 29.9
Increased
High
Obesity
30.0 – 34.9
I
High
Very High
35.0 – 39.9
II
Very High
Very High
Extreme Obesity
> 40
III
Extremely High
Extremely High

* Disease risk for type 2 diabetes, hypertension, and CVD.
+Increased waist circumference can also be a marker for increased risk even in persons of normal weight.

Central obesity is bad and people in this group (a high waist-to-hip ratio) has the highest death rate, even higher than those who are considered obese based on body mass index. From a public health perspective, this is a significant finding. Long-term follow-up studies showed that so-called “abdominal obesity” was strongly associated with an increased risk of type 2 diabetes, cardiovascular disease and death, even after controlling for body mass index (BMI) 12), 13).

The risk of cardiovascular death was 2.75 times higher, and the risk of death from all causes was 2.08 times higher than in people of normal weight with central obesity, compared with those with a normal body mass index and waist-to-hip ratio. The high risk of death may be related to a higher visceral fat accumulation (fat stored around important internal organs such as the liver, pancreas and intestines) in this group, which is associated with insulin resistance and other risk factors.

Waist Hip Ratio is used as a measurement of obesity, abdominal fat is a marker of visceral fat causing the high waist hip ratio, which in turn is a possible indicator of other more serious health conditions. The World Health Organization states that abdominal obesity is defined as a waist–hip ratio above 0.90 for males and above 0.85 for females, or a body mass index (BMI) above 30. The National Institute of Diabetes, Digestive and Kidney Diseases states that women with waist–hip ratios of more than 0.8, and men with more than 1.0, are at increased health risk because of their fat distribution.

Waist Hip Ratio is the ratio of the circumference of your waist to that of your hips. This is calculated as waist measurement divided by hip measurement (Waist ÷ Hips). For example, a person with a 25″ (64 cm) waist and 38″ (97 cm) hips has a waist–hip ratio of about 0.66.

If obesity is redefined using waist hip ratio instead of BMI, the proportion of people categorized as at risk of heart attack worldwide increases threefold. The body fat percentage is considered to be an even more accurate measure of relative weight. Of these three measurements, only the waist–hip ratio takes account of the differences in body structure. Hence, it is possible for two women to have vastly different body mass indices but the same waist–hip ratio, or to have the same body mass index but vastly different waist–hip ratios.

Waist hip ratio has been shown to be a better predictor of cardiovascular disease than waist circumference and body-mass index (BMI). However, other studies have found waist circumference, not waist hip ratio, to be a good indicator of cardiovascular risk factors, body fat distribution, and hypertension in type 2 diabetes.

Figure 1. How To Measure Waist Hip Ratio

Figure 2. Waist Hip Ratio Chart


Abdominal obesity results in an “apple-shaped” body type, which is more common among men. Women typically accumulate fat around the hips and thighs to develop a “pear shaped” body type (although they can certainly develop “apple-shaped” body types as well).

  • The two most common ways to measure abdominal obesity are waist circumference and waist size compared to hip size, also known as the waist-to-hip ratio. Several organizations have defined cut-points for abdominal obesity around one or both of these measurements, with different cut-points for men and women (see Figure 1 and 2).

In people who are not overweight, having a large waist may mean that they are at higher risk of health problems than someone with a trim waist.

  • The Nurses’ Health Study, one of the largest and longest studies to date that has measured abdominal obesity, looked at the relationship between waist size and death from heart disease, cancer, or any cause in middle-aged women 14). At the start of the study, all 44,000 study volunteers were healthy, and all of them measured their waist size and hip size.
  • After 16 years, women who had reported the highest waist sizes — 35 inches or higher –had nearly double the risk of dying from heart disease, compared to women who had reported the lowest waist sizes (less than 28 inches) 15).
  • Women in the group with the largest waists had a similarly high risk of death from cancer or any cause, compared with women with the smallest waists. The risks increased steadily with every added inch around the waist 16).

The study found that even women at a “normal weight” BMI less than 25 were at a higher risk, if they were carrying more of that weight around their waist:

  • Normal-weight women with a waist of 35 inches or higher had three times the risk of death from heart disease, compared to normal-weight women whose waists were smaller than 35 inches 17).

The Shanghai Women’s Health study found a similar relationship between abdominal fatness and risk of death from any cause in normal-weight women 18).

What is it about abdominal fat that makes it strong marker of disease risk ?

The fat surrounding the liver and other abdominal organs, so-called visceral fat, is very metabolically active. It releases fatty acids, inflammatory agents, and hormones that ultimately lead to higher LDL cholesterol, triglycerides, blood glucose, and blood pressure 19).

References   [ + ]

read more

The Truth About Fats

healthy fats list

The Truth About Fats and Oils: the good, the bad, and the in-between

Fat gets a bad rap even though it is a nutrient that you need in your diet, just not too much. Not all fats are equal. Learn all about dietary fats, which ones actually boost your health and how getting too much or too little affects your health !

Does my body need fats ? Yes, it does. Dietary fats are essential to give your body energy and to support cell growth. They also help protect your organs and help keep your body warm. Fats help your body absorb some nutrients and produce important hormones, too. Your body definitely needs fat.

Dietary fats are found in both plant and animal foods. They supply calories and help with the absorption of the fat-soluble vitamins A, vitamin D, vitamin E, and vitamin K. Some also are good sources of two essential fatty acids—linoleic acid and α-linolenic acid.

All dietary fats are composed of a mix of polyunsaturated, monounsaturated, and saturated fatty acids, in varied proportions (see Dietary Fats chart). For example, most of the fatty acids in butter are saturated, but it also contains some monounsaturated and polyunsaturated fatty acids. Oils are mostly unsaturated fatty acids, though they have small amounts of saturated fatty acids too.

Table 1. Fatty acid content of different oils, nuts, fruits, seeds and animal products

OilsMUFA, %PUFA, %SFA, %
Olive oil7310.514
Coconut oil6286
Soybean oil235816
Peanut oil463217
Sesame oil404214
Sunflower oil (linoleic acid <60%)454010
High-oleic safflower oil72137.5
Sunflower oils (linoleic acid >70%)14756
Walnut oil23639
Almond oil70178
Hazelnut oil78107
Avocado oil711312
Canola oil63287
Mustard oil592112
High oleic sunflower84410
Hering oil571621
Fish oil, cold liver472323
Flaxseed oil, cold press18689
Corn and canola oil58298
High oleic sunflower84410
Hazelnut oil78107
Olive oil7310.514
High-oleic safflower oil72137.5
Avocado oil711312
Almond oil70178
Canola oil63287
Mustard oil592112
Corn and canola oil58298
Hering oil571621
Fish oil, cold liver472323
Peanut Oil463217
Sunflower Oil (linoleic acid <60%)454010
Sesame Oil404214
Soybean oil235816
Walnut oil23639
Flaxseed oil, cold press18689
Sunflower oils (linoleic acid >70%)14756
Coconut oil6286
Nuts and SeedsMUFA, %PUFA, %SFA, %
Macademia59122
Hazelnut4684
Pecanut41226
Almonds31114
cashew nuts, dry roasted2779
Pistacchio nuts24145
Sunflower seed kernels, dried19234
Sesame, whole, roasted and toasted18217
Walnuts15353
Flaxseed8294
Safflower kernels, dried5284
Products of Animal OriginMUFA, %PUFA, %SFA, %
Butter, salted21351
Cheese, cheddar9121
Pork, ham8.326.5
Mackerl5.43.33.2
Beef, steak4.50.44.3
Egg3.623
Salmon2.12.50.9
Milk, 3.7% fat10.12.2
Chicken0.90.750.8

Note: MUFA = monounsaturated fatty acid; PUFA = polyunsaturated fatty acid; SFA = saturated fatty acid

[Source 1)]

For years, fat was a four-letter word and fat has been the bogeyman of bad health. We were urged to banish it from our diets whenever possible. We switched to low-fat foods. But the shift didn’t make us healthier, instead our low fat diet (& high sugar diet) are making us fatter and more un-healthy than ever before. This is because the world universally (based on faulty and misleading scientific conclusion) made a major public health ruling to eat low fat in our diet. This is partly because we cut back on healthy fats as well as harmful ones and partly the increase of refined sugar and high fructose corn syrup that have been added to our highly processed foods in order to make them tasty and palatable due to the lower fat/oil contents (emphasis of eating low-fat foods).

Increasingly, however, research is showing that not all fats are equal. Some oils and fatty foods contain chemicals called essential fatty acids, which our bodies need for good health.

Consuming high amounts of saturated fats linked to increased heart disease risk ! 2), 3), 4), 5). Heart and vascular disease includes heart attacks, angina, strokes, sudden cardiovascular death and the need for heart surgery.

fats

In a new study appearing online in the Journal of the American College of Cardiology, Dr. Frank Hu and colleagues found that people who replace saturated fat (primarily found in meats and dairy foods) with refined carbohydrates do not lower their risk of heart disease, whereas those who replace saturated fats with unsaturated fats or whole grains lower their heart disease risk 6).

That study shows the importance of eliminating trans fat and replacing saturated fat with unsaturated fats, including both omega-6 and omega-3 polyunsaturated fatty acids 7). Different types of dietary fat had different associations with mortality, the researchers found. Trans fats—on their way to being largely phased out of food—had the most significant adverse impact on health. Every 2% higher intake of trans fat was associated with a 16% higher chance of premature death during the study period. Higher consumption of saturated fats was also linked with greater mortality risk. When compared with the same number of calories from carbohydrate, every 5% increase in saturated fat intake was associated with an 8% higher risk of overall mortality (see Figure 1. Dietary Fats and Mortality Rates). Conversely, intake of high amounts of unsaturated fats—both polyunsaturated and monounsaturated—was associated with between 11% and 19% lower overall mortality compared with the same number of calories from carbohydrates. Among the polyunsaturated fats, both omega-6, found in most plant oils, and omega-3 fatty acids, found in fish and soy and canola oils, were associated with lower risk of premature death.

These findings support current dietary recommendations to replace saturated fat and trans-fat with unsaturated fat.

  • Scientists concluded that saturated fat should be no more than 5 percent to 6 percent of daily calories. So, for a diet of 2,000 calories a day, that would mean no more than 120 of them should come from saturated fats. That’s about 13 grams of saturated fats a day 8).

Figure 1. Dietary Fats and Mortality Rates

dietary fats and mortality rate

[Source 9)]

The Effect of Cutting Down Fat You Eat and Your Weight

Do all fats have the same number of calories ? Yes. There are nine calories in every gram of fat, regardless of what type of fat it is. Fats are more energy-dense than carbohydrates and proteins, which provide four calories per gram. (Source 10)).

Consuming high levels of calories – regardless of the source – can lead to weight gain or being overweight. Consuming high levels of saturated or trans fats can also lead to heart disease and stroke. Health experts generally recommend replacing saturated fats and trans fats with monounsaturated fats and polyunsaturated fats – while still maintaining a nutritionally-adequate diet.

The ideal proportion of energy from fat in your food and its relation to your body weight is not clear. This review (source 11)) looked at the effect of cutting down the proportion of energy from fat in your food on body weight and fatness in both adults and children who are not aiming to lose weight. The review found that cutting down on the proportion of fat in your food leads to a small but noticeable decrease in body weight, body mass index and waist circumference. This effect was found both in adults and children. The effect did not change over time.

Trials where participants were randomised to a lower fat intake versus usual or moderate fat intake, but with no intention to reduce weight, showed a consistent, stable but small effect of low fat intake on body fatness: slightly lower weight, BMI and waist circumference compared with controls. Greater fat reduction and lower baseline fat intake were both associated with greater reductions in weight. This effect of reducing total fat was not consistently reflected in cohort studies assessing the relationship between total fat intake and later measures of body fatness or change in body fatness in studies of children, young people or adults.

healthy fats list

How do you know the difference between good fats and bad fats ?

Fats are essential for living organisms. Fatty acid molecules have a variable length carbon chain with a methyl terminus and a carboxylic acid head group 12). They can be categorized based on the degree of saturation of their carbon chains. Saturated fatty acids possess the maximal number of hydrogen atoms, while monounsaturated fatty acids (MUFAs) and polyunsaturated fatty acids (PUFAs) have one, or two or more, double bonds, respectively.

The proportions of fatty acids in a particular fat determine the physical form of the fat:

  • Fats with a higher amount of polyunsaturated and monounsaturated fatty acids are usually liquid at room temperature and are referred to as “oils.”
  • Fats with a higher amount of saturated fatty acids are usually solid at room temperature and are referred to as “solid fats.” Fats containing trans fatty acids are also classified as solid fats, although they may or may not be solid at room temperature.

Your body needs some fat from food. The two essential fatty acids most important to good health are omega-3 and omega-6. But we need these in the right balance in order to protect our hearts, joints, pancreas, mood stability, and skin. It’s a major source of energy. It helps you absorb some vitamins and minerals. Fats help your body absorb fat-soluble vitamins A, vitamin D, vitamin E and vitamin K and stores them in the liver and in fatty tissues for future use.

Fat is needed to build cell membranes, the vital exterior of each cell, and the sheaths surrounding nerves. It is essential for blood clotting, muscle movement, and inflammation. Cholesterol, which is created by fat, produces important hormones like estrogen and testosterone. For long-term health, some fats are better than others. Good fats include monounsaturated and polyunsaturated fats. Bad ones include industrial-made trans fats. Saturated fats fall somewhere in the middle.

All fats have a similar chemical structure: a chain of carbon atoms bonded to hydrogen atoms. What makes one fat different from another is the length and shape of the carbon chain and the number of hydrogen atoms connected to the carbon atoms. Seemingly slight differences in structure translate into crucial differences in form and function.

1) Unsaturated Fats (called the Good Fats) come mainly from vegetables, nuts, seeds, and fish. They differ from saturated fats by having fewer hydrogen atoms bonded to their carbon chains. Healthy fats are liquid at room temperature, not solid. There are two broad categories of beneficial fats: monounsaturated and polyunsaturated fats.

Good fats can improve blood cholesterol levels, ease inflammation and stabilize heart rhythms. Most of us don’t get enough of these healthy unsaturated fats. The traditional Greek diet gets up to 30 percent of its calories from monounsaturated fats, mostly from olive oil.

There are two broad categories of beneficial fats: monounsaturated and polyunsaturated fats. Scientists have now established that trans fats found in many fast foods, bakery products and margarines increase the risk of cardiovascular disease through inflammatory processes.

Two types of Unsaturated fats (Good Fats):

a) Monounsaturated Fats are found in high concentrations in olive oil, peanut oil, canola, avocados, almonds, safflower oils, hazelnuts, pecans, pumpkin seeds and sesame seeds and most nuts. Monounsaturated fats also are part of most animal fats such as fats from chicken, pork, beef, and wild game. When you dip your bread in olive oil at an Italian restaurant, you’re getting mostly monounsaturated fat. Monounsaturated fats have a single carbon-to-carbon double bond. The result is that it has two fewer hydrogen atoms than a saturated fat and a bend at the double bond. This structure keeps monounsaturated fats liquid at room temperature. Good sources of monounsaturated fats are olive oil, peanut oil, canola oil, avocados, most nuts, as well as high-oleic safflower and sunflower oils. The carbon-carbon double bond found in monounsaturated or polyunsaturated fatty acids can exist in the cis or trans configuration. When the two hydrogen atoms are on opposite sides of the double bond, the configuration is called trans. When the hydrogen atoms are on the same side of the double bond, the configuration is called cis.

The discovery that monounsaturated fat could be healthful came from the Seven Countries Study during the 1960s. It revealed that people in Greece and other parts of the Mediterranean region enjoyed a low rate of heart disease despite a high-fat diet. The main fat in their diet, though, was not the saturated animal fat common in countries with higher rates of heart disease. It was olive oil, which contains mainly monounsaturated fat. This finding produced a surge of interest in olive oil and the “Mediterranean Diet” a style of eating regarded as a healthful choice today.

Although there’s no recommended daily intake of monounsaturated fats, the Institute of Medicine recommends using them as much as possible along with polyunsaturated fats to replace saturated and trans fats.

Figure 2. Monounsaturated Fatty Acids Structure

monounsaturated fatty acids structure

b) Polyunsaturated Fats (polyunsaturated fatty acids) are found in high concentrations in sunflower, corn, soybean, flaxseed oils, walnuts, flax seeds, hemp seeds, pine nuts, sesame, cottonseed oils, pumpkin seeds and fish.

Polyunsaturated fatty acids (PUFAs) can be further subdivided on the basis of the location of the first double bond relative to the methyl terminus of the chain. For example, n-3 and n-6 fatty acids are two of the most biologically significant polyunsaturated fatty acid classes, and have their first double bond on either the third or sixth carbon from the chain terminus, respectively. The final carbon in the fatty acid chain is also known as the omega carbon, hence the common reference to these fatty acids as omega-3 or omega-6 PUFAs. The distinction between omega-6 and omega-3 fatty acids is based on the location of the first double bond, counting from the methyl end of the fatty acid molecule (see Figure 4). Omega-6 fatty acids are represented by Linoleic acid (LA) (18:2ω-6) and Arachidonic acid (AA) (20:4ω-6) and omega-3 fatty acids by Alpha-linolenic acid (ALA) (18:3ω-3), Eicosapentaenoic acid (EPA) (20:5ω-3) and Docosahexaenoic acid (DHA) (22:6ω-3).

Long-chain n-3 and n-6 PUFAs are synthesized from the essential fatty acids: alpha-linolenic acid (ALA) and linoleic acid (LA), respectively. Basic structures of these two parent PUFAs are shown in Figure 3 and Figure 4. An essential fatty acid cannot be made by the body and must be obtained through dietary sources. Animals and humans have the capacity to metabolize essential fatty acids to long-chain derivatives. Because the n-6 and n-3 pathways compete with one another for enzyme activity, the ratio of n-6 to n-3 PUFAs is very important to human health. An overabundance of fatty acids from one family will limit the metabolic production of the longer chain products of the other. The typical Western diet provides n-6 and n-3 PUFAs in a ratio ranging from 8:1 to 25:1 13), values in severe contrast with the recommendations from national health agencies of approximately 4:1 14). Lowering the n-6:n-3 ratio would reduce competition for the enzymes and facilitate the metabolism of more downstream products of ALA.

Mammalian cells cannot convert omega-6 to omega-3 fatty acids because they lack the converting enzyme, omega-3 desaturase. Omega-6 and omega-3 fatty acids are not interconvertible, are metabolically and functionally distinct, and often have important opposing physiological effects, therefore their balance in the diet is important 15).

This study showed a balanced omega-6/omega-3 ratio 1–2/1 is one of the most important dietary factors in the prevention of obesity, along with physical activity. A lower omega-6/omega-3 ratio should be considered in the management of obesity 16).

Because most diets are already very rich in n-6 PUFAs, greater focus needs to be placed on incorporating n-3 PUFAs into the diet. Dietary sources of n-3 PUFAs are readily available but in limited quantities. Many foods contain alpha-linolenic acid (ALA), including certain vegetable oils, dairy products, flaxseed, walnuts and vegetables 17). Fatty fish, such as mackerel, herring and salmon, provide an excellent source of the long-chain derivatives of ALA, eicosapentaenoic acid (EPA) and docosahexaenoic acid (DHA) 18).

Omega-3 fatty acids are a type of polyunsaturated fats found in seafood, such as salmon, trout, herring, tuna, and mackerel, and in flax seeds and walnuts. EPA and DHA are long chain n-3 fatty acids found in seafood. Omega-3 fats are one important type of polyunsaturated fat. Polyunsaturated fats are essential fats. That means your body can’t produce these and they’re required for normal body functions. So you must get them from food. Polyunsaturated fats are used to build cell membranes and the covering of nerves. They are needed for blood clotting, muscle movement, and inflammation.

A polyunsaturated fat has two or more double bonds in its carbon chain. There are two main types of polyunsaturated fats: omega-3 fatty acids and omega-6 fatty acids. The numbers refer to the distance between the beginning of the carbon chain and the first double bond (see Figure 4.). Both types offer health benefits.

Figure 3. Polyunsaturated Fatty Acids Structure

polyunsaturated fatty acids structure

Polyunsaturated fatty acids (PUFAs) can be further subdivided on the basis of the location of the first double bond relative to the methyl terminus of the chain. For example, n-3 and n-6 fatty acids are two of the most biologically significant polyunsaturated fatty acid classes, and have their first double bond on either the third or sixth carbon from the chain terminus, respectively. The final carbon in the fatty acid chain is also known as the omega carbon, hence the common reference to these fatty acids as omega-3 or omega-6 PUFAs.

Figure 4. Omega-3 fatty acids (ALA, EPA & DHA) and Omega-6 fatty acids (LA & AA) structure

omega-3 and omega-6 fatty acids structure

Note: Omega-6 fatty acids are represented by Linoleic acid (LA) (18:2ω-6) and Arachidonic acid (AA) (20:4ω-6) and Omega-3 fatty acids by Alpha-linolenic acid (ALA) (18:3ω-3), Eicosapentaenoic acid (EPA) (20:5ω-3) and Docosahexaenoic acid (DHA) (22:6ω-3).

Eating polyunsaturated fats in place of saturated fats or highly refined carbohydrates reduces harmful LDL cholesterol and improves the cholesterol profile. It also lowers triglycerides.

We don’t eat nearly enough omega-3, which can reduce our risk for heart disease and cancer. Good sources of omega-3 fatty acids include fatty fish such as salmon, mackerel, and sardines, all green leafy vegetables, flaxseeds, walnuts, canola oil, and unhydrogenated soybean oil.

Omega-3 fatty acids may help prevent and even treat heart disease and stroke. In addition to reducing blood pressure, raising HDL, and lowering triglycerides, polyunsaturated fats may help prevent lethal heart rhythms from arising. Evidence also suggests they may help reduce the need for corticosteroid medications in people with rheumatoid arthritis. Studies linking omega-3s to a wide range of other health improvements, including reducing risk of dementia, are inconclusive, and some of them have major flaws, according to a systematic review of the evidence by the Agency for Healthcare Research and Quality.

Omega-6 fatty acids have also been linked to protection against heart disease. Foods rich in linoleic acid and other omega-6 fatty acids include vegetable oils such as safflower, soybean, sunflower, walnut, and corn oils.

The latest research on nuts by the Harvard School of Public Health found that women who reported eating a half serving of peanut butter or a full serving of nuts five or more times a week showed as much as a 30% reduced risk of developing type 2 diabetes. And eating other nuts, like almonds, walnuts, and pecans, have been shown to have heart healthy benefits, including lowering “bad” LDL cholesterol. (Remember, walnuts are also a source of omega-3.)

2) Saturated Fats:

Saturated fats are common in the American diet. They are solid at room temperature — think cooled bacon grease, butter, beef tallow, coconut oil, ghee or pork lard. Common sources of saturated fat include lard, butter, ghee, red meat, palm oil, whole milk and other whole-milk dairy foods, cheese, coconut oil, and many commercially prepared baked goods and other foods 19). Coconut, palm kernel, and palm oil are called oils because they come from plants. However, they are solid or semi-solid at room temperature due to their high content of short-chain saturated fatty acids. They are considered solid fats for nutritional purposes. They also are found in other animal fats, such as pork and chicken fats and in other plant fats, such as nuts.

The word “saturated” here refers to the number of hydrogen atoms surrounding each carbon atom. The chain of carbon atoms holds as many hydrogen atoms as possible — it’s saturated with hydrogens.

Figure 5. Saturated Fatty Acids Structure

Saturated-Fatty-Acid-structure

According to the American Heart Association Advisory 20), cardiovascular disease was lowered by about 30 percent, similar to the effect of cholesterol-lowering statin drugs when vegetable oil replaced saturated fat in the diet. The switch to healthier oils also was associated with lower rates of death from all causes. The American Heart Association recommends aiming for a dietary pattern that achieves 5% to 6% of calories from saturated fat, that’s about 13 grams of saturated fats a day 21).

healthy and bad fats list

[Source Data from US Department of Agriculture food composition tables 22)].

Note: A zero value equals <0.5 g/100 g.
*Primary safflower and sunflower oils of commerce.

fatty acids composition of edible oils

Is Saturated Fat Bad for you ?

Yes 23), 24), 25). The main sources of saturated fat to be decreased are dairy fat (butter), lard (pork), beef tallow, palm oil, palm kernel oil, and coconut oil. A diet rich in saturated fats can drive up total cholesterol, and tip the balance toward more harmful LDL cholesterol, which prompts blockages to form in arteries in the heart and elsewhere in the body. For that reason, most nutrition experts recommend limiting saturated fat to under 10% of calories a day.

Recent published review on available clinical trials and scientific studies involving 15 studies with over 59,000 participants 26) — found the evidence on (current) to March 2014 —- that cutting down on saturated fat led to a 17% reduction in the risk of cardiovascular disease (including heart disease and strokes), but no effects on the risk of dying. The review  27) found no clear health benefits of replacing saturated fats with starchy foods or protein. Changing the type of fat we eat, replacing saturated fats with polyunsaturated fats, seems to protect us better, reducing our risk of heart and vascular problems. The greater the decrease in saturated fat, and the more serum total cholesterol is reduced, the greater the protection. People who are currently healthy appear to benefit as much as those at increased risk of heart disease or stroke (people with high blood pressure, high serum cholesterol or diabetes, for example), and people who have already had heart disease or stroke. There was no clear difference in effect between men and women.

However, some recent studies have also questioned the role saturated fat plays in heart disease and this has created confusion among patients, their physicians, and the public 28), 29), 30), 31), 32), 33), 34), 35), 36), 37). One meta-analysis of 21 studies said that there was not enough evidence to conclude that saturated fat increases the risk of heart disease, but that replacing saturated fat with polyunsaturated fat may indeed reduce risk of heart disease.

In a recent randomized clinical trials on saturated fat (published June 2017) 38) where the group that is assigned a diet lower in saturated fat is taught how to replace it with foods higher in ≥1 other macronutrients, typically carbohydrates or unsaturated fats, to maintain the same total energy intake. Other trials, often called controlled feeding trials, actually provide to the research participants their assigned diet high or low in saturated fat balanced with a similar amount of energy from another macronutrient. Essential to the interpretation of the results from these trials (and the reason for the divergent results in meta-analyses noted above) is the macronutrient composition of the comparator diet. Clinical trials that used polyunsaturated fat to replace saturated fat reduced the incidence of cardiovascular disease 39), 40). In contrast, trials that used mainly carbohydrates to replace saturated fat did not reduce cardiovascular disease. However, the types of carbohydrate-containing foods were often unspecified and typically included
sugar and other refined carbohydrates to maintain energy balance. Evidence from prospective observational studies indicates that carbohydrates from whole grains reduce cardiovascular disease when they replace saturated fat 41).

Prospective observational studies, also called cohort studies, are conducted in large populations in which dietary intake is assessed at the beginning of the study
and in some studies reassessed repeatedly during the follow-up periods, and cardiovascular disease is assessed at various points during follow-up. In prospective observational studies, the participants eat whatever diet they themselves choose, and the researchers request that participants report their recent or past dietary history. Research participants in observational studies who eat a large amount of saturated fat eat less of various other macronutrients, usually carbohydrates, unsaturated fat, or both, to maintain energy intake. Participants who eat a comparatively small amount of saturated fat eat more carbohydrates or unsaturated fats. Because carbohydrates and unsaturated fats differ in their metabolic effects, it is necessary to evaluate the effects of low and high saturated fat intakes in the context of the replacement macronutrient. This is easier in a clinical trial because the trial controls the dietary intake but more complicated in observational studies in which the participants control their own diets.

Meta-analyses of prospective observational studies aiming to determine the effects on cardiovascular disease of saturated fat that did not take into consideration the replacement macronutrient have mistakenly concluded that there was no significant effect of saturated fat intake on cardiovascular disease risk 42), 43). In contrast, meta-analyses that specifically evaluated the effect of replacing saturated fat with polyunsaturated fat found significant benefit, whereas replacing saturated fat with carbohydrates, especially refined carbohydrates, yielded no significant benefit to cardiovascular disease risk 44), 45), 46). Thus, again, differences in the effects of the replacement or comparator nutrients, specifically carbohydrates and unsaturated fats, are at the root of the apparent discrepancies among studies and meta-analyses on whether lowering saturated fat reduces the risk of developing cardiovascular disease. In fact, the evidence to recommend reduction of saturated fat and its replacement by polyunsaturated and monounsaturated fat has strengthened as better methodology is more widely adopted for the analysis of dietary intake in observational studies. The study authors judge the evidence to favor  recommending n-6 polyunsaturated fat, that is, linoleic acid, stronger than monounsaturated fat to replace saturated fat because of the positive results of randomized clinical trials that used polyunsaturated fat compared with the paucity of trials that used monounsaturated fat 47); the greater relative risk reduction for  polyunsaturated fats in observational studies 48), 49), 50); the greater reduction in LDL cholesterol with polyunsaturated fat 51); and the regression of atherosclerosis in nonhuman primates by polyunsaturated but not monounsaturated fat 52). However, progress in reducing cardiovascular disease would be enhanced by replacing saturated fat by either type of unsaturated fat. Two other major studies narrowed the prescription slightly, concluding that replacing saturated fat with polyunsaturated fats like vegetable oils or high-fiber carbohydrates is the best bet for reducing the risk of heart disease, but replacing saturated fat with highly processed carbohydrates could do the opposite.

Polyunsaturated fats are contained in canola oil, corn oil, soybean oil, peanut oil, safflower oil, sunflower oil, and walnuts. However, original high-linoleic varieties of safflower and sunflower oils are uncommon. High-oleic varieties of safflower and sunflower oil, olive oil, avocados, and tree nuts such as almonds, cashews, hazelnuts, pistachios, and pecans have mainly monounsaturated fats and are low in saturated fat.

Too much saturated fat in your diet can lead to heart disease and other health problems.

In large randomized clinical trials that used polyunsaturated fat to replace saturated fat reduced the incidence of cardiovascular disease 53), 54). Cardiovascular disease is the leading global cause of death, accounting for 17.3 million deaths per year, comprising 31.5% of total global deaths in 2013. Nearly 808 000 people in the United States died of heart disease, stroke, and other cardiovascular diseases in 2014, translating to about 1 of every 3 deaths.

This large cohort study 55) found that higher intake of saturated fat (found in foods like butter, lard, tallow and red meat) and especially trans fat (predominantly from partially hydrogenated vegetable oil), was associated with greater risk of mortality (death) when compared with the same number of calories from carbohydrate. When compared with carbohydrates, every 5% increase of total calories from saturated fat was associated with an 8% higher risk of overall mortality, and every 2% higher intake of trans fat was associated with a 16% higher risk of overall mortality 56). The study investigated 83,349 women from the Nurses’ Health Study (July 1, 1980, to June 30, 2012) and 42,884 men from the Health Professionals Follow-up Study (February 1, 1986, to January 31, 2012) who were free of cardiovascular disease, cancer, and types 1 and 2 diabetes at baseline 57). Dietary fat intake was assessed at baseline and updated every 2 to 4 years. Information on mortality was obtained from systematic searches of the vital records of states and the National Death Index, supplemented by reports from family members or postal authorities. Of the 126,233 participants who were followed up for as long as 32 years, the study found that higher intakes of saturated fat and trans-fat were associated with increased mortality, whereas higher intakes of polyunsaturated (PUFA) and monounsaturated (MUFA) fatty acids were associated with lower mortality. Replacing 5% of energy from saturated fats with equivalent energy from PUFA and MUFA was associated with reductions in total mortality of 27% and 13%, respectively 58).

People who replaced saturated fats with carbohydrates had only slightly lower mortality risk. In addition, replacing total fat with carbohydrates was associated with modestly higher mortality. This was not surprising, the authors said, because carbohydrates in the American diet tend to be primarily refined starch and sugar, which have a similar influence on mortality risk as saturated fats.

“Our study shows the importance of eliminating trans fat and replacing saturated fat with unsaturated fats, including both omega-6 and omega-3 polyunsaturated fatty acids. In practice, this can be achieved by replacing animal fats with a variety of liquid vegetable oils,” said senior author Frank Hu, professor of nutrition and epidemiology at Harvard Chan School and professor of medicine at Harvard Medical School.

This study is the most detailed and powerful examination to date on how dietary fats impact health. It suggests that replacing saturated fats like butter, lard, and fat in red meat with unsaturated fats from plant-based foods—like olive oil, canola oil, and soybean oil—can confer substantial health benefits and should continue to be a key message in dietary recommendations.

Meaning: Different types of dietary fat had different associations with mortality, the researchers found. Trans fats—on their way to being largely phased out of food—had the most significant adverse impact on health. Every 2% higher intake of trans fat was associated with a 16% higher chance of premature death during the study period. Higher consumption of saturated fats was also linked with greater mortality risk. When compared with the same number of calories from carbohydrate, every 5% increase in saturated fat intake was associated with an 8% higher risk of overall mortality.

Conversely, intake of high amounts of unsaturated fats—both polyunsaturated and monounsaturated—was associated with between 11% and 19% lower overall mortality compared with the same number of calories from carbohydrates. Among the polyunsaturated fats, both omega-6, found in most plant oils, and omega-3 fatty acids, found in fish and soy and canola oils, were associated with lower risk of premature death.

Is Saturated Fat Healthy ?

Consuming high amounts of saturated fats linked to increased heart disease risk ! 59), 60), 61), 62)

In a new study appearing online in the Journal of the American College of Cardiology, Dr. Frank Hu and colleagues found that people who replace saturated fat (primarily found in meats and dairy foods) with refined carbohydrates do not lower their risk of heart disease, whereas those who replace saturated fats with unsaturated fats or whole grains lower their heart disease risk 63).

Previous studies have shown that individual saturated fatty acids have different effects on blood lipids, but little is known about associations between individual saturated fatty acid intake and coronary heart disease risk. However, in a study that appeared online on 23rd November 2016, in The British Medical Journal 64), where the researchers analyzed data from 73,147 women involved in the Nurses’ Health Study between 1984 and 2012, and 42,635 men who were in the Health Professionals Follow-up Study between 1986 and 2010. Participants reported their diet and health status on questionnaires completed every four years. The study found that a higher intake of the most commonly consumed major saturated fatty acids—lauric acid, myristic acid, palmitic acid, and stearic acid—was associated with a 18% increased relative risk of coronary heart disease 65). This study dispels the notion that ‘butter is good’, said Dr. Hu the study co-author. Dr. Hu added, “individual saturated fatty acids share the same food sources, such as red meat, dairy, butter, lard, and palm oil. Therefore it is impractical to differentiate the types of saturated fatty acids in making dietary recommendations, an idea that some researchers have put forth. Instead, it is healthier to replace these fatty acids with unsaturated fats from vegetable oils, nuts, seeds, and seafood as well as high quality carbohydrates” 66). “Replacing sources of saturated fat in our diets with unsaturated fats is one of the easiest ways to reduce our risk of heart disease,” said Walter Willett, a co-author and professor of epidemiology and nutrition.

Replacing just 1% of daily consumption of these fatty acids with equivalent calories from polyunsaturated fats, whole grain carbohydrates, or plant proteins, was estimated to reduce relative coronary heart disease risk by 6%-8%. Replacing palmitic acid—found in palm oil, meat, and dairy fat—was associated with the strongest risk reduction.

Figure 6. Dietary Fats and Heart Disease Riskghee and butter increase risk of heart disease

These findings support current dietary recommendations to replace saturated fat and trans-fat with unsaturated fat.

  • Scientists concluded that saturated fat should be no more than 5 percent to 6 percent of daily calories. So, for a diet of 2,000 calories a day, that would mean no more than 120 of them should come from saturated fats. That’s about 13 grams of saturated fats a day 67).

There’s a lot of conflicting information about saturated fats. Should you eat them or not ?

Saturated fats are bad for your health in several ways:

  • Heart disease risk. Your body needs healthy fats for energy and other functions. But too much saturated fat can cause cholesterol to build up in your arteries (blood vessels). Saturated fats raise your LDL, or bad, cholesterol. High LDL cholesterol increases your risk for heart disease and stroke.
  • Weight gain. Many high-fat foods such as pizza, baked goods, and fried foods have a lot of saturated fat. Eating too much fat can cause you to gain weight. All fats contain 9 calories per gram of fat. This is more than twice the amount found in carbohydrates and protein.

Cutting out high-fat foods can help keep your weight in check and keep your heart healthy. Staying at a healthy weight can reduce your risk of diabetes, heart disease, and other health problems.

The most recent American Heart Association and American College of Cardiology advisory 68), reaffirms that longstanding advice. Here are some of the scientific highlights:

  • Randomized controlled trials that lowered intake of dietary saturated fat and replaced it with polyunsaturated vegetable oil reduced cardiovascular disease by about 30 percent – similar to results achieved by some cholesterol-lowering drugs known as statins 69).
  • Prospective observational studies in many populations showed that a lower intake of saturated fat with a higher intake of polyunsaturated and monounsaturated fat is associated with lower rates of cardiovascular disease 70).
  • Several studies found that coconut oil – which is predominantly saturated fat but has been widely touted recently as healthy – raised LDL cholesterol to the same degree as other saturated fats found in butter, beef fat, ghee and palm oil.
  • Replacing saturated fat with mostly refined carbohydrate and sugars does not lower rates of heart disease, but replacing these fats with whole grains is associated with lower rates. This indicates that saturated fat and refined carbohydrate are equally bad relative to heart disease risk.

Saturated fats are found in all animal foods, and some plant sources.

The following foods are high in saturated fats. Many of them are also low in nutrients and have extra calories from sugar:

  • Baked goods (cake, doughnuts, Danish)
  • Fried foods (fried chicken, fried seafood, French fries)
  • Fatty or processed meats (bacon, sausage, chicken with skin, cheeseburger, steak)
  • Whole-fat dairy products (butter, ice cream, pudding, cheese, whole milk)
  • Solid fats such as coconut oil, palm, and palm kernel oils (found in packaged foods)

Here are some examples of popular food items with the saturated fat content in a typical serving:

  • 12 ounces (oz), or 340 g, steak — 20 g
  • 12 oz (340 g) cream of mushroom soup — 22 g
  • Cheeseburger — 10 g
  • Vanilla shake — 8 g
  • 1 tablespoon (15 mL) butter — 7 g

It is fine to treat yourself to these types of foods once in a while. But, it is best to limit how often you eat them and limit portion sizes when you do.

What’s my daily limit for foods with saturated fats ?

The American Heart Association recommends aiming for a dietary pattern that achieves 5% to 6% of calories from saturated fat.

For example, if you need about 2,000 calories a day, no more than 120 of them should come from saturated fats.

That’s about 13 grams of saturated fats a day.

How to eat less saturated and trans fats

The American Heart Association 71) recommends that adults who would benefit from lowering LDL cholesterol reduce their intake of trans fat and limit their consumption of saturated fat to 5 to 6 percent of total calories.

Are all foods labeled “trans fat-free” healthy foods ?

Not necessarily. Foods labeled “0 trans fat” or cooked with “trans fat-free” oils may contain a lot of saturated fats, which raise your bad cholesterol levels. “Trans fat-free” foods may also be unhealthy in terms of their general nutrient content. For example, baked goods also tend to be high in added sugars and low in nutrients.

Here are some ways to eat less saturated and trans fats:

  • Eat a dietary pattern that emphasizes fruits, vegetables, whole grains, low-fat dairy products, poultry, fish and nuts. Also limit red meat and sugary foods and beverages.
  • Use naturally occurring unhydrogenated vegetable oils such as canola, safflower, sunflower or olive oil most often.
  • Look for processed foods made with unhydrogenated oil rather than partially hydrogenated or hydrogenated vegetable oils or saturated fat.
  • Use soft margarine as a substitute for butter, and choose soft margarines (liquid or tub varieties) over harder stick forms. Look for “0 g trans fat” on the Nutrition Facts label.
  • Doughnuts, cookies, crackers, muffins, pies and cakes are examples of foods high in trans fat. Don’t eat them often.
  • Limit commercially fried foods and baked goods made with shortening or partially hydrogenated vegetable oils. These foods very high in fat, and it’s likely to be trans at.
  • Limit fried fast food. Commercial shortening and deep-frying fats are still made by hydrogenation and contain saturated fat and trans fat.

What are alternatives to replace saturated fats in the foods you eat ?

To get the nutrients you need, eat a dietary pattern that emphasizes:

  • fruits, vegetables,
  • whole grains,
  • low-fat dairy products,
  • poultry, fish and nuts,
  • while limiting red meat and sugary foods and beverages.

Choose lean meats and poultry without skin and prepare them without added saturated and trans fat.

You should replace foods high in saturated fats with foods high in monounsaturated and/or polyunsaturated fats. This means eating foods made with liquid vegetable oil but not tropical oils. It also means eating fish and nuts. You also might try to replace some of the meat you eat with beans or legumes.

3) Bad Fats (Trans Fat or Hydrogenated Oils):

The worst type of dietary fat is the kind known as trans fat. The right amount of trans fats is zero !   These fats have no nutritional value and we know for certain they are bad for heart health. Trans fats increase LDL cholesterol and triglyceride levels while reducing levels of HDL cholesterol. The trans fats also known as hydrogenated oils because the trans fats come from vegetable oils that were chemically modified so they are solid like butter. The solidifying process – called hydrogenation – that is used to turn healthy oils into solids and to prevent them from becoming rancid. When vegetable oil is heated in the presence of hydrogen and a heavy-metal catalyst such as palladium, hydrogen atoms are added to the carbon chain. This turns oils into solids. It also makes healthy vegetable oils more like not-so-healthy saturated fats. On food label ingredient lists, this manufactured substance is typically listed as “partially hydrogenated oil” in order to extend the shelf life of food, but it also turns polyunsaturated oils into a kind of man-made cholesterol. Trans fats can increase your level of “bad” LDL cholesterol and may increase your risk of heart disease. What’s more, these man-made fats are taken up by the body much easier than are omega-3s. So trans fatty acids not only harm your health, they also block the absorption of healthy fats.

Because these oils don’t spoil as quickly as butter, they are used in most packaged cookies, chips, crackers and other baked goods sold in the supermarket, as well as in margarines. Trans Fat (Hydrogenated Oils) are found in most processed food, including margarine, potato chips, baked goods, cookies, pastries to fast-food French fries, etc. They are toxic, blocking absorption of essential fatty acids and eating foods rich in trans fats increases the amount of harmful LDL cholesterol in the bloodstream and reduces the amount of beneficial HDL cholesterol. Trans fats create inflammation, which is linked to heart disease, stroke, diabetes, and other chronic conditions. They contribute to insulin resistance, which increases the risk of developing type 2 diabetes. Research from the Harvard School of Public Health and elsewhere indicates that trans fats can harm health in even small amounts: for every 2% of calories from trans fat consumed daily, the risk of heart disease rises by 23%.

The American Heart Association recommends limiting your trans fat daily consumption to less than 1 percent.

Trans fats have no known health benefits and that there is no safe level of consumption. Recently, the FDA banned trans fats from the U.S. food supply. The phasing-out process is expected to take three years. The encouraging news is that many major food suppliers and restaurants have already substituted healthier fats for trans fats. Today, these mainly man-made fats are rapidly fading from the food supply.

The consumption of trans fats has been directly linked to an increase in coronary heart disease. Trans fats appear to have a detrimental effect on serum lipids by increasing LDL “bad” cholesterol and triglyceride levels, and reducing high-density (HDL “good”) lipoprotein cholesterol levels 72), 73), 74), 75), 76). Studies have shown that substituting 2 percent of total energy intake with trans-fatty acids is associated with a 14 to 36 percent increase in the incidence of coronary artery disease (Table 2) 77), 78), 79), 80). Observational data from the Nurses’ Health Study suggests that replacing 5 percent of energy from saturated fat with energy from unsaturated fats could reduce the risk of coronary heart disease by 42 percent; however, replacing only 2 percent of energy from trans fats with energy from non-hydrogenated, unsaturated fats could reduce the risk of coronary heart disease by 53 percent 81).

Table 2. Trans Fat Consumption and Coronary Heart Disease

StudyNumber of patientsYears of follow-upRelative risk of coronary heart disease with trans-fat consumption*

Alpha-Tocopherol, Beta-Carotene Cancer Prevention Study 82)

21,930 men who smoke

6.1

1.14

Zutphen Elderly Study 83)

667 men

10

1.28

Health Professionals Follow-up Study 84)

43,757 men

6

1.36

Nurses’ Health Study 85)

80,082 women

14

1.33


CHD = coronary heart disease

*—For each isocaloric substitution of 2 percent of total energy intake with trans-fatty acids.

[Source 86)]

How Much Good Fats Do You Really Need ?

In 1999, the International Society for the Study of Fatty Acids and Lipids agreed upon a recommendation table on daily intake of fatty acids as a foundation for further discussions 87). Polyunsaturated fatty acids (PUFAs) with 18 carbon (C18) atoms such as linoleic (18:2 ω-6), and α-linolenic (18:3 ω-3) are known as essential fatty acids in human nutrition 88). These fatty acids, although regarded as an indispensable component for cell structure and development and function, cannot be synthesized by the human body. Nutritionists recommend a balanced lipid intake corresponding to a total amount of fats equal to 25 to 30% of total calories with a ratio in fatty acids as follows: 1-Saturates (6–8%), 2-Monounsaturates (12–14%), 3- Polyunsaturates as a ω-6 (6–7%), and 4-Polyunsaturates as a ω-3 (0.5–1.5%) 89). The American Heart Association recommends aiming for a dietary pattern that achieves 5% to 6% of calories from saturated fat 90). Saturated fatty acids increase plasma cholesterol level and acts as “promoters” of certain cancer development (e.g., colon, breast, and perhaps uterus and prostate).

Adequate intake levels for adults were specified with respect to α-linolenic acid (ALA or Omega-3 fatty acid 18:3ω-3), eicosapentaenoic acid (EPA or Long Chain Omega-3 fatty acid 20:5ω-3), docosahexaenoic acid (DHA or Long Chain Omega-3 fatty acid 22:6ω-3), as well as upper limits for linoleic acid (LA or Omega-6 fatty acids), trans-fatty acids, and saturated, given as % of total energy content, respectively. Given a total fat range from 15% to 40% of total energy content, there is no precise value (i.e., % of total energy content in the form of MUFA) was given by the panel 91). According to the Joint FAO/WHO Expert Consultation Committee, MUFA intakes should be determined by calculating the difference: MUFA (% of total energy content) = total fat (% of total energy content) − SFA (% of total energy content) − PUFA (% of total energy content) − TFA (% of total energy content). Accordingly, MUFA intakes (% of total energy content) will range with respect to the total fat and fatty acid composition of the diet 92).

The debate continues on the optimal dietary fatty acid composition, but the evidence supporting Monounsaturated Fatty Acid (MUFA) as the healthy dietary fatty acid is weak. Even when considering the food source of MUFA (plant vs animal), there is little evidence to support recommendations to increase dietary MUFA for coronary heart disease prevention. However, since no detrimental effects of MUFA-rich diets were reported in the literature to date, there is no evidence speaking against the consideration of MUFAs in dietary guidelines. Further studies dealing with long-term effects of MUFA on biomarkers of obesity, diabetes, and cardiovascular diseases as well as clinical endpoints are needed to clarify the potential benefits of MUFA-rich diets in primary and secondary prevention.

On the other hand, increasing dietary Polyunsaturated Fatty Acid (PUFA) consistently appears to provide benefit. A considerably larger number of meta-analyses explored the effects of Polyunsaturated Fatty Acids (PUFAs) on maintenance or reduction of body weight as well as biomarkers of impaired glucose metabolism or cardiovascular disease or coronary heart disease than there are systematic reviews and meta-analyses dealing with the corresponding impact of Monounsaturated Fatty Acids (MUFAs). Consequently, the international recommendations for Polyunsaturated Fatty Acid (PUFA) are more consistent than those for MUFA, averaging a value of 10% of total energy content for healthy persons for the most part. If MUFA recommendations are given at all, they vary between 12% and 25% of total energy content, equaling a remarkable range of ~30–70 g/day for a 2.500 kcal-diet. Prestigious authorities and organizations such as the National Institute of Medicine, the EFSA, the USDA and the ADA do not provide specific recommendation for MUFAs either for healthy people or for patients in need of diabetic or cardiovascular management.

Most of us get too much fat, and too much unhealthy fat. Most experts recommend that we get 30% of our calories from good fat, although we can survive fine on as little as 20%, even 10%. If you’re like most of us, you’re getting plenty of fat – most Americans consume about 40% of their calories from fats in meat, butter, cheese, baked goods, etc.

To make the switch to heart-healthy fats, start by avoiding the truly unhealthy fats – trans fatty acids. These trans fats come from vegetable oils that were chemically modified so they are solid like butter. Because these oils don’t spoil as quickly as butter, they are used in most packaged cookies, chips, crackers and other baked goods sold in the supermarket, as well as in margarines.

Summary

  • Decreased saturated fatty acid intake decreases blood total cholesterol and LDL cholesterol concentrations.
  • Replacement of saturated fatty acids with polyunsaturated and/or monounsaturated fatty acids decreases blood total cholesterol and LDL cholesterol concentrations.
  • Most of us eat too much fat, and too much unhealthy fat. Most experts recommend that we get 30% of our calories from good fat, although we can survive fine on as little as 20%, even 10%. If you’re like most of us, you’re getting plenty of fat – most Americans consume about 40% of their calories from fats in meat, butter, cheese, baked goods, etc.

Conclusion

Different types of dietary fat had different associations with mortality, the researchers found. Trans fats—on their way to being largely phased out of food—had the most significant adverse impact on health. Every 2% higher intake of trans fat was associated with a 16% higher chance of premature death during the study period. Higher consumption of saturated fats was also linked with greater mortality risk. When compared with the same number of calories from carbohydrate, every 5% increase in saturated fat intake was associated with an 8% higher risk of overall mortality.

Conversely, intake of high amounts of unsaturated fats—both polyunsaturated and monounsaturated—was associated with between 11% and 19% lower overall mortality compared with the same number of calories from carbohydrates. Among the polyunsaturated fats, both omega-6, found in most plant oils, and omega-3 fatty acids, found in fish and soy and canola oils, were associated with lower risk of premature death.

Because fat is an essential nutrient to give your body energy, help your body absorb some nutrients and produce important hormones and to support cell growth. Eating foods with fat is definitely part of a healthy diet. A healthy diet can include the foods you love. You don’t have to avoid treats entirely, but you do need to eat less of foods that are low in nutrition and high in calories.

Just remember to choose foods that provide good fats (monounsaturated and polyunsaturated fats) and balance the amount of calories you eat from all foods with the amount of calories you burn. Whether it is olive oil, ghee, butter or coconut oil — they are all 100 percent fat. All fat have calories.

All fats, whether good or bad, no matter how good the oil sounds — remember that it is still a fat, with 120 calories per tablespoon. Consuming a high fat diet may lead to becoming overweight and that is not healthy !

Aim to eat a dietary pattern that emphasizes intake of vegetables, fruits, and whole grains; includes low-fat dairy products, poultry, fish, legumes, non-tropical vegetable oils and nuts; and limits intake of sodium, sweets, sugar sweetened beverages and red meats. Doing so means that your diet will be low in both saturated fats and trans fats.

While you switch to a heart-healthy diet you may need to keep tabs on your calorie intake for a while.

References   [ + ]

read more

How Your Body Metabolizes Sugar

How body metabolises sugar

sugar structure

How Your Body Metabolizes Sugar

Sugars are the smallest and simplest type of carbohydrate. They are easily digested and absorbed by the body.

There are two types of sugars, and most foods contain some of each kind.

Single sugars (monosaccharides) are small enough to be absorbed directly into the bloodstream. They include:Sugars that contain two molecules of sugar linked together (disaccharides) are broken down in your body into single sugars. They include:
FructoseSucrose (table sugar ) = glucose + fructose
GalactoseLactose (milk sugar) = glucose + galactose
GlucoseMaltose (malt sugar) = glucose + glucose

Sugar metabolism 1) is the process by which energy contained in the foods that you eat is made available as fuel for your body. The human body handles glucose and fructose — the most abundant sugars in our diet — in different ways. Virtually every cell in the body can break down glucose for energy. The body’s cells can use glucose directly for energy and most cells can also use fatty acids for energy.

how body metabolises sugar

About the only ones that can handle fructose are liver cells. What the liver does with fructose, especially when there is too much in the diet, has potentially dangerous consequences for the liver, the arteries, and the heart 2).

Because glucose and fructose are metabolised differently and when they are consumed in excess they may have different implications for health.

Fructose, also called fruit sugar, was once a minor part of our diet. In the early 1900s, the average American took in about 15 grams of fructose a day (about half an ounce), most of it from eating fruits and vegetables. Today we average four or five times that amount, almost all of it from the refined sugars used to make breakfast cereals, pastries, sodas, fruit drinks, and other sweet foods and beverages.

Refined table sugar, called sucrose, is half glucose and half fructose. High-fructose corn syrup is about 55% fructose and 45% glucose.

It is easy to over-consume sugar in juice and sweet drinks, as they contain mostly water and sugar. One glass of orange juice can contain concentrated sugar from five or six whole oranges. And while it is easy to drink that much sugar, you would be less likely to eat that many oranges in one go.

Fizzy drinks do not make you feel full as quickly as foods do. This makes them easy to over-consume. And a small fizzy drink contains nine teaspoons of added sugar, so drinking just one can means that you have almost reached your recommended maximum intake for that whole day.

The American Heart Association’s guideline is the most frequently used guideline by public health officials. It suggests limiting added sugar to less than 6 teaspoons/day (25 g) for women, 3-6 tsp. (12-25 g) for children, and 9 tsp. (36 g) for men 3). The World Health Organization limit is fairly similar: It suggests that we should be consuming no more than 5% of our daily calories in added sugar, which amounts to about 25 g of added sugar in a 2,000-calorie diet.

A panel convened by the Institute of Medicine recommended the highest dietary limit, that no more than 25% of daily calories should be consumed in added sugar. We do not support this high a limit because studies have shown that consuming sugar at this level could significantly increase your chance of death from heart disease and stroke ,1 as well as affect your metabolism in ways that put you at risk for a range of chronic diseases.2

recommended daily sugar intake

Glucose

Glucose is an essential nutrient for the human body. It is the major energy source for many cells, which depend on the bloodstream for a steady supply. Blood glucose levels, therefore, are carefully maintained. The liver plays a central role in this process by balancing the uptake and storage of glucose via glycogenesis and the release of glucose via glycogenolysis and gluconeogenesis. The several substrate cycles in the major metabolic pathways of the liver play key roles in the regulation of glucose production.

Looking at glucose first, when food is consumed, there is a corresponding rise and subsequent fall in blood glucose level, as glucose is absorbed from the gastrointestinal tract into the blood and then taken up into the cells in the body.

Glucose in the blood stimulates the pancreas to release insulin, which then triggers uptake of glucose by cells in the body (e.g. muscle cells) causing blood glucose to return to base levels. Insulin will turn off fat burning and promote glucose burning as the body’s primary fuel source. Any excess glucose ends up being stored as glycogen in the muscles, and it can also be stored as lipid in the fat tissue.

Glucose Metabolism

Glucose metabolism (Cellular respiration) can take place either in the presence or absence of oxygen leaving separate end products respectively 4) and it involves 3 stages for the breakdown of glucose –

  1. Glycolysis,
  2. Kreb’s cycle and
  3. The electron transport system.

Glucoregulation is the maintenance of steady levels of glucose in the body and the hormone insulin is the primary regulatory signal in human and when present, it causes many tissue cells to take up glucose from the circulation, causes some cells to store glucose internally in the form of glycogen, causes some cells to take in and hold lipids, and in many cases controls cellular electrolyte balances and amino acid uptake as well. Its absence turns off glucose uptake into cells, reverses electrolyte adjustments, begins glycogen breakdown and glucose release into the circulation by some cells, begins lipid release from lipid storage cells. The level of circulatory glucose (known informally as “blood sugar”) is the most important signal to the insulin-producing cells. Because the level of circulatory glucose is largely determined by the intake of dietary carbohydrates, diet controls major aspects of metabolism via insulin. In humans, insulin is made by beta cells in the pancreas, fat is stored in adipose tissue cells, and glycogen is both stored and released as needed by liver cells. Regardless of insulin levels, no glucose is released to the blood from internal glycogen stores from muscle cells.

The hormone glucagon, on the other hand, has an effect opposite to that of insulin, forcing the conversion of glycogen in liver cells to glucose, which is then released into the blood. Muscle cells, however, lack the ability to export glucose into the blood. The release of glucagon is precipitated by low levels of blood glucose. Other hormones, notably growth hormone, cortisol, and certain catecholamines (such as epinepherine) have glucoregulatory actions similar to glucagon.

Typically, a breakdown of one molecule of glucose by aerobic respiration (i.e. involving both glycolysis and Krebs cycle) is about 33-35 ATP  5). This is categorized as:

  • Anaerobic breakdown by Glycolysis – yielding 8-10 ATP
  • Aerobic respiration by Krebs cycle – yielding 25 ATP

energetics of cellular glucose metabolism

(Source 6)).

Metabolism of glucose leads to its breakdown to pyruvate. This pyruvate can have one of the following three fates:

  1. Breaks down to lactic acid in the presence of enzyme lactate dehydrogenase in vigorously contracting skeletal muscles, in certain micro-organisms etc. (called lactic acid fermentation)(Anaerobic Respiration)
  2. Breaks down to ethanol and carbon dioxide in some plant tissues, invertebrates and microorganisms (e.g. yeast) (called alcoholic fermentation) (Anaerobic Respiration)
  3. Enters aerobic respiration in Kreb’s Cycle to form carbon dioxide and water. (Aerobic Respiration)

These glucose molecules can be either stored as starch or glycogen in the body. When excessive energy is demanded by the body, this reserve is broken down to produce energy aerobically or anaerobically.

  • Aerobic Glucose Cellular respiration takes place in three steps:

Step 1) Glycolysis (Embden-Meyerhof pathway) : All glycolysis reactions take place in the cytosol as all the enzymes required for the pathway are present here. In glycolysis one glucose molecule is converted to two pyruvate molecules with the release of energy in the form of ATP and NADH. This pathway is divided into two phases the preparatory phase and the pay-off phase. See : Glycolysis Diagram below.

glucose metabolism

Step 2) Kreb’s Cycle or Citric Acid Cylce or Tricarboxylic Acid Cycle: Glycolysis of 1 molecule of glucose produces 2 molecules of pyruvate. The pyruvate formed in glycolysis then gets converted to acetyl CoA in the mitochondria. The net energy produced by the Kreb’s cycle for each molecule of pyruvate is doubled for each molecule of glucose. In the mitochondria enzymatic reactions occur known as Kreb’s Cycle to breakdown the acetyl CoA into CO2 and H2O with the release of energy in the form of ATP, NADH and FADH2. Kreb’s cycle is a very important step in the metabolic pathway as it produces about 60-70% of ATP for release of energy in the body. It directly or indirectly connects with all the other individual pathways in the body too. It takes place in the mitochondria as all the enzymes and co-enzymes required are present there. See : Kreb’s diagram below.

krebs cycle

Thus net energy yield in Kreb’s cycle can be summarized as follows for each molecule of glucose:

ReactionNumber of ATP or reduced coenzyme formed*Number of ATP ultimately formed
2 Pyruvate → 2 acetyl CoA2 NADH5
2 Isocitrate → 2 α- ketoglutarate2 NADH5
2 α- ketoglutarate → 2 succinyl CoA2 NADH5
2 Succinyl CoA → 2 succinate2 ATP2
2 Succinate → 2 fumarate2 FADH23
2 Malate → 2 oxaloacetate2 NADH5
TOTAL25 ATP

(Source 7)).

Krebs Cycle Full

(Source 8)).

Step 3) Electron transport system: The reduced coenzymes (NADH and FADH2) formed in glycolysis and Kreb’s cycle are oxidized by giving up the protons and electrons to oxygen present in the mitochondria to synthesize ATP by oxidative phosphorylation.

Fructose

Fructose is also taken up into the blood from the gut, but in this case, the liver serves as a pre-processing organ that can convert fructose to glucose or fat. The liver can release the glucose and fat into the blood or store it as glycogen or fat depots, which, if sugars are consumed in excess, may lead to fatty liver disease and also increase risk for diabetes and cardiovascular disease.

There are also some noted interaction effects between glucose and fructose, in that glucose enables fructose absorption from the gut, while fructose can accelerate glucose uptake and storage in the liver.

If the sugar comes with its inherent fibre (as with whole fruit) then up to 30% of this sugar will not be absorbed. Instead, it will be metabolised by the microbes in the gut, which may improve microbial diversity and help prevent disease. The fibre will also mean a slower rise in blood glucose, which has shown to have positive health effects.

sugar metabolism

Absorption and Metabolism of Fructose

High dietary fructose is a major contributor to insulin resistance and metabolic syndrome, disturbing tissue and organ functions 9). Fructose is mainly absorbed into systemic circulation by glucose transporter 2 (GLUT2) and GLUT5, and metabolized in liver to produce glucose, lactate, triglyceride (TG), free fatty acid (FFA), uric acid (UA) and methylglyoxal (MG). Its extrahepatic absorption and metabolism also take place. High levels of these metabolites are the direct dangerous factors. During fructose metabolism, ATP depletion occurs and induces oxidative stress and inflammatory response, disturbing functions of local tissues and organs to overproduce inflammatory cytokine, adiponectin, leptin and endotoxin, which act as indirect dangerous factors. Fructose and its metabolites directly and/or indirectly cause oxidative stress, chronic inflammation, endothelial dysfunction, autophagy and increased intestinal permeability, and then further aggravate the metabolic syndrome with tissue and organ dysfunctions.

fructose metabolism

This diagram addresses fructose-induced metabolic syndrome, and the disturbance effects of direct and/or indirect dangerous factors on the functions of liver, adipose, pancreas islet, skeletal muscle, kidney, heart, brain and small intestine. The metabolites of fructose catabolism and the adverse effects of high fructose consumption on tissue and organ functions in a direct and/or indirect manner. Fructose is mainly metabolized in liver to produce glucose, lactate, triglyceride, free fatty acid (FFA), uric acid and methylglyoxal (MG). High levels of these metabolites are the direct dangerous factors. These dangerous factors impair the functions of local tissues and organs to overproduce inflammatory cytokine, adiponectin, leptin and endotoxin, which act as indirect dangerous factors. Meanwhile, glucose, insulin and ghrelin contents in system circulation are also disturbed. Fructose and its metabolites directly and/or indirectly cause oxidative stress, chronic inflammation, endothelial dysfunction, autophagy and increased intestinal permeability, and then further aggravate metabolic syndrome with tissue and organ dysfunctions. DHAP (dihydroxyacetone phosphate) ; TG (triglyceride) ; FFA (free fatty acid) ; UA (uric acid) ; MG (methylglyoxal) ; VLDL-TG (very low-density lipoprotein triglyceride). DNL (de novo lipogenesis). E1: Serine palmitoyl transferase; E2: 3-ketodihydrosphingosine reductase; E3: Ceramide synthase; E4: Dihydroceramide desaturase.

The breakdown of fructose in the liver does more than lead to the buildup of fat. It also:

  • elevates triglycerides
  • increases harmful LDL (so-called bad cholesterol)
  • promotes the buildup of fat around organs (visceral fat)
  • increases blood pressure
  • makes tissues insulin-resistant, a precursor to diabetes
  • increases the production of free radicals, energetic compounds that can damage DNA and cells.
  • None of these changes are good for the arteries and the heart.

Researchers have begun looking at connections between fructose, fatty liver disease, and cardiovascular disease. The early results are in line with changes listed above due to the metabolism of fructose.

An article published in 2010 in The New England Journal of Medicine indicated that people with nonalcoholic fatty liver disease are more likely than those without it to have buildups of cholesterol-filled plaque in their arteries. They are also more likely to develop cardiovascular disease or die from it. In fact, people with nonalcoholic fatty liver disease are far more likely to die of cardiovascular disease than liver disease.

A report from the Framingham Heart Study has linked nonalcoholic fatty liver disease with metabolic syndrome, a constellation of changes that is strongly associated with cardiovascular disease. Other studies have linked fructose intake with high blood pressure.

A 6 year follow up study supported by the National Heart, Lung and Blood Institute published in the American Heart Association journal, Circulation, linked regular consumption of sugar-sweetened drinks (such as sodas and fruit drinks) to increased visceral fat, a type of body fat that may contribute to a higher risk of diabetes and heart disease 10).

Summary

Virtually every cell in the body can use glucose for energy. In contrast, only liver cells break down fructose. What happens to fructose inside liver cells is complicated. One of the end products is triglyceride, a form of fat. Uric acid and free radicals are also formed.

Fructose is widely found in natural foods, including fruits, vegetables and honeys, and is added to commercial food additives. Over consumption of fructose is a risk factor for the epidemic of metabolic syndrome, with dysfunctions in multiple tissues and organs including liver, adipose, pancreatic islet, skeletal muscle, kidney, heart, brain and intestine.

Fruit is good for you and is a minor source of fructose for most people.

Experts still have a long way to go to connect the dots between fructose and nonalcoholic fatty liver disease, obesity, diabetes, heart disease, and cancer. Higher intakes of fructose are associated with these conditions, but clinical trials have yet to show that it causes them. There are plenty of reasons to avoid sugary drinks and foods with added sugar, like empty calories, weight gain, and blood sugar swings.

The American Heart Association does not distinguish between types of added sugars — to your body they’re identical. Instead, focus on your total intake because eating too much added sugar leads to being overweight and obese, which are risk factors for diabetes 11). The American Heart Association also recommends that most women get no more than 100 calories a day of added sugar from any source, and that most men get no more than 150 calories a day of added sugar. That’s about 6 teaspoons of added sugar for women and 9 teaspoons for men by limiting the amount of sugar you get from sugar-sweetened drinks, pastries, desserts, breakfast cereals, and more, mainly to avoid gaining weight. The same strategy could also protect your liver and your arteries.

Carbohydrate Metabolism Disorders

Metabolism is the process your body uses to make energy from the food you eat. Food is made up of proteins, carbohydrates, and fats. Chemicals in your digestive system (enzymes) break the food parts down into sugars and acids, your body’s fuel. Your body can use this fuel right away, or it can store the energy in your body tissues. If you have a metabolic disorder, something goes wrong with this process.

Sucrose (table sugar) is made of two simpler sugars called glucose and fructose. Lactose (milk sugar) is made of glucose and galactose. Both sucrose and lactose must be broken down into their component sugars by enzymes before the body can absorb and use them. The carbohydrates in bread, pasta, rice, and other carbohydrate-containing foods are long chains of simple sugar molecules. These longer molecules must also be broken down by the body. If an enzyme needed to process a certain sugar is missing, the sugar can accumulate in the body, causing problems.

Carbohydrate metabolism disorders are a group of metabolic disorders. Normally your enzymes break carbohydrates down into glucose (a type of sugar). If you have one of these disorders, you may not have enough enzymes to break down the carbohydrates. Or the enzymes may not work properly. This causes a harmful amount of sugar to build up in your body. That can lead to health problems, some of which can be serious. Some of the disorders are fatal 12).

These disorders are inherited 13). Newborn babies get screened for many of them, using blood tests. If there is a family history of one of these disorders, parents can get genetic testing to see whether they carry the gene. Other genetic tests can tell whether the fetus has the disorder or carries the gene for the disorder.

Treatments may include special diets, supplements, and medicines. Some babies may also need additional treatments, if there are complications. For some disorders, there is no cure, but treatments may help with symptoms 14).

Hereditary Fructose Intolerance

Hereditary fructose intolerance is caused by lack of the enzyme needed to metabolize fructose. Very small amounts of fructose cause low blood sugar levels and can lead to kidney and liver damage 15).

In this disorder, the body is missing an enzyme that allows it to use fructose, a sugar present in table sugar (sucrose) and many fruits. As a result, a by-product of fructose accumulates in the body, blocking the formation of glycogen and its conversion to glucose for use as energy. Ingesting more than tiny amounts of fructose or sucrose causes low blood sugar levels (hypoglycemia), with sweating, confusion, and sometimes seizures and coma. Children who continue to eat foods containing fructose develop kidney and liver damage, resulting in jaundice, vomiting, mental deterioration, seizures, and death. Chronic symptoms include poor eating, failure to thrive, digestive symptoms, liver failure, and kidney damage. For most types of this disorder, early diagnosis and dietary restrictions started early in infancy can help prevent these more serious problems.

The diagnosis is made when a chemical examination of a sample of liver tissue determines that the enzyme is missing. Treatment involves excluding fructose (generally present in sweet fruits), sucrose, and sorbitol (a sugar substitute) from the diet. Severe attacks of hypoglycemia respond to glucose given by vein. Milder attacks are treated with glucose tablets, which should be carried by anyone who has hereditary fructose intolerance 16).

Mucopolysaccharidoses

Complex sugar molecules called mucopolysaccharides are essential parts of many body tissues. In mucopolysaccharidoses, the body lacks enzymes needed to break down and store mucopolysaccharides. As a result, excess mucopolysaccharides enter the blood and are deposited in abnormal locations throughout the body.

Mucopolysaccharidoses are a group of hereditary disorders in which complex sugar molecules are not broken down normally and accumulate in harmful amounts in the body tissues. The result is a characteristic facial appearance and abnormalities of the bones, eyes, liver, and spleen, sometimes accompanied by intellectual disability 17).

  • Mucopolysaccharidoses occur when the body lacks enzymes needed to break down and store complex sugar molecules (mucopolysaccharides).
  • Typically, symptoms include short stature, hairiness, stiff finger joints, and coarseness of the face.
  • The diagnosis is based on symptoms and a physical examination.
  • Although a normal life span is possible, some types cause premature death.
  • A bone marrow transplant may help.

During infancy and childhood, short stature, hairiness, and abnormal development become noticeable. The face may appear coarse. Some types of mucopolysaccharidoses cause intellectual disability to develop over several years. In some types, vision or hearing may become impaired. The arteries or heart valves can be affected. Finger joints are often stiff.

A doctor usually bases the diagnosis on the symptoms and a physical examination. The presence of a mucopolysaccharidosis in other family members also suggests the diagnosis. Urine tests may help but are sometimes inaccurate. X-rays may show characteristic bone abnormalities. Mucopolysaccharidoses can be diagnosed before birth by using amniocentesis or chorionic villus sampling.

Prognosis and Treatment

The prognosis depends on the type of mucopolysaccharidosis. A normal life span is possible. Some types, usually those that affect the heart, cause premature death.

In one type of mucopolysaccharidosis, attempts at replacing the abnormal enzyme have had limited, temporary success. Bone marrow transplantation may help some people. However, death or disability often results, and this treatment remains controversial 18).

Disorders of Pyruvate Metabolism

Pyruvate is a substance that is formed in the processing of carbohydrates and proteins and that serves as an energy source for cells. Problems with pyruvate metabolism can limit a cell’s ability to produce energy and allow a buildup of lactic acid, a waste product. Many enzymes are involved in pyruvate metabolism. A hereditary deficiency in any one of these enzymes results in one of a variety of disorders, depending on which enzyme is missing.

Pyruvate metabolism disorders are caused by a lack of the ability to metabolize a substance called pyruvate. These disorders cause a buildup of lactic acid and a variety of neurologic abnormalities 19).

  • A deficiency in any one of the enzymes involved in pyruvate metabolism leads to one of many disorders.
  • Symptoms include seizures, intellectual disability, muscle weakness, and coordination problems.
  • Some of these disorders are fatal.
  • Some children are helped by diets that are either high in fat and low in carbohydrates or high in carbohydrates and low in protein.

Symptoms may develop any time between early infancy and late adulthood. Exercise and infections can worsen symptoms, leading to severe lactic acidosis. These disorders are diagnosed by measuring enzyme activity in cells from the liver or skin.

Pyruvate Dehydrogenase Complex Deficiency

This disorder is caused by a lack of a group of enzymes needed to process pyruvate. This deficiency results in a variety of symptoms, ranging from mild to severe. Some newborns with this deficiency have brain malformations. Other children appear normal at birth but develop symptoms, including weak muscles, seizures, poor coordination, and a severe balance problem, later in infancy or childhood. Intellectual disability is common.

This disorder cannot be cured, but some children are helped by a diet that is high in fat and low in carbohydrates 20).

Absence of Pyruvate Carboxylase

Pyruvate carboxylase is an enzyme. A lack of this enzyme causes a very rare condition that interferes with or blocks the production of glucose from pyruvate in the body. Lactic acid and ketones build up in the blood. Often, this disease is fatal. Children who survive have seizures and severe intellectual disability, although there are recent reports of children with milder symptoms. There is no cure, but some children are helped by eating frequent carbohydrate-rich meals and restricting dietary protein 21).

Glycogen Storage Diseases

Glycogen is made of many glucose molecules linked together. The sugar glucose is the body’s main source of energy for the muscles (including the heart) and brain. Any glucose that is not used immediately for energy is held in reserve in the liver, muscles, and kidneys in the form of glycogen and is released when needed by the body.

Glycogen storage diseases occur when there is a defect in the enzymes that are involved in the metabolism of glycogen, resulting in growth abnormalities, weakness, and confusion 22).

  • Glycogen storage diseases are caused by lack of an enzyme needed to change glucose into glycogen and break down glycogen into glucose.
  • Typical symptoms include weakness, sweating, confusion, kidney stones, and stunted growth.
  • The diagnosis is made by examining a piece of tissue under a microscope (biopsy).

Treatment depends on the type of glycogen storage disease and usually involves regulating the intake of carbohydrates.

There are many different glycogen storage diseases (also called glycogenoses), each identified by a roman numeral. These diseases are caused by a hereditary lack of one of the enzymes that is essential to the process of forming glucose into glycogen and breaking down glycogen into glucose. About 1 in 20,000 infants has some form of glycogen storage disease.

Types and Characteristics of Glycogen Storage Diseases

Name

Affected Organs, Tissues, or Cells

Symptoms

Name

Affected Organs, Tissues, or Cells

Symptoms


Type O


Liver or muscle


Episodes of low blood sugar levels (hypoglycemia) during fasting if the liver is affected


von Gierke’s disease (type IA)


Liver and kidney


Enlarged liver and kidney, slowed growth, very low blood sugar levels, and abnormally high levels of acid, fats, and uric acid in blood


Type IB


Liver and white blood cells


Same as in von Gierke’s disease but may be less severe


Low white blood cell count, recurring infections, and inflammatory bowel disease


Pompe’s disease (type II)


All organs


Enlarged liver and heart and muscle weakness


Forbes’ disease (type III)


Liver, muscle, and heart


Enlarged liver or cirrhosis, low blood sugar levels, muscle damage, heart damage, and weak bones in some people


Andersen’s disease (type IV)


Liver, muscle, and most tissues


Cirrhosis, muscle damage, and delayed growth and development


McArdle disease (type V)


Muscle


Muscle cramps or weakness during physical activity


Hers’ disease (type VI)


Liver


Enlarged liver


Episodes of low blood sugar during fasting


Often no symptoms


Tarui’s disease (type VII)


Skeletal muscle and red blood cells


Muscle cramps during physical activity and red blood cell destruction (hemolysis)

(Source 23))

Symptoms

Some of these diseases cause few symptoms. Others are fatal. The specific symptoms, age at which symptoms start, and their severity vary considerably among these diseases. For types II, V, and VII, the main symptom is usually weakness. For types I, III, and VI, symptoms are low levels of sugar in the blood and protrusion of the abdomen (because excess or abnormal glycogen may enlarge the liver). Low levels of sugar in the blood cause weakness, sweating, confusion, and sometimes seizures and coma. Other consequences for children may include stunted growth, frequent infections, and sores in the mouth and intestines.

Glycogen storage diseases tend to cause uric acid (a waste product) to accumulate in the joints, which can cause gout, and in the kidneys, which can cause kidney stones. In type I glycogen storage disease, kidney failure is common in the second decade of life or later.

Diagnosis and Treatment

The specific type of glycogen storage disease is diagnosed by examining a piece of muscle or liver tissue under a microscope (biopsy).

Treatment depends on the type of glycogen storage disease. For most types, eating many small carbohydrate-rich meals every day helps prevent blood sugar levels from dropping. For people who have glycogen storage diseases that cause low blood sugar levels, levels are maintained by giving uncooked cornstarch every 4 to 6 hours around the clock. For others, it is sometimes necessary to give carbohydrate solutions through a stomach tube all night to prevent low blood sugar levels from occurring at night.

Galactosemia

Galactose is a sugar that is present in milk and in some fruits and vegetables. A deficient enzyme or liver dysfunction can alter the metabolism, which can lead to high levels of galactose in the blood (galactosemia). There are different forms of galactosemia, but the most common and the most severe form is referred to as classic galactosemia.

Galactosemia (a high blood level of galactose) is caused by lack of one of the enzymes necessary for metabolizing galactose, a sugar present in lactose (milk sugar). A metabolite that is toxic to the liver and kidneys builds up. The metabolite also damages the lens of the eye, causing cataracts 24).

  • Galactosemia is caused by lack of one of the enzymes needed to metabolize the sugar in milk.
  • Symptoms include vomiting, jaundice, diarrhea, and abnormal growth.
  • The diagnosis is based on a blood test.
  • Even with adequate treatment, affected children still develop mental and physical problems.
  • Treatment involves completely eliminating milk and milk products from the diet.

What causes galactosemia ?

Classic galactosemia is a rare genetic metabolic disorder. The gene defect for Galactosemia is a recessive genetic trait. This faulty gene only emerges when two carriers have children together and pass it to their offspring. For each pregnancy of two such carriers, there is a 25% chance that the child will be born with the disease and a 50% chance that the child will be a carrier for the gene defect. A child born with classic galactosemia inherits a gene for galactosemia from both parents, who are carriers. A child with Duarte galactosemia inherits a gene for classic galactosemia from one parent and a Duarte variant gene from the other parent 25).

Symptoms

Newborns with galactosemia seem normal at first but, within a few days or weeks, lose their appetite, vomit, become jaundiced, have diarrhea, and stop growing normally. White blood cell function is affected, and serious infections can develop. If treatment is delayed, affected children remain short and become intellectually disabled or may die.

Diagnosis

Galactosemia is detectable with a blood test. This test is done as a routine screening test for newborns in all states in the United States. Before conception, adults with a sibling or child known to have the disorder can be tested to find out whether they carry the gene that causes the disease. If two carriers conceive a child, that child has a 1 in 4 chance of being born with the disease.

Prognosis

If galactosemia is recognized at birth and adequately treated, liver and kidney problems do not develop, and initial mental development is normal. However, even with adequate treatment, children with galactosemia may have a lower intelligence quotient (IQ) than their siblings, and they often have speech problems. Girls often have ovaries that do not function, and only a few are able to conceive naturally. Boys, however, have normal testicular function.

Treatment

Galactosemia is treated by completely eliminating milk and milk products—the source of galactose—from an affected child’s diet. Galactose is also present in some fruits, vegetables, and sea products, such as seaweed. Doctors are not sure whether the small amounts in these foods cause problems in the long term. People who have the disorder must restrict galactose intake throughout life.

References   [ + ]

read more
Health Jade